Vol 41 No 1
2
The Fraser of Allander Institute is Scotland’s leading economic research institute with over 40 years of experience researching, analysing and commentating on the Scottish economy. It is widely regarded as Scotland’s expert authority on economic policy issues.
The ‘Fraser’ undertakes a unique blend of cutting-edge academic research, alongside applied
commissioned economic consultancy in partnership with business, local and national government and the third sector.
The Fraser of Allander has a unique mix of staff expertise, experiences and backgrounds that enables it to bring together cutting-edge economic methods and techniques with practical policy solutions and business strategies.
For over 40 years, The Fraser of Allander Institute Economic Commentary has been the leading publication on the Scottish economy providing authoritative and independent analysis of the Scottish economy.
The Fraser of Allander Institute is a research institute of the Department of Economics and is part of Strathclyde Business School, Scotland’s leading business school.
©University of Strathclyde, 2017
3
At a glance
The UK economy continues to outperform expectations with growth in 2016 of 1.8% and a consensus forecast of near 2.0% growth in 2017.
Scottish growth in 2016 is likely to come in around our post-EU referendum forecast of just 1.0%. Recent business surveys have started to show a pick-up in activity although overall conditions are still fragile.
There remains a high degree of uncertainty around all economic forecasts at this time. In particular, the range of possible outcomes is much wider than normal given the number of ‘big’ political events – not least the Brexit negotiations and the prospects for a 2nd
independence referendum – that cast a shadow over the outlook.
The long-term implications of Scottish independence and the UK’s departure from the EU will be debated at length over the next 18+ months. Irrespective of the final outcome, the
negotiation and referendum processes themselves will add an additional layer of uncertainty for business and act as a possible headwind to short-term growth prospects.
In such uncertain times, we continue to recommend that just as much attention is given to the range of estimates that underpin this outlook as well as our central estimates. Our central forecast is for growth of 1.2% in 2017, 1.3% in 2018 and 1.4% in 2019.
FAI forecast Scottish GVA growth (%) by sector, 2017 to 2019
2017 2018 2019
GVA 1.2 1.3 1.4
Production 1.4 1.5 1.6
Construction 0.7 0.8 0.8
Services 1.2 1.3 1.4
Forecast Scottish unemployment, 2017 to 2019
2017 2018 2019
Unemployment 131,900 141,350 166,300
Rate (%)1 5.0 5.3 6.1
Note: Rounded to the nearest 50. 1 = Rate calculated as total ILO unemployment by total economically active population 16+.
Source: Fraser of Allander Institute
GVA forecast range 2017 to 2019
-3% -2% -1% 0% 1% 2% 3% 4%
2006 2007 2008 2009 2010 2011 2012 2013 2014 2015 2016 2017 2018 2019
A
n
n
u
a
l
G
V
A
G
ro
w
th
4
Summary
Our recent economic forecasts and analysis of the Scottish economy have been set against a period of significant uncertainty.
Political uncertainty is not unusual and for the most part, businesses and investors are used to dealing with changes in government priorities and indeed governments.
However, the current level of such uncertainty is unprecedented. It is also different from normal in that the debates around Brexit and a possible further independence referendum concern the fundamental basis on which the Scottish economy has grown and developed over the last 40 years.
That being said, with so little clarity around many businesses appear to be ‘looking through the uncertainty’ and are continuing to press ahead with day-to-day activities.
Whilst the Scottish economy continues to lag the rest of the UK, a number of recent business surveys point to a welcome pick-up in activity toward the end of 2016 and into 2017.
However, consumers appear wary about the outlook. Indicators of Scottish consumer confidence are much more negative than for the UK as a whole.
It would appear that this, and not just the challenges in the North Sea, is one of the key reasons for Scotland’s relatively weaker recent performance.
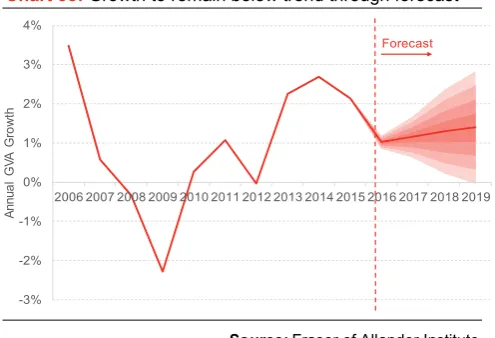
On balance, we forecast that the Scottish economy will continue to grow over the forecast horizon and more quickly than in 2016. The weight of probability suggests that it is likely to remain below-trend as policy uncertainties act as a headwind on growth.
The Scottish labour market continues to hold up remarkably well. Employment rates are close to record highs, whilst the current unemployment rate of 4.7% is well below its long-run average.
However with a rise in inactivity over the year, weak earnings growth and reduced average hours worked, the underlying picture is less positive than the headline figures suggest.
Ultimately, whilst the policy focus will undoubtedly be dominated by ongoing debates around the EU and Scottish independence, it is important not to lose sight of the importance of domestic economic policies.
Over the ten years since the start of the financial crisis in 2007, the Scottish economy has grown by just under 7% - equivalent to an average annual growth rate of 0.7% (less than a third of its long-term trend). GDP per head is just 2% higher over the same ten year period and the incomes of many households remain worse off.
Strategies, action plans and ambitions around inclusive growth will only take us so far. What really matters are clear practical policy actions to support businesses, boost productivity, attract investment and create jobs.
A renewed focus on how both the Scottish and UK Governments can use the current powers at their disposal to support the Scottish economy is needed.
5
Outlook and Appraisal
[image:5.595.48.292.381.570.2]Next month’s statistics are likely to confirm that the Scottish economy grew by just 1%
in 2016. With growth of 1.2% in 2015, the Scottish economy has now been stuck in a
low-growth cycle for nearly two years. With the triggering of Article 50, and plans for a
further independence referendum, the Scottish economy’s resilience is likely to be
further tested over the next year.
Table 1: Scottish growth (%) by sector, Q3 2016
GDP Agriculture Production Construction Services
Q3 +0.2 +0.5 -0.1 -1.4 +0.4
UK +0.6 -0.7 -0.4 -0.8 +1.0
Annual +0.7 +1.4 -2.9 -5.8 +2.1
UK +2.2 -1.7 +1.1 +1.7 +3.1
Source: Scottish Government
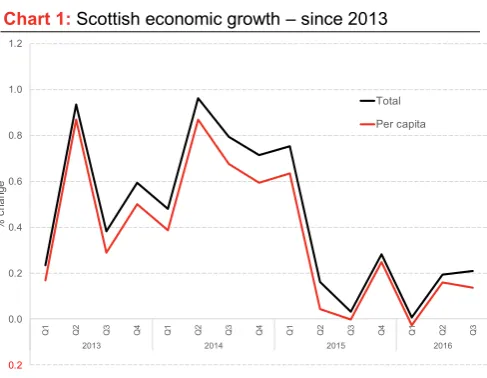
Chart 1: Scottish economic growth – since 2013
[image:5.595.52.286.626.741.2]Source: Scottish Government
Table 2: Labour market, Nov-Jan 2017
Employment
(16-64) Unemployment (16+) Inactivity (16-64)
Scotland 73.7 4.7 22.6
England 74.9 4.7 21.3
Wales 73.3 4.4 23.3
N. Ire 69.4 5.7 26.2
UK 74.6 4.7 21.6
Source: ONS
Introduction
The Scottish economy grew by +0.2% over the 3- months to September 2016.
Whilst this was the first official GDP data since the Brexit vote, there is little evidence that the
referendum was to blame.
Indeed, the UK continues to beat expectations with the data suggesting that – if anything – the UK economy actually picked-up somewhat in the 2nd
half of 2016.
We expect Scottish growth to come in during 2016 at close to our post-referendum forecast of near 1.0%.
The labour market has weakened somewhat, with Scotland now slightly worse-off than the UK on key indicators. On the plus side, this provides a degree of spare capacity to support growth prospects should demand pick-up in the months ahead. And overall, unemployment rates are near record lows.
Most indicators suggest that the Scottish economy continued to grow – albeit at a relatively fragile pace – through the final months of 2016 and into 2017.
The improved near term outlook for the UK should help and provide a welcome source of external demand (Scotland exports around £12bn of goods and services to rUK each quarter).
The outlook for Scotland will be shaped by a series of major political events over the next few months. On balance, we continue to believe that the Scottish economy will grow this year and next,
0.2
0.0 0.2 0.4 0.6 0.8 1.0 1.2
Q1 Q2 Q3 Q4 Q1 Q2 Q3 Q4 Q1 Q2 Q3 Q4 Q1 Q2 Q3
2013 2014 2015 2016
%
c
ha
ng
e
6 although the pattern of growth could be anything
[image:6.595.47.300.552.728.2]but smooth.
Table 3: An improving global outlook – Growth Forecasts
2016 2017 2018
World Output 3.1 3.4 3.6
G7 1.6 1.9 2.0
US 1.6 2.3 2.5
Euro Area 1.7 1.6 1.6
Emerging & Developing 4.1 4.5 4.8
China 6.7 6.5 6.0
World Trade 1.9 3.8 4.1
Source: IMF
Chart 2: Recovery in Europe continues – economic
sentiment on upward trend (> 100 +ve sentiment)
Source: European Commission
Chart 3: Commodity Prices projected to remain flat – with over supply of oil continue to support low oil prices
Source: World Bank, Thomson Reuters Datastream
The global economy
After a relatively weak 2016, most predictions are more positive for world growth in 2017 and 2018.
As with our own forecasts, there is a wide range of possible outcomes, particularly given the policy uncertainties surrounding the Trump administration and how major international players – such as China – choose to respond.
The projected fiscal stimulus in the US is likely to propel it to faster growth in the near-term, but at the expense of rising interest rates (which will have knock-on impacts on emerging and global financial markets). More worrying are the long-term
consequences of a rush toward protectionism which can only harm global growth in the long-run.
The Chinese economy continues to move toward a more sustainable growth trajectory. How well controlled this is remains open to question. Amid heightened worries over debt and financial risk, tough new reforms are being implemented. Growth is projected to be at its slowest rate in over 25 years. The potential for a sharper slowdown than planned, is a key risk facing the global economy.
The recovery in Europe – home to over 40% of Scottish international exports – continues.
Germany was the fastest growing economy in the G7 in 2016. And for the first time in almost a decade, the economies of all EU member states are expected to see positive annual growth in 2017 and 2018. Major challenges remain, including ongoing painful structural reforms. At the same time, the current high levels of unemployment and low wage growth will take years to escape.
Commodity – and in particular energy – prices are forecast to remain relatively weak over the medium term (and well below levels seen at the turn of the decade). Oil has stabilised at around $50 to $55 per barrel: a price which is unlikely to usher in a new wave of investment to the North Sea. But with the fall in Sterling boosting profits (as oil is priced in dollars), it may be sufficient to counter some of the slowdown in activity provided that costs remain low and the tax environment becomes more favourable.
80 85 90 95 100 105 110 115
2013 2014 2015 2016 2017
Sent
iment i
ndi
cator
(>100: +
ve, <
100:
-v
e)
EU Germany Spain France Italy
50 60 70 80 90 100 110 120
2014 2015 2016 2017 2018 2019 2020
(Pric
e i
n 2010
= 1
00)
Energy Agriculture
7
Chart 4: UK growth accelerated post EU referendum
Source: ONS, Thomson Reuters Datastream
Chart 5: But growth unbalanced – all coming from consumption
Source: ONS, Thomson Reuters Datastream
Chart 6: Consumption supported by higher household
income – but increasingly reliant on savings and borrowing
Source: ONS, Thomson Reuters Datastream
The UK Economy
The UK economy has held up remarkably well post the EU referendum. Growth has been close to its long-term average and if anything, the data shows the UK economy strengthening in the 2nd half of
the year.
In the end, the financial market volatility and uncertainty observed during the summer – including in key business surveys – failed to materialise into real economic data.
There are a number of reasons for this, not least the decisive action taken by the Bank of England to shore up financial markets. Stronger momentum in global activity, higher global equity prices, more supportive credit conditions particularly for
households and the first sustained rise in real earnings since the financial crisis, have all helped.
Moreover, it would appear that with so many different scenarios now possible, many consumers and businesses have so far chosen to ‘look
through the uncertainty’ and continue day-to-day operations as planned. How long this will continue with Article 50 triggered remains to be seen.
As Chart 5 highlights, the source of the better than expected UK economic data over the last year has been robust growth in consumption. Indeed, household spending has been responsible for the entire net growth in the UK economy during 2016.
Some of this reflects a pick-up in real household incomes. But more recently, a significant driver has been a drawing down of savings and an increase in borrowing. Indeed the UK savings rate is now close to record lows. This appears to be driven by improved expectations for the economy, robust house price growth in England and cheap credit.
Whilst fuelling short-term growth, the long-term implications of such trends pose risks to the medium term outlook for the UK. In their most recent Economic and Fiscal Outlook, the OBR have run a number of different scenarios for what may happen to the UK economy should
consumers quickly reign back their spending.
0.0 0.1 0.2 0.3 0.4 0.5 0.6 0.7 0.8
Q1 Q2 Q3 Q4
Q
uarterly
G
row
th
(%
c
hange)
-1.0 -0.5 0.0 0.5 1.0 1.5 2.0 2.5
Annu
al
G
row
th
(%
poi
nt c
ontribu
tion)
-1.0 -0.5 0.0 0.5 1.0 1.5
8
Chart 7: Inflation projected to continue to rise sharply in 2017
Source: Bank of England, OBR & IMF
Chart 8: Actual and planned business investment show signs of weakness as uncertainty bites
Source: ONS, Business investment in the UK & BofE
Chart 9: PMI for UK remains positive suggesting a strong start to 2017
Source: IHS Markit * Above 50 = expansion of activity, below 50 = contraction.
Whatever scenario occurs, the outlook for consumer spending is substantially weaker this year than last.
The value of sterling is around 18% below its November 2015 peak, reflecting market
perceptions that a lower exchange rate is needed following the UK’s withdrawal from the EU.
A consequence of weaker sterling is that higher import costs will cause inflation to overshoot the Bank of England’s 2% target. Inflation rose to 1.8% in January and further increases are likely over the coming months. The Bank of England expect inflation to peak at 2.8% toward the end of this year. That being said, with significant uncertainty around how the UK economy might react to Brexit, the MPC appear reluctant to take any immediate decision to raise interest rates.
Rising inflation coupled with moderation in pay growth as employment levels remains flat, is likely to mean materially weaker real income growth over the coming few years: another reason why consumer spending is likely to slow.
Despite the depreciation in sterling, net trade has still acted as a drag on growth although it should have a positive impact – albeit modest – in the coming months.
Unsurprisingly given heightened levels of uncertainty, actual levels of investment and measures of future intentions have weakened – Chart 8. Overall, business investment in the UK fell 0.9% in 2016. Results from the Bank of England’s Agents of investment planning also remain low – although the figures did pick-up slightly in January 2017.
Despite these developments, the momentum established in late 2016, points to a positive outlook for early 2017. Up-to-date indicators of economic performance, including the IHS Markit PMI, remain above the cut-off of 50 which marks the boundary between expansion and contraction.
The OBR predict growth of 0.6% in Q1 before slowing to 0.3% per quarter for the remainder of the year.
-0.5 0 0.5 1 1.5 2 2.5 3 3.5
2013 2014 2015 2016 2017 2018 2019 2020
%
change on
year
earli
er
Bank of England OBR IMF
0.0 0.5 1.0 1.5 2.0 2.5 3.0
-4 -2 0 2 4 6 8
2010 2011 2012 2013 2014 2015 2016 2017 Q
ua
rt
e
rly
I
nd
e
x
Sc
o
re
Q
ua
rt
e
rly
C
ha
ng
e
(%
)
Business Investment Growth (LHS) BofE Agent Survey Manufacturing (RHS) BofE Agent Survey Services (RHS)
40 45 50 55 60
Feb
2015 Apr Jun Aug Oct Dec 2016Feb Apr Jun Aug Oct Dec 2017Feb
Ba
la
nc
e
of
R
es
po
nd
en
ts
(>
50
=
e
xp
an
si
on
)
9
Table 4: OBR forecasts, Spring Budget 2017
2016 2017 2018 2019 2020
GDP 1.8 2.0 1.6 1.7 1.9
revision -0.2 -0.2 -0.5 -0.4 -0.2
CPI Inflation 0.7 2.4 2.3 2.0 2.0
revision 0.0 +0.8 +0.3 -0.1 0.0
Unemployment (%
rate) 4.9 4.9 5.1 5.2 5.2
revision -0.1 -0.1 -0.1 -0.1 -0.1
Source: OBR * Italics are change from March 2016 forecast
Chart 10: Revisions to growth forecasts – 2016: 2020/21
[image:9.595.47.291.576.756.2]Source: OBR
Table 5: OBR forecast of nominal GDP (£ billion)
2016/17 2017/18 2018/19 2019/20 2020/21
March 17 1,964 2,029 2,095 2,168 2,251
Nov 16 1,951 2,001 2,083 2,167 2,253
Source: OBR
Chart 11: Growth weaker as consumption tails off
Source: OBR
The UK Economic Outlook
As highlighted above, the near term economic outlook for the UK economy has improved.
Buoyed by robust consumer spending, most forecasters have revised up their predictions for growth in 2017.
The OBR for example, are now forecasting that the UK economy will grow by 2.0% in 2017 – higher than their forecast of 1.4% made back in the Autumn Statement in November.
But these improvements are short-term and largely superficial. Although forecasts have been revised up for 2017, they have been revised down for 2018, 2019 and 2020.
As a result, UK national income is projected to be essentially unchanged by 2020 vis-à-vis what the OBR had forecast in November.
Most economists still predict that growth will slow over the next couple of years as the economy adjusts to life outside the EU.
Overall, despite recent media attention on the positive performance of the UK economy post EU referendum (relative to forecast), the underlying picture painted by the OBR’s economic and fiscal outlook remains weak (and much poorer than before the referendum in June).
Per capita GDP growth is forecast to average just 1.2% over the coming years, well below its post-war historic average.
This time last year, the OBR forecast average real earnings would return above their 2008 peak by 2020, but it now expects real earnings growth to be weak in 2017, and not return to the 2008-peak until 2021.
Rising inflation is likely to make it particularly challenging for households exposed to rising food and fuel prices. It will also make it much more challenging for families reliant on working age benefits which continue to be frozen in cash terms. 2
2.2
2.1 2.1 2.1
2.1
1.4
1.7
2.1 2.1
2
1.8
2
1.6 1.7
1.9 2
0 0.5 1 1.5 2 2.5
2016 2017 2018 2019 2020 2021
A
nn
ua
l
G
ro
w
th
(%
c
ha
ng
e
)
Budget 2016 Autumn Statement 2016 Budget 2017
-0.4 -0.2 0 0.2 0.4 0.6 0.8
2015 2016 2017 2018 2019 2020 2021 2022
C
o
nt
ri
bu
tio
n
to
q
ua
rt
e
rly
G
D
P
(%
p
o
in
t)
Consumption Investment Government
10
Chart 12: Weak outlook for household incomes –
particularly in short-term (0% growth in 2017)
Source: OBR
Chart 13: Short-term revision to UK Government borrowing forecasts, but medium term trend remains
[image:10.595.49.295.71.261.2]Source: OBR
Table 6: Budget Consequentials for Scotland
2017/18 2018/19 2019/20 2020/21 Total
Consequentials announced in Budget 2017
RDEL 124 85 51 n/a 260
CDEL 21 22 24 23 90
Consequentials as % SG totals (Autumn Statement 2016)
RDEL 0.47% 0.32% 0.19% n/a 0.33% CDEL 0.68% 0.67% 0.68% 0.63% 0.66%
Source: HM Treasury
The Spring Budget
Earlier this month, the Chancellor delivered the final Spring Budget. Alongside the short-term good news on the economy, Phillip Hammond was able to report a downward revision in borrowing for the year.
But again, this is short-lived. The OBR predict that the government is still on track to borrow £30bn per year more in 2020/21 than it intended in March last year.
With public sector borrowing forecast to be around 1% of GDP by 2019/20, the Chancellor has some ‘wriggle-room’ to meet his fiscal target (which is to reduce cyclically adjusted borrowing to no more than 2% of GDP by 2020/21). He may well need it. The forecasts are predicated on an improvement in productivity growth to 1.6% in 2017 and beyond – way above recent trends.
The Budget was relatively thin on specific tax and spending announcements – and even thinner by the time the Chancellor u-turned on his decision to change the tax treatment of self-employed
workers.
He did announce an additional £2bn spending on social care in England over three years; some additional spending on education; and moderate further increases in capital spending on top of those set out in November.
The subsequent consequentials for Scotland amount to £350m over the course of the parliament – £260m revenue and £90m capital.
In the context of a planned real-terms cut of £800m (i.e. adjusted for inflation) in Scotland’s resource budget between 2016/17 and 2019/20, an additional £260m in cash is not an insignificant boost. But spread over 3 years it does not alter the conclusion that Holyrood will face challenging real terms reductions up to the end of the decade.
If the UK Government maintains its ambition to run a surplus in the next parliament, further cuts beyond 2020/21 are likely – taking the period of consolidation to well over a decade.
-5.0 -4.0 -3.0 -2.0 -1.0 0.0 1.0 2.0 3.0 4.0 5.0 6.0
2014 2015 2016 2017 2018 2019 2020 2021
Perc
entage
poi
nts
Net benefits and taxes Non-labour income Prices Labour income Total
-1.0 -0.5 0.0 0.5 1.0 1.5 2.0 2.5 3.0 3.5 4.0 4.5
2015-16 2016-17 2017-18 2018-19 2019-20 2020-21
P
ub
lic
s
ec
tor ne
t
bo
rr
ow
ing
(as
% GDP)
11
Chart 14: Scottish vs. UK economic performance
Source: Scottish Government
Chart 15: Average Scottish quarterly growth by time period (and by sector): Pre & post financial crisis
Source: Scottish Government, FAI calculations
Chart 16: Decline in contribution of North Sea to Scottish GDP
Source: Scottish Government, FAI calculations
Recent Scottish Economy Data
In contrast to the relatively robust growth in the UK, the Scottish economy continues to grow much more slowly.
Weak growth in any given quarter is not
uncommon particularly as the Scottish series can be more volatile from time-to-time.
But as Chart 14 highlights, there is little doubt that the most recent data is part of a sustained trend.
We have now seen a year and a half of very muted (or in some Q’s, no) growth. The Scottish economy is believed to have grown by around 0.6% over the last year. To put this in context, average growth
per quarter in 2014 was 0.7%!
There are a number of drivers of these results.
As we have discussed in the last two editions of the Fraser Economy Commentary, it is hard to move away from the conclusion that the on-going challenges in the North Sea are continuing to have a significant impact on the wider Scottish
economy.
Industries closely associated to the oil and gas supply chain, such as elements of manufacturing, have fallen sharply. Overall manufacturing is down over 7% over the last three years.
To give an indication of the scale of the shock, Chart 16 plots the share of extra regio (which captures Scotland’s oil and gas output) as a proportion of total Scottish GDP. The latest figures show a fall from a peak of around 18% in Q3 2008 to just 5% in Q3 2016. We cannot expect a decline of this magnitude not to have a significant impact on the on-shore Scottish economy.
There is some evidence however, that the
slowdown may not just be limited to the oil and gas industry.
For example, food and drink is down nearly 2% over the year, the computer and electrical products sector is down nearly 5%, textiles and clothing – albeit a small sector – is down nearly 10% and chemicals and pharmaceuticals down over 8%.
0.0% 0.2% 0.4% 0.6% 0.8% 1.0% 1.2%
Q1 Q2 Q3 Q4 Q1 Q2 Q3 Q4 Q1 Q2 Q3
2014 2015 2016
%
change Q
on Q
Scotland UK
-1.0% -0.5% 0.0% 0.5% 1.0% 1.5% 2.0% 2.5%
GDP Production Construction Services
A
ve
ra
ge
Q
ua
rt
e
rly
G
ro
w
th
1999 to 2006 2007 to 2012 2013 to 2014 2015 to 2016
0% 2% 4% 6% 8% 10% 12% 14% 16% 18% 20%
2005 2006 2007 2008 2009 2010 2011 2012 2013 2014 2015 2016
%
G
D
P
(i
nc
lu
di
ng
g
e
o
gra
ph
ic
a
l
sh
a
re
o
f
N
S)
12
Chart 17: Scottish vs. UK performance by sector over year to Q3 2016
Source: Scottish Government, FAI Calculations
Chart 18: Construction output (nominal): New Work
Source: ONS, Output in the construction industry
Chart 19: Composition of Q3 2016 growth
Source: Scottish Government
Overall, in only three of the major classifications of sectors – agriculture, water and waste
management and businesses services and finance – has Scotland outperformed the UK over the year.
Construction continues to act as a drag on overall Scottish growth – with the sector down nearly 6% over the year.
As we first discussed in the July Commentary, this appears to be part of an adjustment back to more normal levels of activity. Construction grew by over 30% between the start of 2014 and the end of 2015.
We remain somewhat puzzled by the scale of this growth – as the chart highlights the increase appears to have been driven by a significant boost in infrastructure spending. Whilst a large number of projects were delivered during this time, the speed of increase and subsequent fall-back suggests that some classification/reporting issues may be part of the explanation.
The growth that does exist in the Scottish economy continues to be coming through the all-important services sector (which makes up around 75% of the total economy). In contrast to other parts of the economy, the services sector has now grown in each and every quarter since mid-2015.
This is supported, in part, by relatively strong growth in retail and wholesale reflecting a
continued robust uptick in consumer spending. It is also driven by a sharp rise in financial and
insurance activities which are up over 12% on the year.
All that being said, despite this relatively healthy performance in services, one of the explanations why Scotland has lagged the UK is because the UK service sector has been growing even more strongly.
Over the year as a whole, UK services are up 3.1% compared to growth of 2.1% in Scotland.
-10.0 -8.0 -6.0 -4.0 -2.0 -+2.0 +4.0
%
Poi
nt Di
fference
-Sc
ot v
s. UK
0 200 400 600 800 1,000 1,200
Q1 Q2 Q3 Q4 Q1 Q2 Q3 Q4 Q1 Q2 Q3 Q4 Q1 Q2 Q3 Q4 Q1 Q2 Q3 Q4 Q1 Q2 Q3 Q4 Q1 Q2 Q3 Q4 2010 2011 2012 2013 2014 2015 2016
£
m
illi
o
n
Housing Infrastructure Other Public Private Industry Private Commercial
-0.10% -0.05% 0.00% 0.05% 0.10% 0.15% 0.20% 0.25% 0.30%
Total GDP Agriculture,
Forestry & Fishing
Production Construction Services
%
C
ha
ng
e
t
o
G
D
13
Chart 20: Expenditure components of nominal GDP –
households remain most important factor
Source: Scottish Government
Chart 21: Ongoing challenges with Scottish exports – falling manufactured exports for 6 quarters
Source: ONS
Chart 22: House prices remain relatively flat in Scotland – up just 2½% since start of 2014
Source: Nationwide
Similar to that in the UK, household spending has continued to make a sustained positive
contribution to overall growth in recent times. Indeed, it was by far the greatest source of nominal growth in Q3 2016.
Investment (Gross Fixed Capital Formation) fell back somewhat after relatively strong growth in Q2.
The contribution from net trade was positive once again during the quarter but this comes on the back of overall weak performance.
Statistics shows that manufactured exports are down 8% on the year. Engineering exports – which make up around 1/3 of total manufactured exports – have fallen nearly 14% since the start of 2015.
Overall, Scotland’s weak export performance remains a concern and a key challenge for policymakers. Brexit, at least in the short-run, is only going to make tackling these issues even harder.
Scotland’s estimated saving ratio remains low – and fell again in Q3 2016. If this reflects some households using up savings in order to support consumption, and before inflation and employment prospects become more uncertain, then it may not bode well for future growth prospects.
It is unsurprising therefore that we have failed to see much in the way of growth in house prices in recent times. Prices are only up around 2% on 2014 levels.
This does however, hide a significant degree of variability across the country. House prices in Edinburgh continue to grow significantly, whereas Aberdeen and surrounding areas have been seeing much more muted growth (and even falling prices on occasion). In contrast, UK house prices are up 15% over the same period. Muted house price growth may have an impact on consumer confidence in Scotland.
-3.0% -2.5% -2.0% -1.5% -1.0% -0.5% 0.0% 0.5% 1.0% 1.5% 2.0% 2.5%
Q1 Q2 Q3 Q4 Q1 Q2 Q3 Q4 Q1 Q2 Q3
2014 2015 2016
C o nt ri bu tio n to n o m in a l G D P Households General Government
Gross Fixed Capital Formation
Net trade
Nominal GVA growth
-5.0% -4.0% -3.0% -2.0% -1.0% 0.0% 1.0% 2.0% 3.0% 4.0% 5.0% 92 94 96 98 100 102 104 106 108
Q1 Q3 Q4 Q1 Q2 Q3 Q4 Q1 Q2 Q3 Q4 Q1 Q2 Q3 Q4 Q1 Q2 Q3
2012 2013 2014 2015 2016
G ro w th (% ) 2012 Q 1 = 1 00
Quarterly Change (RHS)
Volume of Manufactured Exports (LHS)
-2.5% -1.5% -0.5% 0.5% 1.5% 2.5% 97 98 99 100 101 102 103
Q1 Q2 Q3 Q4 Q1 Q2 Q3 Q4 Q1 Q2 Q3 Q4
2014 2015 2016
Q ua rt e rly C ha ng e (% ) H o us e p ri ce in de x (2 0 1 4 Q 1 = 1 0 0 )
14
Chart 23: Scotland’s Recent Productivity Performance
Source: Scottish Government
Chart 24: Productivity still below trend
Source: ONS and FAI calculations
Chart 25: International Productivity Performance (UK = 100): 2015
Source: ONS and FAI calculations
Productivity Statistics
Since December’s Commentary, we have new data on productivity in Scotland.
This showed growth in labour productivity of 3.5% in 2015. So have we finally turned the corner in terms of boosting Scotland’s long-term economic potential? In short, no.
Productivity growth is fundamental to the long-term health of an economy. If we can produce more output (or better quality output) whilst still working the same hours then we will be better off.
On a positive note, the gap between Scotland and the UK has closed. In 1999, Scotland’s labour productivity (in current prices) was around 95.8% of the UK equivalent figure whereas now it is 99.9%. Productivity in Scotland is now around 9.4% higher than it was in 2007 – although it is still well below where it would have been had it
remained on trend (Chart 24).
But the rise in productivity in 2015 follows 4 years of weak (and sometimes falling) productivity. To an extent, the increase appears to be a one-off bounce back rather than evidence of a sustained improvement.
Furthermore, the UK’s own productivity
performance remains poor. As the chart highlights, UK productivity is around 20% lower than the G7 average (and well below the US, France and Germany). So catching up with the weak performance of the UK is nothing to write home about.
At the same time, some of the growth this year appears to be driven – not from us producing more – but working less to produce the same amount! This is because hours worked fell in 2015.
And whatever happened in 2015, we know that with growth in 2016 – on the measure used in productivity calculations – likely to come in around 0.6%, and rising (or at least flat) hours worked, Scotland’s productivity is likely to have fallen last year rather than increased.
-2% -1% 0% 1% 2% 3% 4%
92 93 94 95 96 97 98 99 100 101
Annu
al
G
row
th
in Produc
iv
ity
Sc
otl
and v
s.UK (UK =
100)
Annual Growth (RHS) Scotland vs. UK (LHS)
80.0 85.0 90.0 95.0 100.0 105.0 110.0 115.0 120.0
199
8
199
9
200
0
200
1
200
2
200
3
200
4
200
5
200
6
200
7
200
8
200
9
201
0
201
1
201
2
201
3
201
4
201
5
2007
= 1
00
60 70 80 90 100 110 120 130 140
UK =
15
Chart 26: Employment & Unemployment: Nov-Jan 2017
Source: ONS, Labour Force Survey
Chart 27: Inactivity Rates: change over year: Nov-Jan 2017
Source: ONS, Labour Force Survey
Chart 28: Employment rate changes by age bracket since
2007
Source: ONS, Labour Force Survey
The Scottish labour market
With relatively fragile data across the economy as a whole, it is no surprise that the Scottish labour market has weakened over the last year.
Employment is down 21,000 over the 12 months to end January. The Scottish employment rate of 73.7% is just under a percentage point lower than the UK rate of 74.6%. But as Chart 26 highlights, the employment rate in Scotland is still relatively robust and near its pre-financial crisis peak.
Overall, the Scottish labour market seems to have held up well despite the recent differences in growth rates with the UK.
Indeed, the most recent data published in
February showed a rise in employment of 16,000 over the quarter with a similar fall in
unemployment.
One feature that continues to come through from the annual picture is that whilst unemployment has fallen sharply, this has been driven – not by people finding work – but by a rise in levels of economic inactivity – Chart 27.
Our Scottish Labour Market Trends report, which
we publish jointly with the Scottish Centre for Employment Research, provides a detailed analysis of developments in the labour market.
One theme this quarter was to monitor how Scotland – and different parts of the country – have fared since the global financial crisis. This analysis highlighted that whilst Scotland entered the financial crisis in a relatively healthier labour market position than the UK as a whole, it has not bounced back to the same extent.
Since 2007, of the different age groups,
employment rates amongst older workers have increased – both in terms of those aged 50-64 and 65+. This has not been the case for most young workers. This ageing of the workforce is likely to be part of a more sustained trend and raises some important issues about the long-term structure of the labour market, and the potential implications for young people seeking work.
69 71 73 75 3 4 5 6 7 8 9
2008 2009 2010 2011 2012 2013 2014 2015 2016 2017
Em pl o ye m nt R a te (1 6 -64) U ne m p lo ye m nt R a te (1 6 + )
Unemployment Rate (LHS) Employment Rate (RHS)
-1.5 -1.0 -0.5 0.0 0.5 1.0 1.5 2.0 2.5
England Wales Scotland Northern Ireland UK
C ha ng e i n R a te o ve r ye a r (% p o in t) -14 -12 -10 -8 -6 -4 -2 0 2 4 6
2007 Q1 2010 Q2 2013 Q3 2016 Q4
In de x, 2 0 0 7 p e a k( by a ge ) = 0
16
Chart 29: RBS/FAI Business Monitor shows some tentative
signs of improved conditions
Source: Fraser of Allander/RBS Scottish Business Monitor
Chart 30: PMI: Scotland lags the UK
Source: IHS Markit
Chart 31: Consumer Confidence remains negative in
Scotland and gap with UK widening
Source: GfK Research
Outlook
There has arguably never been a time in recent history where the range of key fundamental economic policy questions facing Scotland have been so uncertain.
How these issues – and in particular, the Brexit negotiations and prospects of an independence referendum – play out will have a material impact on the outlook for the Scottish economy.
This is not to say that one particular outcome is better than the other. It is simply to make the point that with uncertainty of such a magnitude now in play, we cannot expect these processes
themselves – irrespective of the end result – not to have an impact.
This uncertainty comes at a time when some of the emerging indicators picking up business trading conditions have been starting to show a degree of positivity.
For example, the latest RBS Scottish Business Monitor for the final quarter of 2016 contained some evidence of renewed optimism in the
Scottish economy. The balance of firms reporting a pick-up in new business rose relatively sharply. At the same time, whilst those reporting a change in repeat business remain negative, it was up on Q3.
[image:16.595.49.298.84.266.2]The Bank of Scotland IHS Markit PMI for February reported that business activity in Scotland had increased at its fastest rate since July 2015. The figure of 51.2 is still below the equivalent figure for the UK but it does suggest that growth is picking up as we move into 2017.
In contrast to the slightly more positive sentiment within the business community, levels of consumer confidence in Scotland have continued to slide.
The GfK Consumer Confidence Index (where 0 = balance) fell to -18 in February. Well below the same index in the UK (which whilst also negative was -6).
-20 -10 0 10 20 30
Q1 Q2 Q3 Q4 Q1 Q2 Q3 Q4 Q1 Q2 Q3 Q4
2014 2015 2016
N
e
t
Ba
la
nc
e
(>
0
Po
si
tiv
e
n
e
w
/re
pe
a
t
bu
si
ne
s)
Vol of repeat business
Vol of new business
46 48 50 52 54 56 58 60
2014 2015 2016 2017
Ba
la
nc
e
o
f
re
sp
o
nd
e
nt
s
Scotland UK
-25 -20 -15 -10 -5 0 5 10
May Jun Jul Aug Sep Oct Nov Dec Jan Fe
b
Mar Apr May Jun Jul Aug Sep Oct Nov Dec Jan Fe
b
2015 2016 2017
Net
Bal
ance
17
Chart 32: Confidence negative across all income bands – although pessimism highest amongst low earners
Source: GfK Research
Chart 33: Key driver of lower consumer confidence appears to be deterioration in expectations for economic outlook
Source: Scottish Government
Chart 34: Fall in retail sales index – Q4 2016
Source: Scottish Government
Unpicking the headline results, we see that confidence is weakest amongst those on the lowest household earnings.
This may in part reflect their exposure to recent pressures on welfare benefits and higher food prices. Overall however, all income groups reported a negative result.
One possible explanation for this outlook is the sharp fall in the expectations that households have for the economy in the foreseeable future. The Scottish Government’s own consumer confidence index points to a sharp weakening in expectations about the economy (Chart 33).
Given the share scale of household spending in the economy, this loss in confidence does not bode well for future growth in Scotland.
A useful ‘soft-indicator’ for labour market
conditions is the IHS Markit Jobs Report. The most recent edition showed that 2016 finished on a weak footing, with falls in both permanent and temporary posts, but February was more promising.
With such overall weakness in consumer
[image:17.595.315.553.534.702.2]confidence, it is of no surprise that retail sales fell in the final quarter of 2016 – albeit on the back of relatively robust growth in recent months.
Table 7: Permanent Staff Placements
50 = ‘no change’ Scotland Index
UK Index
2016
Sep 55.2 51.0
Oct 49.8 54.6
Nov 49.1 55.6
Dec 45.6 55.2
2017
Jan 45.7 54.5
Feb 51.6 56.1
Source: IHS Markit -50
-40 -30 -20 -10 0 10 20 30
Aug Sep Oct Nov Dec Jan Feb Mar Apr May Jun Jul Aug Sep Oct Nov Dec Jan Feb
2015 2016 2017
Index
(>0:
pos
iti
ve
outl
ook
, <0
: negati
ve outl
ook
)
Less than £14,500 £14,501 to £24,999 £25,000 to £34,999 £35,000 to £49,999 £50,000+
-10 -5 0 5 10 15 20 25 30 35
Q2 Q3 Q4 Q1 Q2 Q3 Q4 Q1 Q2 Q3 Q4 Q1 Q2 Q3 Q4 2013 2014 2015 2016
Bal
anc
e of expecta
tions
(>0: +
ve, <
0:
-v
e)
Economy Expectations Household Finances Expecations
-1.0% -0.5% 0.0% 0.5% 1.0% 1.5% 2.0%
94 96 98 100 102 104 106 108 110 112
Q1 Q2 Q3 Q4 Q1 Q2 Q3 Q4 Q1 Q2 Q3 Q4 Q1 Q2 Q3 Q4
2013 2014 2015 2016
Q
ua
rt
e
rly
C
ha
ng
e
(%
)
2
0
1
3
=
1
0
0
18
Table 8: Latest growth forecasts for the UK economy
2017 2018 2019
Bank of England 2.0 1.6 1.7
OBR 2.0 1.6 1.7
NIESR 1.7 1.9 2.1
European Commission 1.5 1.2 n/a
IMF 1.1 1.7 1.8
Oxford Economics 1.6 1.3 1.6
ITEM Club 1.3 1.4 1.6
CBI 1.3 n/a n/a
[image:18.595.48.287.292.342.2]Source: HM Treasury
Table 9: Nowcasts for Q42016 and Q12017 for Scotland
Q4 Q1
Quarterly Growth +0.42 +0.38
Annualised Growth +1.69 +1.55
Source: Fraser of Allander Institute Table 10: FAI forecast Scottish GVA growth (%) 2017 to 2019
2017 2018 2019
GVA 1.2 1.3 1.4
Production 1.4 1.5 1.6
Construction 0.7 0.8 0.8
Services 1.2 1.3 1.4
Source: Fraser of Allander Institute
Chart 35: Growth to remain below trend through forecast
Source: Fraser of Allander Institute * Actual data to Q3 2016, central forecast with forecast uncertainty for 2017 – 2019
Uncertainty bands sourced from accuracy of past forecasts at different forecast horizons
Our forecasts
[image:18.595.50.288.389.480.2]Forecasting the immediate outlook for growth in these times of heightened political uncertainty remains challenging.
Table 8 highlights how most independent forecasters predict that the pace of growth will ease over the next few years in the UK.
Our nowcasts – which make use of a wide variety of data sources, including the latest business surveys – suggest that the Scottish economy remains on track to record growth in the first quarter of 2017. Growth of 0.4% would be higher than we have seen in recent quarters.
In looking further forward, as in the past, we report a central forecast but calculate uncertainty bands to set out a likely range within which we predict Scottish GDP will lie. In our view, it is this range that should be just as much the focus of discussion as specific point estimates.
In other words, it is entirely possible that the Scottish economy could grow close to 2% this year, but our assessment is that the probability of that happening is lower than our central projection.
Two major judgement calls are required in making these forecasts.
The first concerns the outlook for the North Sea. Recent developments in the global supply of oil suggest that there is little prospect of a return to higher prices in the near future.
The implications for the oil and gas sector in the North Sea means that this is likely to continue to act as a brake on Scottish growth vis-à-vis the UK. However, after nearly 2½ years of retrenchment the impact at a macro level will start to be reduced.
The second relates to any impact of the major political developments on the wider economy. Since the Brexit referendum, despite heightened levels of business uncertainty, levels of day-to-day activity have held up remarkably well.
-3% -2% -1% 0% 1% 2% 3% 4%
2006 2007 2008 2009 2010 2011 2012 2013 2014 2015 2016 2017 2018 2019
A
nn
ua
l
G
VA
G
ro
w
th
[image:18.595.47.295.531.700.2]19
Table 11: FAI revised forecast %-point change from December 2017 forecast by sector, 2017 to 2019
2017 2018 2019
GVA +0.04 +0.05 -0.17
Production +0.06 -0.01 -0.18
Construction +0.02 +0.07 -0.11
Services +0.04 +0.07 -0.17
Source: Fraser of Allander Institute
Chart 36: Contribution to forecast
[image:19.595.50.287.474.594.2]Source: Fraser of Allander Institute
Table 12: FAI labour market forecast to 2019
2017 2018 2019
Employee Jobs 2,434,650 2,474,650 2,508,100 % employee job
growth over year
+0.3% +1.6 +1.4
ILO
unemployment 131,900 141,350 166,300
Rate (%)1 5.0 5.3 6.1
Source: Fraser of Allander Institute Notes:
Absolute numbers are rounded to the nearest 50.
1 Rate calculated as total ILO unemployment divided by total of
economically active population aged 16 and over.
However, many businesses remain on edge. If the negotiations start badly then this could lead to a more serious loss in economic sentiment with implications for investment, spending and growth.
At the same time, we await how businesses will react in Scotland to the prospects of a 2nd
independence referendum.
The next 3 years – 2017, 2018 & 2019
Our central forecast is for growth to remain at around the same pace in 2017 as in 2016 – with growth of 1.2% (up on our December forecast of 1.1%).
We have broadly maintained our forecast of growth of 1.3% growth in 2018 but revised down slightly our outlook for 2019 to 1.4% (down from 1.6% in December). These revisions are driven, in part, by the new weaker projections for the UK economy which in turn spill-over into Scotland through the strong trade linkages.
Whilst positive, the outlook remains fragile and well below trend. The service sector will remain the dominant source of growth.
On the components of demand, we expect the heightened uncertainty to dampen investment this year. Some of this will reflect delayed plans as firms await the details of the Brexit negotiations. Once this is resolved, a pick-up is likely toward the end of the forecast period. As the greatest
component of GDP, consumption will remain the biggest contributor, although it will be lower than it otherwise would have been as higher inflation, combined with low earnings growth, feeds through to household spending.
Net exports will continue to benefit from the depreciation in Sterling as will tourism.
We expect unemployment to return toward a level consistent with medium-term trends (although still well below its long-term average). As we
highlighted above, recent unemployment numbers have been skewed by a sharp rise in inactivity. To the extent that this is reversed, Scotland’s
unemployment rate could rise much more sharply.
-0.4 0.0 0.4 0.8 1.2 1.6 2.0
2017 2018 2019
%
contribu
tion to GDP
grow
th
20
[image:20.595.49.293.558.744.2]Diagram 1: Independence macroeconomic issues
Table 13: The currency options £ Formal currency union
Informal currency union (Sterlingisation) Scottish £ Pegged to UK£ or basket of currencies
Floating
Euro Formal currency union
Source: FAI
Chart 37: Scotland’s North Sea Revenues
Source: Scottish Government, GERS, OBR and FAI calculations
Chart 38: Scotland’s estimated net borrowing
Source: Scottish Government, GERS
Policy Context
On 13th March, the First Minister announced plans to hold a second independence referendum. The UK Government has so far rejected the timing of any vote, but it seems increasingly likely that one will be held at some point.
It is clear that the economic arguments will – once again – dominate the debate.
The key issues are well known. In the coming months, the Scottish Government will need to set out a robust macroeconomic framework covering the key areas of: monetary policy & currency, financial regulation (including contingency for its banks) and fiscal policy (and crucially, the management of any borrowing and debt that Scotland would inherit).
We will return to each of these areas in greater depth in future work. We will shortly be providing details of a series of public events looking at the economic choices now facing Scotland.
Whilst the key issues are clear, the arguments this time are likely to be different.
Firstly, in 2014 there was a clear choice between a ‘status quo’ – albeit with more devolved powers – and independence. With Brexit, the debate will be set against the backdrop of two types of economic change.
Secondly, it is undoubtedly the case that the recent challenges in the North Sea poses a challenge to any transition to independence. For example, the sharp fall in oil prices has
significantly lowered North Sea tax revenues.
Forecasts are now in the order of hundreds of millions rather than billions of £’s. Given its maturity, the UKCS is unlikely to be a rich source of tax revenue in the years ahead. This has led to a weakening in Scotland’s estimated fiscal position – according to GERS – with the deficit in 2015-16 around 9.5%. Assuming similar levels of growth and current patterns of public spending, our own projections suggest that the deficit will remain in the 6% to 7% range by 2020.
Macroeconmic Framework
Monetary Policy & Currency
Financial
Regulation Fiscal Policy
0 2 4 6 8 10 12 14
£
b
ill
io
n
Scotland - geographical share Forecast
-12.0% -10.0% -8.0% -6.0% -4.0% -2.0% 0.0% 2.0% 4.0%
%
o
f
G
D
P
21
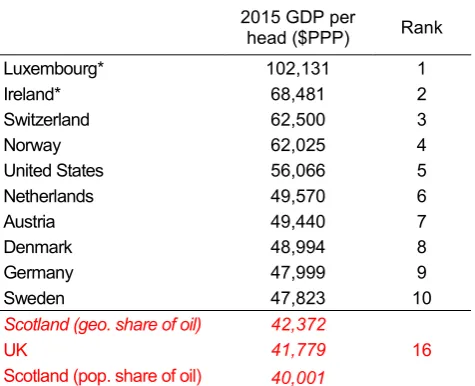
Table 14: Scotland’s GDP Per Capita
2015 GDP per
head ($PPP) Rank
Luxembourg* 102,131 1
Ireland* 68,481 2
Switzerland 62,500 3
Norway 62,025 4
United States 56,066 5
Netherlands 49,570 6
Austria 49,440 7
Denmark 48,994 8
Germany 47,999 9
Sweden 47,823 10
Scotland (geo. share of oil) 42,372
UK 41,779 16 Scotland (pop. share of oil) 40,001
Source: OECD, Scottish Government & FAI calculations
* Interpreting GDP per head figures is fraught with difficulty – particularly for countries such as Lux/Ire where statistics of what they produce differs from actual income.
Chart 39: Devolved tax powers – but are they enough?
Source: Scottish Government, GERS
Chart 40: Scottish export markets
Source: Scottish Government
GERS tells us little about the long-term public finances of an independent Scotland given that, by definition, it is based upon estimates of public spending and revenue in Scotland as part of the UK. That being said, the Scottish Government will be required to set out a clear plan for how it intends to manage the very challenging starting position set out in GERS.
Thirdly, many of those on the ‘yes’ side in 2014 argued that there would be a degree of continuity between the then status quo and independence; e.g. plans to keep sterling, existing financial regulations and for both to be members of the EU.
Now though, the Scottish Government’s case appears to be framed around Scotland pro-actively taking a different path to the UK (e.g. on EU). This being the case, it is possible that the economic proposition could be more radical on issues such as currency, financial regulation and fiscal policy.
The Scottish Government will undoubtedly make the case that Scotland is an advanced economy and comparable in size to other successful countries but that the levers of independence provide an opportunity to do things differently. The UK Government will counter that Scotland now has substantial economic powers, and gains from an established macroeconomic structure and the pooling of resources across the UK.
The trigger for the referendum was, in the First Minister’s view, the decision of the UK
Government to seek a so-called ‘hard’ Brexit.
Our own work has shown that EU membership is indeed very important for Scotland and Brexit will no doubt act as a key long-term headwind to growth prospects across the whole of the UK. As Chart 40 highlights however, Scotland’s trade with the rest of the UK is over four times larger than trade with the EU so a clear strategy for supporting trade with the UK will be crucial.
As highlighted above, even under favourable trade regimes, Scotland’s export performance has been unspectacular in recent years. Any change which makes trade more difficult will only make this worse.
Devolved Revenues 30%
Assigned Revenues 10% Reserved
Revenues 60%
0 10,000 20,000 30,000 40,000 50,000 60,000
2002 2003 2004 2005 2006 2007 2008 2009 2010 2011 2012 2013 2014 2015
£
m
ill
io
n
rUK Exports
22
Chart 41: Scotland and rUK’s population projections
Source: ONS
Chart 42: UK economic policy uncertainty based upon
newspaper articles of policy uncertainty
Source:www.policyuncertainty.com
Migration is also likely to feature in the debate. Historically population growth in Scotland has been far below that of the UK and other European countries with a similar population to Scotland.
As Chart 41 shows, even with current projections for migration, Scotland’s working age population is projected to decline over the next few decades. If a ‘hard Brexit’ was to limit the number of people coming to Scotland, the consequences for the economy and public services could be significant.
In 2014, the case was made for Scotland to remain in a formal currency union with the UK. Whether this is the best option in the long-run and whether or not the UK would agree to it, is open to debate.
That being said, the challenges with implementing a new currency – including any redenomination of contracts, investments and mortgages, the capitalisation of banks and managing any market volatility – should not be underestimated. All of which would also need to be set in the context of a stable and credible macroeconomic framework.
Whatever the views are over the long-term risks and opportunities from independence, it is clear that we are entering an unprecedented period of political and economic uncertainty. With an economy struggling with the effects of a low oil price, the uncertainty caused by ongoing Brexit negotiations and a second independence referendum is likely to act as a further headwind for many businesses and potential investors.
Just as it is the responsibility of the UK
Government to provide clarity through the Brexit process, it is incumbent on the Scottish
Government to do likewise around independence and to re-double their efforts to support the Scottish economy through these unprecedented times.
For regular analysis on the Scottish economy and public finances please see our blog:
www.fraserofallander.org
70%80% 90% 100% 110% 120% 130%
2014 2019 2024 2029 2034 2039 2044 2049 2054 2059 2064
Po
pu
la
tio
n
L
e
ve
l (2
0
1
4
=
1
0
0
%
)
Scotland total population RUK total population
Scotland 20-65 population RUK 20-65 population
0 200 400 600 800 1,000 1,200
2010 2011 2012 2013 2014 2015 2016 2017
Po
lic
y
U
nc
e
rt
a
in
ty
I
nd
e
x