City, University of London Institutional Repository
Citation
:
Jeanes, A., Coen, P. G., Wilson, A. P., Drey, N. and Gould, D. J. (2015). Collecting the data but missing the point: Validity of hand hygiene audit data. Journal of Hospital Infection, 90(2), pp. 156-162. doi: 10.1016/j.jhin.2015.02.018This is the accepted version of the paper.
This version of the publication may differ from the final published
version.
Permanent repository link:
http://openaccess.city.ac.uk/13831/Link to published version
:
http://dx.doi.org/10.1016/j.jhin.2015.02.018Copyright and reuse:
City Research Online aims to make research
outputs of City, University of London available to a wider audience.
Copyright and Moral Rights remain with the author(s) and/or copyright
holders. URLs from City Research Online may be freely distributed and
linked to.
1
Title: Collecting the data but missing the point:
validity of hand hygiene audit data.
Authors: A Jeanes
1, PG Coen, AP Wilson, N Drey , D Gould
1
Infection Control Department University College London Hospitals 3rd floor East 250 Euston Road London NW1 2PG
Tel: 0203 447 8974
2
Summary:
Background: Monitoring of hand hygiene compliance (HHC) by observation has been used in health care for more than a decade to provide assurance of infection control practice. The validity of this information is rarely tested.
Aim: To examine the process and validity of collecting and reporting HHC data based on direct observation of compliance.
Methods: We examined 5 years of HHC data routinely collected in one large NHS hospital Trust. We reviewed the data collection process by survey and interview of the auditors. We compared HHC data collected for other research purposes undertaken during this period to the organisational data set.
Findings:There was an increase in reported compliance during this period. Examination of the data collection process revealed changes including local interpretations of the data collection system which invalidated the results. A minority of auditors had received formal training in observation and feedback of results.
Conclusions: Unless data collection definitions and methods are unambiguous, carefully supervised and regularly monitored, variations may occur which affect the validity of the data. Whilst observation of HHC is the current gold standard, in the absence of a
standardised consistent methodology, by trained and supervised observers with intermittent validation it is not a robust approach to collecting accurate monitoring data. If the purpose of HHC monitoring is to improve practice then a focus on progressively improving performance rather than on achieving a target may offer greater practice improvement opportunities.
Key words: hand hygiene, direct observation, assurance, monitoring,
Background
Optimal hand hygiene practice is recognised as a key infection prevention and transmission intervention1. Hand hygiene compliance (HHC) in healthcare has traditionally been low2,3.
Observation, audit and feedback of performance combined with education and the
introduction of alcohol hand rub have been successfully used to increase compliance1,4,5,6,7 although improvement was not always sustained8.
3 assurance of HHC. The expectation is that compliance is high and 100% compliance is a common aspiration.
There are recognised limitations associated with measuring observed behaviour including the Hawthorne effect13 , observer bias14 and observer drift15. Such limitations may have a
significant effect on the accuracy of the data collected and reported particularly if observers are not trained and monitored16.
This paper examines the validity of the HHC data and the data collection method in one healthcare organisation over five years. Validity is generally divided into the terms internal and external validity. Internal validity refers to the ability of the test to accurately measure what is required avoiding bias or error. Bias can be divided into three categories:
Selection e.g. what group was selected for measurement
Information e.g. consistency of data gathering methods
Confounding e.g. the measurement of a confounding factor
External validity relates to the generalisability or extrapolation of results17.
Introduction
In 2004 alcoholic hand decontamination was introduced to an acute hospital with >900 beds which had increased to >1000 beds by 2012. In 2005 the mean HHC of the organisation was <20%. In 2008 the organisation-wide hand hygiene compliance monitoring process
commenced. In the next three years >4000 staff were trained in hand hygiene practice and hand washing facilities were improved. At the end of 2008 the mean HHC for the
organisation had increased to 78% (9,328 hand washing events for 11,954 hand cleansing opportunities) with some diversity in specialities. By this time >100 staff (predominantly nurses) from 51 wards and departments were trained to undertake direct observation of HHC and provide feedback of performance to staff. The compliance tool used throughout the organization was adapted from the Lewisham tool18 and incorporated the WHO 5 moments of hand hygiene19. The organisation set an improvement target of 85% rising by 5% annually until 100% was achieved. The hand hygiene policy was revised to clarify expectations and consequences of non-compliance which included disciplinary action.
By 2012 the number of wards and departments submitting monthly HHC data rose to a maximum of 98 which included all eligible areas, and the number of yearly hand cleansing opportunities had more than trebled to 42,143. The results were reported, with other organisational performance metrics, in a departmental score card and reviewed monthly by the executive board. Wards and departments were encouraged to display the latest
performance data locally on infection control notice boards situated in public areas.
4 at times at odds with observed practice, feedback from service users and random checks. This prompted an examination of the methodology and validity of the data collection process.
Methods
A number of methods were used to obtain a more comprehensive picture of the data collection process.
Standard routine organization-wide HHC data collection process - Most wards submit their
monthly report and reminders are sent towards the end of each month. We manually check for anomalies, process the results and store them in a secure database by means of a computer programme; these data are subsequently used to calculate ward, divisional and board level hand hygiene compliance statistics. The monthly reports compliance is calculated as HHC = HHE / HHO x 100 where HHE are the number of hand hygiene events observed and HHO are the number of hand hygiene opportunities during three 20-minutes sequential periods in one ward or department.
Additional hand hygiene compliance data – these data were collected for research purposes in
the organisation during the same time period and were compared to the routine data set20 and another unpublished study by the same group..
Staff survey and interviews - We used an online structured questionnaire tool (‘Survey
monkey’) to assess the level of training, knowledge and the learning needs of the staff monitoring hand hygiene compliance; six months later we used a questionnaire based interview to improve the response rate and obtain a more comprehensive picture. This
included additional questions about actions taken if scores were high or low and perception of value and satisfaction with the process.
Product usage –On examination of the purchasing data for the preceding 5 years we found
that this related to where the product was delivered to rather than where it was used. It was concluded that this was of little value in determining ward based usage and was not examined further.
Data analysis – All statistical analyses were carried out in STATA 12.0. We used
hand-hygiene compliance data collected between 2008 and 2012. As % compliance and the number of hand hygiene opportunities are not necessarily normally distributed statistics we used medians and interquartile ranges for descriptions of the distribution of % compliance. To test the significance in the difference between samples of hand hygiene compliance estimates we used non-parametric statistics and tests because of the non-normal nature of HHCs and the relatively low sample sizes, such as medians and the two-sample Wilcoxon rank-sum (Mann-Whitney) test. P-values less than 0.05 were considered statistically significant.
5
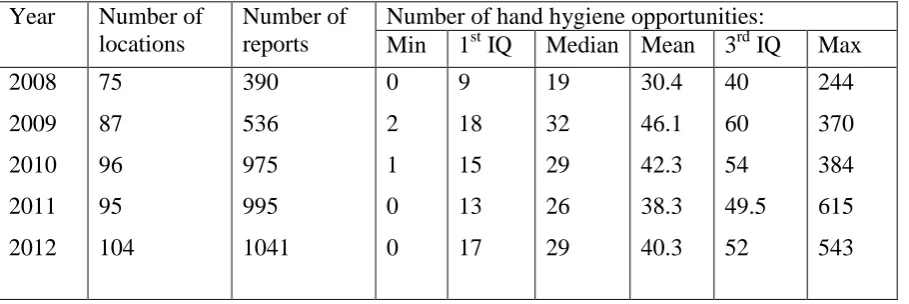
The number of hand hygiene opportunities - The reported number of hand hygiene
opportunities peaked in 2009 and remained high over the remaining period (Table I),
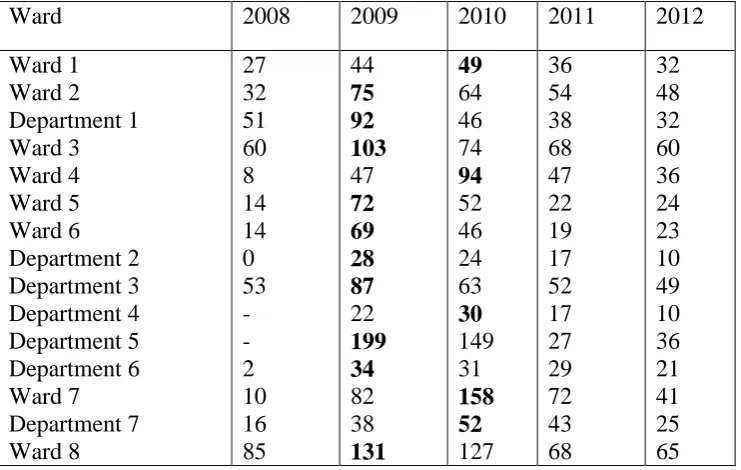
although this number varied widely between reporting locations, some of which reported zero opportunities (making it impossible to assess hand hygiene compliance), others reported as many as 615 opportunities (equivalent to one opportunity observed every three seconds). Some locations showed significant declines in the average number of observed hand hygiene opportunities (Table II). The Neonatal Unit observed the opposite trend, rising from an average of 32 opportunities in 2008 to 241 in 2011. This directly related to the employment of an embedded infection control nurse who undertook regular comprehensive monitoring.
Hand hygiene compliance - Between 2008 and 2012 hand hygiene compliance increased
from 78% to 95% (Figure 1). Table III shows the degree of heterogeneity between wards and departments. 63% of all submitted reports declared hand hygiene compliance below 85% in 2008 and by 2012 this percentage had fallen to 11%.
Frequent changes in configuration and location of services, made the interpretation of differences in compliance scores in wards and departments difficult. Many data sets were incomplete or not directly comparable as wards had moved, closed, opened and split.
A small number of departments had modified the data collection methodology with the Infection Control team, e.g. theatres and emergency department; as the observation
monitoring tool of the organisation did not reflect the context or activity in the area. Some areas had independently changed the methodology and format of data collection. Other wards with low scores were not reporting the data. Administrators reported that some areas
repeatedly submitted the previous month’s data.
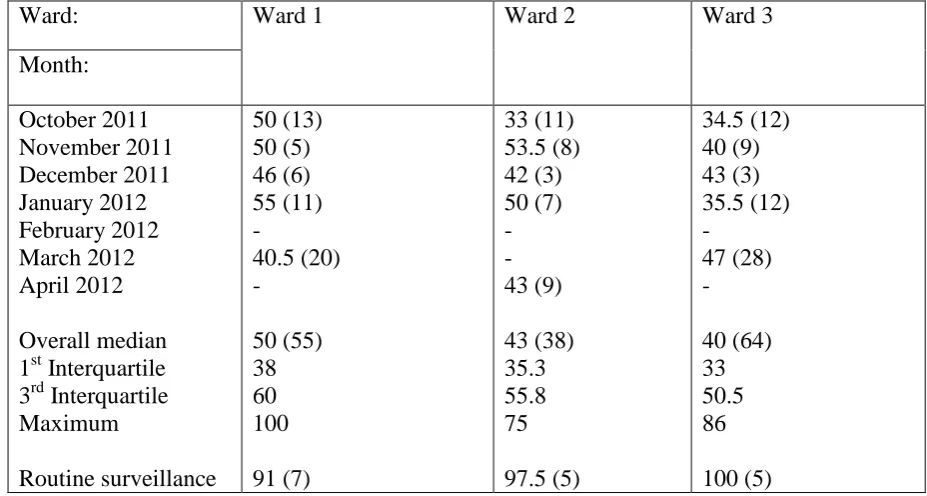
Additional compliance results. One research project20 that took place between October 2011
and April 2012 carried out 157 independent estimates of hand-hygiene compliance from three separate wards (Table IV). The median% compliance is always much lower than that from routine monitoring: 50% vs 91% (ward 1; p=0.0135), 43% vs 97.5 (ward 2; p=0.0045) and 40% vs 100% (ward 3; p=0.0053). The extent of the bias is evident when considering that the 3rd inter-quartiles from the research project were always much smaller than any reported by routine surveillance over the same time period. Another unpublished independent study carried out in 2009 on a single ward showed 30.7% compliance (HHE = 113, HHO = 368) on ward bays and 48.1.% compliance in isolation rooms (HHE = 25, HHO = 52), both much smaller than the median of 82.7 from the 8 routine monitoring reports received in the same year (Interquartile range: 80.5, 84.8).
Staff survey - A short online survey of the learning needs of hand hygiene auditors was
6 of observation varied widely between 10 to > 60 minutes. Several auditors collected data for more than one area. Additional feedback included a number of criticisms and comments including:
‘cumbersome and time consuming’ process
the tool was ‘useless in identifying what is needed to improve practice’
‘no more than a tick box exercise as obtaining a low score is unacceptable’
Interviews-– We interviewed 52 hand hygiene observers from 61 of 104 clinical areas where reporting was routinely undertaken. One person undertook all interviews. Interviewees were predominantly nurses but included nursing assistants, dental nurses, physiotherapists and housekeepers.
Training: - only 22 (42%) had received the formal training in observation and feedback of results provided by the infection control team and 3 (6%) had received an update on their training; other responses included ‘I can’t remember’, ‘I learnt from the form’, ‘self taught’ and ‘Someone on the ward showed me for 20 minutes’.
Time taken to undertake monitoring: - 35 (67%) were allocated no time to collect the data and did it in their breaks or when there was a quiet period; the time spent by staff doing the monitoring ranged from 20 minutes to 7.5 hours a month; some undertook individual approaches such as ‘I do it all the time rather than for periods of time’ and ‘3-5 minutes per
patient - longer if in a quiet period’; the frequency of observation also varied ranging from
daily to monthly.
Changes to the data collection methodology:- the organisation had removed low risk scores from the target within the first year of auditing; this led to staff not collecting or reporting this data in some areas whilst in other areas they continued to collect but not report it: only 13 (25%) were aware of any changes in the audit and 21 (41%) routinely varied the period of observation; comments included: ‘it changes from week to week’ and ‘it depends how busy
the ward is’.
What happens if score is very low or very high: - 13 (25%) redid the audit until a high score was obtained; comments included ‘if it’s >85% report it as it is, if it’s <80% I redo it and
remind staff’ and ‘Low score - disregard and redo another time’.
Additional findings: -the majority of auditors were nurses including ward sisters; on the basis of 60 minutes observation per month, 30 minutes data input and feedback this was calculated to cost more than £28,800.00 per annum for the organisation
Discussion
Despite widespread use of hand hygiene monitoring by observations this is one of the first studies to explore how well it is undertaken although this is only in one organisation. The data collection process had changed with time. The data collected and reported varied
7 is a recognised phenomenon15. In this instance it was probably due to insufficient training, supervision and inadequate validation of the data collection process.
Staff spent less time collecting data than was initially envisaged and conducted it at times when the ward or department was not busy. This was influenced by the lack of time allotted and a lack of recognition of the requirement to collect a representative, comparable and consistent data set.
The tool and method was more than six years old and had not been revised. It did not reflect changes and constraints such as dependency, case mix, workflow and workload. Some areas had already opted out of the system and either used a tailored tool focused on continuous quality improvement or something they had developed themselves. Whilst standardisation of the data collection system makes analysis and comparison easier, variations will emerge and this may be useful in reflecting local risks and requirements.
There was evidence of not reporting and repeating low score audits although this was not widespread. It was easier to report a high score than a low score as a low score required action to improve. ‘Observer bias’ has been described previously in which researchers were influenced to produce positive results14.
Some of the staff interviewed collected the data but anticipated no change in practice. The purpose of data collection became a process of providing assurance that targets were
achieved rather than one of continuously identifying where practice improvements could be made. The assumption that data collection provides a ‘dial’ rather than a ‘tin opener’ which could reveal a can of worms, is a recognised phenomenon in measures of organisation performance22.
The omission in compliance reports of hand hygiene opportunities which were perceived to be low risk, recording observations at quiet times and repeating audits which gave a low score, produced an incomplete and inaccurate picture of practice. Although considerable reliance was placed on these data within the organisation, it engendered overestimates of compliance. This is therefore false assurance and it is not a useful comparator.
8 Hand hygiene compliance data can be collected in other ways including product usage and automation although this can be expensive and has limitations16. A benefit of direct
observation is that it produces a change in behaviour24 and an opportunity to observe other practice or standards. The effect on behaviour is also problematic as the behaviour observed may not be representative. Much of this reporting was also in effect self reporting by staff with an alliance to the area. Both self reporting and an alliance affect the objectivity and may effect results25, 26.
The role of training and supervision in managing ambiguity and achieving a consistent standard of monitoring and data collection is important but time to undertake the work and training is also required.
The internal validity of the data collected and examined in this study was poor. The effect of observation on hand hygiene compliance is already known to affect the results obtained. The lack of consistency in the methodology used and lack of training or standardisation of auditors are threats to the validity of the data collected. There was also considerable risk of bias in the selection of what and who is observed, particularly as it is self reporting by an interested party. The data is not representative of all activity as it is undertaken in the day time and often at quiet periods. In addition there was some instrumental bias as with time observational methods and practice changed.
Whilst observation of HHC is the current gold standard, in the absence of a standardised consistent methodology, by trained, supervised observers and intermittent validation, it is not a robust approach to collecting accurate monitoring data. However if the purpose of HHC is to improve practice rather than to meet a target, a focus on improvement offers opportunities to examine in detail the barriers and opportunities to increase hand hygiene compliance rather than focus on non compliance. This would also facilitate an adaptable system which reflects local risks and requirements. As a result of this work this approach was subsequently
developed.
This work was based on a small sample confined to one organisation. This may not be representative or generalizable. It would be useful to repeat this exercise in other organisations to compare results.
Conflict of interest statement: none
Funding source: none
Acknowledgements
9
References
1. Pittet D, Hugonnet S, Harbarth S, Mourouga P, Sauvan V, Touveneau S et al.
Effectiveness of a hospital-wide programme to improve compliance with hand hygiene.
Infection Control Programme. Lancet. 2000;356:1307-12. Erratum in: Lancet 2000;356:2196.
2. Albert RK, Condie F. Hand-washing patterns in medical intensive-care units. N Engl J Med 1981; 304:1465-1466.
3. Tibballs J. Teaching hospital medical staff to handwash. Med J Austral. 1996;164:395– 398.
4. Hugonnet S, Perneger TV, Pittet D. Alcohol-based handrub improves compliance with hand hygiene in intensive care units. Arch Intern Med. 2002;162:1037-43.
5. Lam BC, Lee J, Lau YL. Hand hygiene practices in a neonatal intensive care
unit: a multimodal intervention and impact on nosocomial infection. Pediatrics 2004;114: e565 -e571 doi: 10.1542/peds.2004-1107
6. Cromer AL, Latham SC, Bryant KG, Hutsell S, Gansauer L, Bendyk HA, et al. Monitoring and feedback of hand hygiene compliance and the impact on
facility-acquired methicillin-resistant Staphylococcus aureus. Am J Infect
Control. 2008;36:672-7.
7. Aboumatar H, Ristaino P, Davis RO, Thompson CB, Maragakis L, Cosgrove S, et al. Infection prevention promotion program based on the
PRECEDE model: improving hand hygiene behaviors among healthcare personnel.
Infect Control Hosp Epidemiol. 2012; 33:144-51.
8. Gould, D. J, Moralejo, D, Drey, N. Chudleigh, J. H. (2011). Interventions to improve hand hygiene compliance in patient care. Cochrane Database of Systematic Reviews(8), doi: 10.1002/14651858.CD005186.pub3
9. World Health Organization. WHO guidelines for hand hygiene in health care. 2009 World Health Organization; Geneva, Switzerland
10. Boyce JM, Pittet D. Guideline for hand hygiene in health-care settings Recommendations of the Healthcare Infection Control Practices Advisory Committee and the
HICPAC/SHEA/APIC/IDSA Hand Hygiene Task Force. Society for Healthcare
Epidemiology of America/Association for Professionals in Infection Control/Infectious Diseases Society of America. MMWR Morb MortalWkly Rep 2002;51:1-45.
11.National Institute for Health and Clinical Excellence Prevention and control of healthcare-associated infections NICE public health guidance PH36: November 2011
10 13. Eckmanns T, Bessert J, Behnke M, Gastmeier P, Ruden H. Compliance with
antiseptic hand rub use in intensive care units: the Hawthorne effect. Infect
Control Hosp Epidemiol. 2006;27:931-4.
14. O’Leary KD, Kent RN, Kanowitz J Shaping data collection congruent with experimental hypotheses J Appl Behav Anal. 1975; 8: 43–51.
15. G. A. Smith Observer drift: A drifting definition Behav Anal. 1986; 9:127–128.
16. Gould DJ. Drey N. S, Creedon S. Routine hand hygiene audit by direct observation: has nemesis arrived? J Hosp Infect. 2011;77: 290-293.
17. Grimes DA, Schulz KF. Bias and causal associations in observational research. Lancet
2002;359: 248-52
18. Rao G, Jeanes A, Osman M, Aylott C, Green J. Marketing hand hygiene in hospitals – a case study. J Hosp Infect 2002;50:42-47
19.Sax H, Allegranzi B, Uçkay I, Larson E, Boyce J, Pittet D.'My five moments for hand hygiene': a user-centred design approach to understand, train, monitor and report hand hygiene. J Hosp Infect. 2007;67:9-21.
20. FitzGerald G, Moore G, Wilson AP. Hand hygiene after touching a patient's surroundings: the opportunities most commonly missed. J Hosp Infect. 2013;84:27-31.
21. Dixon-Woods M, Leslie M, Bion J, Tarrant C. What counts? An ethnographic study of infection data reported to a patient safety program. Milbank Q. 2012;90:548-91.
22.Carter N. Klein R. Day P. How Organisations Measure Success: The Use of Performance
Indicators in Government Routledge, London;1992
23. Porter M E What is the value in healthcare? N Engl Med 2010;363:2477-2481
24. Roethlisberger F.J. Dickson W.J. Management and the worker, Harvard University Press, Cambridge;1939.
25. Dhar S, Tansek R, Toftey EA, Dziekan BA, Chevalier TC, Bohlinger CG, et al. Observer bias in hand hygiene compliance reporting. Infect Control Hosp Epidemiol. 2010;31:869-70.
26. O'Boyle CA, Henly SJ, Larson E. Understanding adherence to hand hygiene
12
TABLE I. Average number of hand hygiene opportunities reported in the monthly reports. IQ = interquartile.
Year Number of locations
Number of reports
Number of hand hygiene opportunities:
Min 1st IQ Median Mean 3rd IQ Max 2008
2009
2010
2011
2012
75
87
96
95
104
390
536
975
995
1041
0
2
1
0
0
9
18
15
13
17
19
32
29
26
29
30.4
46.1
42.3
38.3
40.3 40
60
54
49.5
52
244
370
384
615
13
TABLE II. Wards and departments with a declining trend in the average number of hand hygiene opportunities (the peak figure is marked in bold).
Ward 2008 2009 2010 2011 2012
14 Table III. Hand hygiene compliance (%) reported in the monthly reports. IQ = interquartile. See text for more detail. *2013 relies on data collected in the first 6 months of the year only. The last three columns show the percentage of reports declaring <85%, 90% and 95% hand hygiene compliance respectively.
Year Min 1st IQ Median Mean 3rd IQ Max % <85 % <90 % <95
2008 2009 2010 2011 2012 2013* 0 20 0 23 30 42 63 80 87 91 92 92 79 89 93 96 96 97 74 86 90 94 94 95 90 94 97 100 100 100 100 100 100 100 100 100 63 35 21 10 11 10 75 53 35 19 19 15 87 77 65 45 41 37
Table IV. Median hand hygiene compliance measured independently of the routine surveillance, from three ward locations. Numbers in round brackets are sample sizes.
Ward: Ward 1 Ward 2 Ward 3
[image:15.595.77.541.370.618.2]15
FIGURE 1 LEGEND
16
FIGURE 1
30 40 50 60 70 80 90 100
2008 2009 2010 2011 2012 2013
Year