1 INTRODUCTION
Recent research shows that competition in maritime market develops more compound and pretentious structure affected by parameters as time, economical restraints, technology and innovation, quality, relia-bility and information management. In relation to successful business competence, strategic planning should be enhanced considering assets availability, involving maintenance and reliability operational as-pects. The latest technology controlling these param-eters is focused on monitoring the condition of main and auxiliary machinery.
The INCASS (Inspection Capabilities for En-hanced Ship Safety) FP7 EU funded research project aims to tackle the issue of ship inspection, identifica-tion of high-risk ships, providing access to infor-mation related to ship surveys and incorporate en-hanced and harmonized cooperation of maritime stakeholders in order to avoid ship accidents, promote maritime safety and protect the environment.
This paper aims to present the development of a Machinery Risk and Reliability Assessment (MRA) methodology for ship machinery and equipment as well as the MRA Decision Support System (DSS). The innovation of MRA methodology is oriented to-wards the components’ failure and state interdepend-encies providing a holistic view of systems’ reliabil-ity performance. Furthermore, MRA takes into account the system’s dynamic state change, involving failure rate variation within time. In order to approach and simulate realistically this dynamic condition monitoring control, a continuous dynamic monitoring model is introduced. The presented methodology in-volves the generation of Markov Chain arrangement integrated with the advantages of Bayesian Belief Networks (BBNs).
All progress and methodology development takes place using Object Oriented Programming (OOP) en-vironment in Java language. Additionally, the MRA DSS tool is developed and introduced. This tool uti-lizes the MRA results by integrating historical data and expert judgment in order to assist the ship ma-chinery inspection and maintenance. Moreover, user-friendly Graphical User Interface (GUI) is developed by involving useful DSS aspects for onboard risk and reliability control. Lastly, INCASS project developed a measurement campaign, where real time sensor data is recorded onboard a tanker, bulk carrier and con-tainer ship. The gathered data will be utilized for MRA DSS tool validation. The entire MRA DSS tool is demonstrated in this paper through a case study by employing currently simulated input data. Future re-search steps include the MRA DSS validation using real-time recorded data and the components’ influ-ence interdependencies.
Hence, this paper is structured in 4 sections. First of all, Section 1 introduces the paper’s scope and mo-tivation of research. Section 2 refers to the research background which involves the exploration of Condi-tion Based Maintenance (CBM) methodology and well known Condition Monitoring (CM) technologies and tools. In Section 3 the suggested Machinery Risk Analysis (MRA) methodology is presented by demonstrating a case study, the MRA DSS and the performed results. Section 4 concludes with the dis-cussions and future work for the MRA development.
2 RESEARCH BACKGROUND
This section demonstrates the latest research back-ground with regards to maintenance control and Con-dition Based Maintenance (CBM) methodology.
Dynamic risk and reliability assessment for ship machinery decision
making
K. Dikis, I. Lazakis, A.L. Michala, Y. Raptodimos & G. Theotokatos
University of Strathclyde, Glasgow, Scotland, United Kingdom
Moreover, this section presents the most-known fail-ure and risk analysis methods and the latest Condition Monitoring (CM) technologies and the tools.
2.1 Condition Based Maintenance (CBM)
From operational viewpoint, maintenance is restruc-tured from reactive to proactive actions, involving more control and information of the considered ma-chinery or system (Dikis et al., 2015b). In this respect, maintenance methodologies can be identified as poli-cies indicating the entire business’s profile. These methodologies set the corporate orientation with re-spect to the applied maintenance strategy and opera-tions. Different methodologies are introduced in the literature (Mobley et al., 2008). Research presents in-tegration of methodologies and policies, allowing the utilization of flexible frameworks. CBM is the latest and under continuous development methodology. The scope of CBM is to detect the upcoming failures before even taking place, aiming to enhance ma-chine’s availability, reliability, efficiency and safety, by reducing maintenance costs through controlled spare part inventories (Mechefske, 2005). On the in-dustrial aspect, SKF (2012) states that CBM aims at understanding of risks and predetermination of strate-gic actions, leading to reliability and operational cost reduction.
2.2 Failure and risk analysis methods
Deteriorating systems developed for the maritime in-dustry consider internal and external to system fail-ures as interdependencies occur during operation (Delia and Rafael, 2008). Literature presents various failure and risk analysis methods, where the majority of approaches visualize failure occurrence as inde-pendent event for each considered component of a system. These can be summarized as Fault Tree Anal-ysis (FTA), Dynamic FTA (DFTA) taking into ac-count time variation, Failure Mode and Effect Analy-sis (FMEA) and Failure Mode Effect and Criticality Analysis (FMECA), Markov Analysis (MA) and Bayes’ Theorem presenting the Bayesian Belief Net-works (BBNs).
On the other hand, Lazakis et al. (2010) present a pre-dictive maintenance strategy utilizing Failure Modes, Effects and Criticality Analysis (FMECA) and Fault Tree Analysis (FTA). The model upgrades the exist-ing ship maintenance regime to an overall strategy in-cluding technological advances and Decision Support System (DSS) by combining existing ship operational and maintenance tasks with the advances stemming from new applied techniques. On the other hand, Lazakis and Olcer (2015) introduce a novel Reliabil-ity and CriticalReliabil-ity Based Maintenance (RCBM) strat-egy by utilizing a fuzzy multiple attributive group de-cision-making technique, which is further enhanced with the employment of Analytical Hierarchy Process
(AHP). The outcome of this study indicates that pre-ventive maintenance is still the preferred maintenance approach by ship operators, closely followed by pre-dictive maintenance; hence, avoiding the ship correc-tive maintenance framework and increasing overall ship reliability and availability. An innovative ship maintenance strategy is presented by Turan et al. (2011) based on criticality and reliability assessment while utilizing the FTA tool with time-dependent dy-namic gates so as to represent in an accurate and com-prehensive way the interrelation of the components of a system. As part of the reliability assessment, the Birnbaum and Criticality reliability importance measures are utilized to validate the results of the analysis, whereas a case study of a diving support vessel (DSV) illustrates the application of this strat-egy. In order to layout CBM and the processes that consists of; Tsang et al. (2006) suggest a data struc-ture leading to decision analysis according to machin-ery’s condition, proposing a method for data-driven CBM.
2.3 Condition Monitoring (CM) technologies
CM technology is applied through various tools. These tools record and evaluate measurable parame-ters that will be reviewed in this section such as vi-bration monitoring, acoustic and ultrasonic monitor-ing, thermography and oil analysis. CM is identified in phases between data acquisition, signal pre-pro-cessing and feature extraction, signal analysis and fault detection, leading to decision-making and fail-ure prognostics (Delvecchio, 2012). This section is focused on the first phase of data acquisition. This phase involves the input data record such as displace-ment, velocity, acceleration, temperature, sound sig-nal and oil asig-nalysis parameters.
2.4 Risk and reliability analysis methods
Risk and reliability analysis methods assess various failure case scenarios of deteriorating systems and their contributing subsystems and components. Liter-ature presents various failure and risk analysis meth-ods, where the majority of approaches visualize fail-ure occurrence as independent event for each considered component of a system. The analysis tools examine risk of failure by taking into account quanti-tative and qualiquanti-tative aspects. These tools can be sum-marized as Event Tree Analysis (ETA), Fault Tree Analysis (FTA), Dynamic FTA (DFTA) taking into account time dependence, Failure Mode and Effect Analysis (FMEA) and Failure Mode Effect and Crit-icality Analysis (FMECA), Markov Analysis (MA) and Bayes’ Theorem presenting the Bayesian Belief Networks (BBNs). The latter one examines the relia-bility performance on system, subsystem and compo-nents levels by considering functional interdependen-cies among them. This key feature of BBN is significant and innovative, compared to the remaining methods, as it allows the simulation of functions and operations on actual modelling environment. The BBN is defined as probabilistic graphical model in-volving conditional dependencies arranged into Di-rected Acyclic Graphs (DAG) and it is expressed as presented in Equation 1 (Dikis et al., 2014).
𝑃(𝐴|𝐵) =𝑃(𝐵|𝐴) ∗ 𝑃(𝐴)
𝑃(𝐵) (1)
Where P(A) and P(B) are the probabilities of events A and B, while A given B and B given A are condi-tional probabilities (* stands for multiplication). Fur-thermore, innovative features of BBNs involve the utilization of decision making and cost functions.
3 SUGGESTED MRA METHODOLOGY
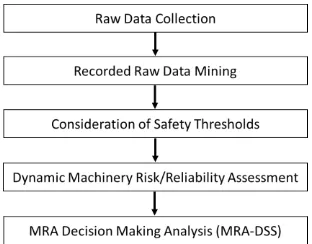
[image:3.595.357.513.32.154.2]In this section, the MRA methodology is demon-strated targeting to be applied on critical ship machin-ery and equipment of three different ship types such as tanker, bulk carrier and container ship (INCASS, 2014a). Hence, the MRA methodology is flexible in order to fulfil all requirements and specifications for each of these three ship types (INCASS, 2014b). Mo-tivation is based on the fact that researchers’ and mar-ket’s tendency involves the holistic consideration of operational and failure interdependencies among multiple components within the same or different sys-tem. The MRA input data flow consists of three stages, the data acquisition and processing, the risk and reliability assessment model and the Decision Support System (DSS).
Figure 1. MRA and MRA DSS process flow.
All processing, MRA functions and DSS features are developed in Java Object Oriented Programming (OOP) language. Java is chosen as it is cross platform and allows ease of use and compatibility among dif-ferent Operating Systems (OS). Figure 1 demon-strates the Machinery Risk/Reliability Analysis (MRA) methodology with respect to the process flow. On the first stage, the data acquisition and processing is considered by involving the raw data collection, mining and the safety thresholds. The input data is classified into the database on system, subsystem and component levels. The input data types are consid-ered as historical, expert and real time monitoring data (sensor raw input). Historical input data involves past failures and records. On the other hand, expert input/judgement takes into account comments, re-ports and knowledge from ship crew. Real time sen-sor input consists of raw (unprocessed) physical measurements such as temperature and pressure. All gained information is stored in a database and trans-mitted in the various methodology stages utilizing ‘text’ (.txt) files. This format file is selected as files are small in size and can be easily and inexpensively transferred from the onboard to the onshore environ-ment (INCASS, 2015).
of the data clustering analysis with the identification of the safety thresholds introduces the probability of occurrence the observed (recorded) input data to per-form within the acceptable functional levels. This probabilistic measure in percentage generates the in-put for the following risk and reliability tool.
The data clustering approach of k-means aims to partition the n observations into k(≤n) sets S = {S1, S2,
…, Sk} so as to minimize the Within-Cluster Sum of Squares (WCSS) (sum of distance functions of each point in the cluster to the K center). A recorded da-taset (raw data collection) (x1, x2, …, xn) is observed, where each observation is a d-dimensional real vec-tor. Hence, k-means data clustering model scope is to find (Theodoridis, 2015):
argmin
𝐒 ∑ ∑‖𝑥 − 𝜇𝜄‖ 2
𝑥𝜖𝑆𝑖
𝑘
𝑖=1
(2) where μi is the mean of points in Sias shown in Equa-tion 2.
K-means data clustering approach is selected as it is suitable for large number of variables. K-means is one of the simplest algorithms which uses unsuper-vised learning method to solve known clustering is-sues. Moreover, k-means can be computationally faster than hierarchical clustering methods. On the other hand, k-means can produce tighter clusters than hierarchical clustering. Additionally, k-means ena-bles high flexibility in data analysis as it becomes a great solution for pre-clustering, reducing the space of each cluster and allowing the integration with other algorithms for further processing.
In the second stage ‘Reliability Model’, the pro-cessed reliability input data is introduced. The risk and reliability model employs a network arrangement similar to the Bayesian Belief Networks (BBNs). This selection allows the probabilistic modelling by con-sidering functional relations and system, subsystem and component interdependencies. In the case of dy-namic modelling, the time dependencies and state di-vision of the reliability input are developed in parallel with the network model. The MRA application em-ploys the mathematical tool of Markov Chains (MC) (Fort et al., 2015). MC is mathematical system that undergoes transitions from one state to another on a state space.
Furthermore, MC is selected as it is flexible to set up by allowing different levels of state sequence com-plexity. In order to understand the dynamic probabil-istic modelling, a schematic diagram is presented in Fort et al. (2015). The presented subsystem sample includes in total three states within the timeline. Firstly, historical processed data from the previous time slice are provided shown as t-1. The current state (t) is calculated, whereas the predictive state is shown as future state t+1. As it can be seen in Figure 2 each time slice (t-1, t, t+1) is based on the previous state. This single state transition from past to present and
then to forecasted future is known as Markov Chain (MC). The generic probabilistic expression is shown in Equation 3. On the other hand, Equation 4 presents the PoW per expressed component/subsystem in the future t+1 time slice. Where, P(wt+1) denotes the PoW in future state (t+1) by taking into account pre-vious working and failing states P(wt) and P(ft) re-spectively.
Figure 2. Dynamic probabilistic network arrangement.
𝑃𝑋(𝑛−1),𝑋(𝑛) = 𝑃{𝑋𝑡𝑛 = 𝑋𝑛|𝑋𝑡𝑛−1 = 𝑋𝑛−1} (3)
𝑃(𝑤𝑡+1) = 𝑃(𝑤|𝑤𝑡)𝑃(𝑤𝑡) + 𝑃(𝑤|𝑓𝑡)𝑃(𝑓𝑡) (4) While, each component of a sub-system is linked with a certain number of failure modes that varies between components, a generic form expressing the failure case scenarios is presented in Equation 7. In this ex-pression, P denotes the Probability of Survival (PoS) for different failure scenarios, where w shows the PoW state while f shows the PoF. The relation of w
and f is shown in in Equation 8. Whereas, ftfn indi-cates the failure mode (i.e. noise, vibration, overheat-ing etc.).
Specifically, P1 denotes the PoW and PoF states while one failure mode takes place (ftf1) (Equation 4). Accordingly, P2 denotes the PoW state for a different failure mode (ftf2) (Equation 5). Whereas, P3 repre-sents the PoW and PoF states while ftf1 and ftf2 take place at the same time (Equation 6).
𝑃1 = {
𝑤: 100 − 𝑓𝑡𝑓1 𝑓: 𝑓𝑡𝑓1;
(5)
𝑃2 = {𝑓: 𝑓𝑡𝑤: 100 − 𝑓𝑡𝑓2
𝑓2;
(6)
𝑃3 = {𝑓: (𝑓𝑡𝑤: 100 − (𝑓𝑡𝑓1∗ 𝑓𝑡𝑓2)
𝑓1∗ 𝑓𝑡𝑓2);
(7)
𝑃𝑚 = (𝑓𝑡𝑓1∗ 𝑓𝑡𝑓2∗ 𝑓𝑡𝑓3∗ … ∗ 𝑓𝑡𝑓𝑘) (8)
𝑓 = 100 − 𝑤 (9)
𝑃(𝑐𝑜𝑚𝑝) = ∑(∑ 𝑃(𝑓𝑡𝑓(𝑖) , 𝑓𝑡𝑓(𝑗))) 𝑘
𝑖=1 𝑚
𝑗=1
(10)
𝑚 = 2𝑘 (11)
The third stage of the MRA tool implements the De-cision Support System (DSS) aspects. The MRA DSS methodology is divided into two sections. The first one utilizes local (onboard) and short term decision making suggestions, whereas the second one is used onshore (global) for longer term predictions and de-cision features. The MRA DSS demonstrates the con-sidered systems, subsystems and components into a tree structure form. The operator has the option of choosing each of these and getting information re-lated to past, current and predicted reliability perfor-mance. This research paper is focused on the Machin-ery Risk and Reliability Assessment (MRA) tool. Hence, the introduced application, in the following section, performs utilizing the MRA methods and the risk and reliability aspects.
3.1 MRA case study
In this section, a Machinery Risk/Reliability Analysis (MRA) case study is presented by involving the ship Main Engine (M/E), two subsystems and multiple components. The case study assesses the working state reliability performance on subsystem and com-ponent levels by analyzing various probable failure case scenarios. The case study employs simulated in-put data that are generated utilizing normal distribu-tion (Gaussian). The safety thresholds (i.e. safety in-dices) are identified through the engine’s manufacturer’s manual and the engine’s sea trials. These safety indices are selected as they fulfil the manufacturer’s requirements and sea trials provide the ideal available reference point for further compar-ison.
The model’s arrangement considers the ship Main Engine (M/E), the cylinder assembly and starting air subsystems. In the case of the first subsystem four components are involved such as the crosshead bear-ing, piston lube oil, piston liner and cylinder safety valve, whereas in the case of the starting air subsys-tem the cylinders’ starting air valves, scavenging air receiver and scavenger air distributor are taken into account. Most of these components, where applica-ble, are analyzed with respect to 6 items per compo-nent as the engine’s manual used is from a six-cylin-der marine diesel engine. Table 1 demonstrates the raw input data requirements that MRA methodology is tested.
Table 1. Raw input data requirements.
System Component Measurement Unit
Cylinder
Assembly Crosshead Bearing Temperature °C
Piston Lube Oil Temperature °C
Piston Liner Pressure bar
Cylinder Safety
Valve Pressure bar
Start Air Start Air Distributor Temperature °C
Start Air Receiver Pressure bar
Start Air Valves Pressure bar
Figure 3 demonstrates the Main Engine (M/E) MRA network case study. This network consists of cross-head bearings, piston lube oil measures (one per cyl-inder), cylinder liners and safety valves, cylinder starting air valves, scavenger air receiver and scaven-ger air distributor. There are two modelling ap-proaches to structure this network. The first approach links the involved components directly to the cylinder assembly and starting air system nodes. The second approach as shown in Figure 3 takes into account an intermediate level of nodes that sums up the predic-tions of the working state reliability performance per group of identical components. Due to Equation 11, the first approach will involve 32 measures to be con-sidered for the calculation of the overall cylinder as-sembly subsystem. This relation (m = 2k), where k=32 (components), will create almost 4.3 billion failure case scenarios to be calculated in order the overall performance of the subsystem to be examined. This network arrangement will cause further programming effort as well as increased calculation and processing time.
their results do not demonstrate the practical function-ality of the system.
Figure 3. Main Engine (M/E) MRA network case study.
3.2 MRA DSS case study model arrangement
[image:6.595.51.268.65.224.2]First of all, Figure 4 presents the MRA DSS analysis of failure predictions through a user-friendly Graph-ical User Interface (GUI). The user has available in-formation related to cost analysis, maintenance ac-tions, reliability performance predictions and symptoms due to reliability loss. In Figure 4 is shown the current subsystem and component reliability per-formance and the associated warning and failures.
Figure 4. MRA DSS analysis of failure prediction.
On the other hand, Figure 5 demonstrates the symp-toms tab in a graphical format and five days predic-tion in advance from the current moment. The graphs are presented in days for this occasion and with the grid marking four-hour intervals on the time axis. This is to coincide with the regular four-hourly visits the engineers onboard the ship performs.
Figure 5. MRA DSS plotting of results.
3.3 MRA case study results
[image:6.595.308.566.226.347.2]This section presents the results of the MRA Main Engine (M/E) case study. The outcomes are demon-strated on component and subsystem level. The raw input observations involve simulated datasets, 48 measurements per day and 2 days total data of histor-ical/existing information. First of all this case study proves the ability of predicting the working state reli-ability performance on subsystem and component levels. This methodology introduces the requirement relation of forecasting double period of time of the provided recorded historical input. In other words, two days of existing input predicts the working state reliability performance of the following four days.
Figure 6. Reliability performance of crosshead bearings.
[image:6.595.33.288.390.521.2] [image:6.595.33.290.643.776.2]The figure above demonstrates the predicted working state reliability performance of the six crosshead bearings. The uniformity of the predicted results among the crosshead bearings is expected due to the utilization of simulated input datasets. Furthermore, simulating real system functioning, each component performs on different reliability levels as various pa-rameters affect each bearing. The overall reliability performance of the crosshead bearings, as shown in Figure 6, confirms acceptable forecasted working lev-els. On the other hand, negligible reliability perfor-mance loss is forecasted per bearing. This minor reli-ability difference is expected as the employed input datasets figure only two days of performance. Hence, the upcoming forecasts perform low reliability loss for the following four predicted days. The overall re-liability demonstrates performance from 99% to 98.9% and almost stable temperature at 52.3 °C. The marine engine’s manufacturer’s manual identifies normal operational temperature levels from 50-70 °C and warning alarm level at 75 °C. Hence, there is no indication of upcoming failure or abnormal compo-nent functioning.
Figure 7. Reliability performance of piston liners.
In the cases of the crosshead bearings and the piston lube oil, the safety threshold sets the maximum (up-per) limits that the warnings are introduced if the pre-dictions exceed these. On the other hand, Figure 7 presents the working state reliability performance of the piston liners. This component’s input measure-ment requires the monitoring of pressure. Hence, the manufacturer’s manual utilizes safety indices that the pressure should not drop lower than the predefined levels. The overall reliability demonstrates perfor-mance at almost stably 97.8%, whereas the pressure is at 132 bars. The manufacturer’s requirement spec-ifies the piston liner’s pressure should not drop lower than 116 bars and should not exceed 160 bars.
Similarly, the reliability performance of the cylin-der safety valves shows stable progress through time at 99.5% and 6.8 bars. In this respect, the acceptable functional level is set within the range of 6.5-7.5 bars and the warning is specified at not lower than 5.5 bars. In other words, the current reliability performance of all involved components (i.e. crosshead bearings, pis-ton lube oil, liners and cylinder safety valves) is ac-ceptable and there is no need for maintenance actions. As the scope of this study is to identify and examine the working state reliability performance, it is essen-tial to highlight that the stable performance so far sets the ground for further functioning of all components.
Figure 8. Reliability performance of starting air components.
Similarly, Figure 8 demonstrates the reliability per-formance of the scavenger air receiver, starting air distributor and starting air subsystem. The reliability levels progress stably through time higher than 98%. Lastly, the overall reliability performance at subsys-tem level for the cylinder assembly and the starting air subsystem cases is taken place. Due to the fact, all the components perform stable reliability perfor-mance, hence the subsystem does. In the case of the
subsystem reliability assessment, there is no actual measure to classify and identify a specific threshold. However, expert judgment can provide a valid indi-cation on which level the warning should be shown and further analysis on component level can be trig-gered. The overall subsystem reliability performance is expected to be increased once inspection and maintenance actions are taken on component level.
4 DISCUSSION
This paper demonstrates the development of the Ma-chinery Risk Analysis (MRA) tool. MRA is probabil-istic risk/ reliability analysis model established through the work performed in INCASS project. The investigation of literature takes into account the hu-man error issues and maintenance operation control that motivated this research study. Moreover, the lit-erature review presented in this paper consists of the latest Condition Based Maintenance (CBM) method-ology, the most applied and developed Condition Monitoring (CM) technologies and tools. The re-search is introduced by assessing the state-of-the-art of risk and reliability analysis methods.
The suggested MRA methodology is proposed as well as the MRA reliability modelling approach. The MRA methodology consists of three processing and assessment stages. The first stage involves the input data requirements, collection and processing, whereas the second stage takes into account the risk and reliability tool development. Furthermore, the third assessment stage consists of the MRA Decision Support System (DSS) and the utilization of histori-cal, expert and predicted reliability results to assist the inspection and maintenance planning. The developed MRA methodology is focused on the risk and relia-bility assessment by employing various input data types such as historical, expert and real time sensor data. The methodology consists of multiple pro-cessing and assessment methods.
[image:7.595.33.290.542.659.2]valves. The developed MRA tool predicts the work-ing state reliability performance on system, subsys-tem and component levels.
On the current research development, the dynamic risk and reliability tool is validated by ship owners, operators and service providers. According to their expert judgment, the assessed subsystem and compo-nents perform within acceptable reliability levels of ship owners’, operators’, service providers’ and Clas-sification Societies’ requirements. On the other hand, the accuracy of the reliability tool’s forecasted results is verified by employing commercial software such as Genie 2.0, Hugin 7.8 and the Markov Chain (MC) modelling using Reliability Workbench.
ACKNOWLEDGEMENT
INCASS project has received research funding from the European Union’s Seventh Framework Program under grant agreement No 605200. This publication reflects only the authors’ views and European Union is not liable for any use that may be made of the in-formation contained herein.
REFERENCES
BAGAVATHIAPPAN, S., LAHIRI, B. B., SARAVANAN, T., PHILIP, J. & JAYAKUMAR, T. 2013. Infrared thermography for condition monitoring – A review. Infrared Physics & Technology, 60,
35-55.
DELIA, M. C. & RAFAEL, P. O. 2008. A maintenance model with failures and inspection following Markovian arrival processes and two repair modes. European Journal of Operational Research, 186, 694-707.
DELVECCHIO, S. 2012. On the Use of Wavelet Tranform for Practical Condition Monitoring Issues. In: BALEANU, D. (ed.). Italy, Engineering Department in Ferrara: INTECH. DIKIS, K., LAZAKIS, I., TAHERI, A. & THEOTOKATOS, G. Risk and Reliability Analysis Tool Development for Ship Machinery Maintenance. International Symposium on "Ship Operations, Management and Economics", 28-29 May 2015 2015a Athens, Greece.
DIKIS, K., LAZAKIS, I. & THEOTOKATOS, G. Dynamic Reliability Analysis Tool for Ship Machinery Maintenance. International Maritime Association of the Mediterranean, 21-24 September 2015 2015b Pula, Croatia. University of Strathclyde, Glasgow.
DIKIS, K., LAZAKIS, I. & TURAN, O. Probabilistic Risk Assessment of Condition Monitoring of Marine Diesel Engines. International Conference on Maritime Technology, 7-9
July 2014 2014 Glasgow, UK. University of Strathclyde, Glasgow.
FORT, A., MUGNAINI, M. & VIGNOLI, V. 2015. Hidden Markov Models approach used for life parameters estimations. Reliability Engineering & System Safety, 136, 85-91. HAND, D. J., MANNILA, H. & SMYTH, P. 2001.
Principles of Data Mining, MIT Press. INCASS 2014a. Deliverable D4.1 Machinery and
equipment requirement specification. INCASS - Inspection Capabilities for Enhanced Ship Safety. EC FP7 Project.
INCASS 2014b. Deliverable D4.2 Stakeholders’ data requirements. INCASS - Inspection Capabilities for Enhanced Ship Safety. EC FP7 Project.
INCASS 2015. Deliverable D4.4 Machinery and equipment assessment methodology at component and system level. INCASS - Inspection Capabilities for Enhanced Ship Safety. EC FP7 Project.
JAIN, A. K. & DUBES, R. C. 1988. Algorithms for clustering data, Prentice Hall PTR.
JAIN, A. K., MURTY, M. N. & FLYNN, P. J. 1999. Data clustering: a review. ACM Comput. Surv., 31, 264-323.
LAZAKIS, I. & OLCER, A. I. 2015. Selection of the best maintenance approach in the maritime industry under fuzzy multiple attributive group decision-making environment. Journal of Engineering for the Maritime Environment,
13.
LAZAKIS, I., TURAN, O. & AKSU, S. 2010. Increasing ship operational reliability through the implementation of a holistic maintenance management strategy. Ships and Offshore Structures, 5, 337-357.
MECHEFSKE, C. K. 2005. Machine Condition Monitoring and Fault Diagnosis, Boca Raton, Florida, USA, CRC Press, Taylor & Francis Group.
MOBLEY, K., HIGGINS, L. & WIKOFF, D. 2008.
Maintenance Engineering Handbook, Mcgraw-hill.
SKF 2012. Condition-based maintenance must be set up correctly. Marine Propulsion - Ship lifecyle management.
THEODORIDIS, S. 2015. Machiner Learning: A Bayesian and Optimization Perspective. TSANG, A. H. C., YEUNG, W. K., JARDINE, A. K.
S. & LEUNG, B. P. K. 2006. Data management for CBM optimization. Journal of Quality in Maintenance Engineering, 12,
37-51.
TURAN, O., LAZAKIS, I., JUDAH, S. & INCECIK, A. 2011. Investigating the reliability and criticality of the maintenance characteristics of a diving support vessel. Quality and Reliability Engineering International, 27,