City, University of London Institutional Repository
Citation
:
Schnell, R., Trappmann, M. and Gramlich, T. (2014). A Study of Assimilation
Bias in Name-Based Sampling of Migrants. Journal of Official Statistics, 30(2), pp. 231-249.
doi: 10.2478/jos-2014-0015
This is the accepted version of the paper.
This version of the publication may differ from the final published
version.
Permanent repository link:
http://openaccess.city.ac.uk/14383/
Link to published version
:
http://dx.doi.org/10.2478/jos-2014-0015
Copyright and reuse:
City Research Online aims to make research
outputs of City, University of London available to a wider audience.
Copyright and Moral Rights remain with the author(s) and/or copyright
holders. URLs from City Research Online may be freely distributed and
linked to.
A Study of Assimilation Bias in Name-Based
Sampling of Migrants
Rainer Schnell1, Mark Trappmann2, and Tobias Gramlich3
The use of personal names for screening is an increasingly popular sampling technique for migrant populations. Although this is often an effective sampling procedure, very little is known about the properties of this method. Based on a large German survey, this article compares characteristics of respondents whose names have been correctly classified as belonging to a migrant population with respondents who are migrants and whose names have not been classified as belonging to a migrant population. Although significant differences were found for some variables even with some large effect sizes, the overall bias introduced by name-based sampling (NBS) is small as long as procedures with small false-negative rates are employed.
Key words: Hard-to-Reach populations; sampling; undercoverage; onomastic sampling.
1. Sampling Migrants
Migrants are of particular interest in the social sciences. However, in many countries research on migrants is hampered by the lack of appropriate sampling frames for migrant populations. Census or register data or other lists of the population of interest may exist, but these sampling frames are usually not available for any purpose other than official statistics. Since the proportion of migrants is often small, and registers unavailable, special sampling procedures for rare populations have to be used (Sudman and Kalton 1986;Kalton 2009).
1.1. Common Sampling Procedures for Migrants
In some situations, lists of subgroups of migrant populations are available for sampling. Examples include membership lists of migrant organisations or training seminars for naturalisation interviews (Kosmidis et al. 1980;Rutishauser and Wahlquist 1983). If the migrant population of interest tends to segregate, cluster sampling of areas with a high concentration of members from the target population could be used (Blane 1977;Ecob and Williams 1991). Occasionally, quota sampling and snowball sampling (Bertelsmann Stiftung 2009; Sulaiman-Hill and
Thompson 2011) are used. All these methods have serious methodological problems.
1
University of Duisburg-Essen, Methodology Research Unit. Lotharstr. 65, 47057 Duisburg, Germany. Email: [email protected]
2
Institute for Employment Research, Regensburger Str. 104, 90478 Nuremberg, Germany and University of Bamberg, Germany. Email: [email protected]
3
University of Duisburg-Essen, Methodology Research Unit, Lotharstr. 65, 47057 Duisburg, Germany. Email: [email protected]
Acknowledgment: Schnell had the idea for this study and the classification program, supervised data analysis
and wrote the final version. Schnell and Trappmann designed the study, Trappmann suggested the mechanisms, contributed to the text, improved the data analysis and provided data access. Gramlich wrote the first draft, computed the tests and performed the classification for the PASS data.
1.2. Name-Based Screening
Even though separate lists of migrants may not be available, very often sampling frames for a general population contain names of individuals. Thus these general population frames can be screened for names likely to belong to members of migrant populations. Name-based sampling methods (NBS) have been used in different countries and for a variety of purposes
(Mateos 2007). Most often, the lists used for NBS consist of names considered to be typical
for migrants or are constructed ad hoc by members of the target population; but of course, more sophisticated methods have also been used. For example,Braun and Santacreu (2009)
used names which featured more frequently than a specific threshold in telephone directories of different countries to identify likely members of migrant populations.
There are also examples of the use of carefully compiled dictionaries of names which have a high positive predictive value for classification as migrant (“onomastic sampling”,
Humpert and Schneiderheinze 2000). All of these methods rely on more or less error-free
records of migrants’ names exactly as listed in the dictionary. However, names or spelling variations not listed in the dictionary cannot be classified. This also applies to names which contain typographical errors. It seems safe to assume that typographical errors are more common for names which might be unusual for database maintainers.
Name-based methods are applicable when names of migrants are different from those of the domestic population. If such initial differences do exist, they are likely to persist for at least a few decades. In countries with ongoing immigration from specific regions or countries, name-based methods may differentiate between recent migrants and descendants of previous cohorts of migrants as long as names differ between different cohorts.
1.3. A Screening Procedure Based on Trigrams of Names
Schnell et al. (2013a,b) proposed a new screening procedure for sampling migrants that neither
requires reviewing names manually nor relies on exhaustive or error-free dictionaries. This procedure does not classify complete first or given names but splits names into substrings of three consecutive characters (trigrams) and classifies the names according to the relative frequencies of these trigrams within a database of names from specific countries using a naive Bayes classifier
(Mitchell 1997). Since no dictionaries are used, this procedure is resilient against spelling
varieties and typographical errors. Even names not used for the training of the Bayes classifier can be classified as long as they are similar to names listed.Schnell et al.’s (2013a,b) algorithm was trained using frequencies of given names and surnames by nationality of all the employees liable for social security contributions in Germany. The training database was specifically constructed by the Research Data Center of the Federal Employment Agency to develop this technique. The database covers more than 80 percent of the working population of Germany.
The classification process can be applied separately to a given first name (GN) and a given surname (SN). For the classification of a person, the four possible outcomes of the name classification (GN, SN * classification result) must be reduced to the classification of the person as migrant or not. Different rules could be used for this reduction process.
Only two simple rules will be considered here:
Rule 1:A person is classified as migrant when GNorSN are classified as foreign.
Rule 2:A person is classified as migrant when GNandSN are classified as foreign.
For the evaluation of the trigram-based Bayes classification, Schnell et al. (2013a,b) used names and survey data from 18,795 respondents of a national household panel. In that dataset, Rule 1 (GN or SN) yielded about 40% false positives, but the false negative rate was lower than 5% for most countries of origin. Rule 2 (GN and SN) yielded less than 10% false positive cases and the false negative rate varied between 15–20% for most countries of origin. For the current study, the results of both classification rules will be compared.
2. Definitions and Basic Demographics of Migrant Populations in Germany
The term “migrants” denotes heterogeneous groups (among others: foreigners, refugees, asylum seekers, immigrants with or without domestic nationality, domestic born descendants of migrants with/without foreign nationality). We will concentrate on one specific subgroup in this example: migrants with a foreign nationality. While this is a rather narrow definition, it is useful for many applications. Furthermore, even the most basic of sampling methods for migrants should be able to detect this group. For NBS, using nationality as the criterion for a correct classification will increase the number of false negatives compared to wider definitions of migration status. Due to screening after selection by NBS, only false negatives will contribute to bias. Therefore, we consider our results to be the lower limit of bias in name-based sampling.
The discussion of social processes following migration is extensive (as an example, see
Alba and Nee 1997). In this study we base our conceptualisation of assimilation on the
approach taken byKalter and Granato (2002, p. 200), that is, assimilation is the similarity of distributions for categories of relevant variables related to the central dimensions of education, work and family. Since each country has different migrant populations, some details on the migration to Germany is important in order to evaluate the results reported here. The vast majority of foreign names in Germany originate from two waves of immigration: the first wave (1955–1973) was the recruitment of workers for the heavy manufacturing industry. These workers were mainly recruited from Turkey, Greece, Spain, Italy and former Yugoslavia. Most of these immigrants were unskilled workers with low or no educational and vocational qualifications from their home countries (Fassmann and Mu¨nz 1994). Although initially these immigrations were to be time limited, many of these migrants remained in Germany. The subsequent migration of family members of these immigrants accounted for a large part of immigration to Germany after 1973 (e.g., seeMilewski 2007;Liebig 2007). A second wave of migration began with the demise of the Soviet Union. Many Eastern Europeans (mainly from Poland and former Soviet Republics) who had German ancestors became eligible to emigrate to Germany. Although generally better educated than the earlier wave of migrants, these more recent immigrants still encountered problems in labour market participation, mainly due to insufficient command of the German language (Milewski 2007). Every empirical study has reported that the mentioned migrant populations in Germany have a lower average education and income, higher average number of children and stronger religious attitudes than the domestic population (Babka von Gostomski 2010;Fassmann and Mu¨nz 1994).
3. Bias in Name-Based Sampling
Every selection procedure will result in biased parameter estimates of variables of interest if the selection probabilities are correlated with the variables of interest (Bethlehem
2009, p. 222), and if the estimation does not correct for the unequal selection probabilities. In name-based sampling, the probability of having a name classified as belonging to a migrant population may correlate with indicators of assimilation: better-assimilated migrants are likely to have a higher probability of having their name classified as domestic. At least four different mechanisms can explain this:
1. In most European countries (outside academic circles), it is common for women to adopt the family name of their husband after marriage. Since immigrants intermarry with domestic partners, the proportion of domestic surnames will be higher for female migrants. It seems very likely that female migrants with domestic partners are more assimilated than female migrants with migrant partners. However, there seems to be no official data on the frequency of name changes after marriages in general or for binational couples. Especially with binational couples in which the husband has no migration background, this will result in misclassification of the wife’s migration background in many cases.
2. The given names chosen by migrant parents for their children will reflect their preferences: better assimilated migrants more often prefer domestic names (Becker
2009;Gerhards and Hans 2009).
3. If the languages of the country of origin and the host society are similar (as, for example, in Germany, Austria and large parts of Switzerland), the probability of misclassification increases: again, migrants whose names are misclassified as domestic are more likely to be more assimilated.
4. Naturalised migrants may choose to modify their names to assimilate to the host society more. At the same time, more assimilated migrants may show a greater desire to become naturalised.
Mechanisms 2 and 4 do not have to hold in countries which encourage multiculturalism and ethnic distinctiveness. In some countries (for example, Germany) all mechanisms are plausible. Given all or some of these mechanisms, name-based sampling of migrants – whether dictionary-based or not – is more likely to include less assimilated migrants with higher probability. Since the sampling depends solely on the classification of the name, false negative classifications of migrants will result in biased estimates when false negative classified (FN) persons differ from true positive classified (TP) persons:
EðBðYÞÞ ¼ nfn nfnþntp
ðYtp2YfnÞ with
EðBðYÞÞthe overall bias in the mean of variableY
nfn the number of false negative classifications
ntp the number of true positive classifications
Ytp the mean in variableY for the true positives
Yfn the mean in variableY for false negatives
The expected bias is the product of the proportion ðnfnÞ=ðnfnþntpÞof false negatives
among all migrants, with the difference in means for a variable of interest between true positives and false negatives,Ytp2Yfn. There may be no bias despite a high rate of false
negative classifications if there are no differences between false negatives and true positives. However, there may be large bias despite a low rate of false negative classifications in the case of large differences between the two groups. Whilst false positives can be excluded after a screening interview, false negatives are excluded from the sampling frame. Thus false positive classified persons only increase sampling costs, but false negative classified persons may lead to coverage bias.
There is little published literature on the estimated false negative rate of different sampling procedures and even less on differences between falsely negative and truly positive classified persons in migration surveys. This lack of studies is surprising, since most studies of migrants are dedicated to the study of some dimension of assimilation. A systematic bias in a sampling procedure would compromise the results of such a study. Because name-based sampling is considered one of the best techniques for sampling migrants if no other sampling frame is available, we conducted a study to examine the differences in characteristics between false negative and true positive classified migrants.
4. Hypothesis
As detailed in Section 3, this article uses the definition of assimilation as similarity of distributions over categories of relevant variables. Accordingly, more assimilated migrants in Germany are predicted to have fewer children, smaller households, higher rates of intermarriage, higher incomes, a better education, a less traditional religious orientation and a better command of the majority (German) language. Although there are some differences between countries of origin, this process of assimilation can be observed for most migrant populations in Germany (Babka von Gostomski 2010, p. 79 – 113;
Statistisches Bundesamt 2011, p. 193 – 199). Due to the four mechanisms described above
that link the degree of assimilation to names, we predict significant differences with respect to assimilation variables between migrants identified by name-based sampling compared to nonidentified migrants.
5. Data
We examined data from the first wave of one of the largest German panel studies (PASS,
Trappmann et al. 2010,Bethmann and Gebhardt 2011,Trappmann et al. 2013). PASS is a
general population household panel survey, oversampling low-income households and households receiving welfare benefits. The survey is based on a sequential mixed mode design of CATI and CAPI interviews. To enhance survey participation of migrants in PASS, foreign-language questionnaires in Turkish, Russian, and English were administered by foreign-language CATI interviewers. The survey includes questions on nationality, country of birth, year of immigration, and the social and economic situation of the respondents. Additionally, there is information on nationality, country of birth, and year of immigration for the respondents’ parents and grandparents. We compared variables expected to be related to the assimilation process between all migrants in the sample and those migrants
who would be identified by a name-based sampling procedure. For this study, the names of the respondents were classified with the Bayes classifier suggested bySchnell et al.
(2013a,b). Names and survey data were held separately within the governmental agency
owning the data; all procedures were approved by the responsible data protection agents. Among the 18,795 respondents whose names were classified, 1,610 persons reported a foreign nationality and 3,104 reported being born outside of Germany. Here, we focus on data from the 1,610 foreigners (migrants with foreign nationality). Although there may be response error in the indicators of migration background as well as the variables related to different dimensions of assimilation, the following calculations consider these reports as true since previous studies of PASS showed neither serious measurement error nor nonresponse bias for variables which could be validated with administrative data (Sakshaug
and Kreuter 2012;Kreuter et al. 2010;Schnell et al. 2010). With the first rule 1,509 out of
1,610 migrants with foreign nationality were classified as true positive (101 false negative classifications). With the second classification rule 63 percent true positive classifications were observed (1,020 TP, 590 FN).
All analyses are conducted with the unweighted PASS sample. While typically researchers are interested not in the sample per se but in inferences which can be drawn from the sample, in this methodological article the goal is to isolate one source of error, namely coverage error (although due to legal restrictions we are only able to investigate this for respondents). This can best be done by neglecting sample weights, which mainly correct for unequal sampling probabilities and differential nonresponse between demographic groups. By displaying a weighted analysis we would have a mix of coverage error, differential nonresponse rates between migrants and domestic respondents and adjustment error in the weighting procedure. While the effect of the interaction of these error sources on total survey error is an interesting topic for future research, we felt this to be too complex an issue since currently not much is known about coverage bias alone.
6. Results
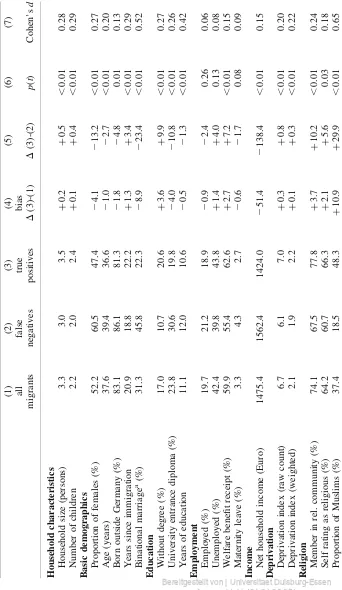
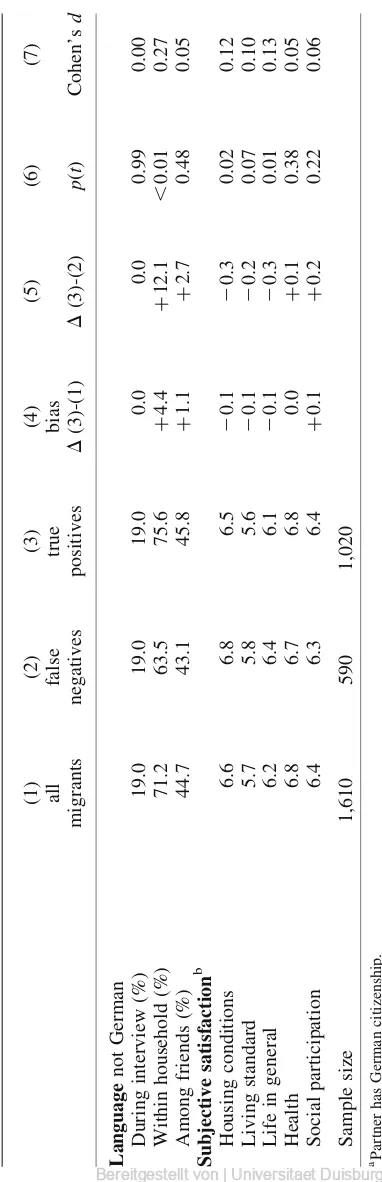
Results of our empirical analysis for all subgroups of migrants can be found inTable 1for Rule 1 (GN or SN) and intable 2for Rule 2 (GN and SN). Both tables contain estimates of bias and raw differences. For brevity we will focus on the raw differences between false negatives and true positives.
Both tables are organised in the same way. Column (1) shows the mean of a variable for all migrants in the PASS survey. Column (2) shows the mean for those respondents who would be missed by NBS (false negatives, FN). Column (3) is the mean for those migrants who would have been selected by NBS (true positives, TP). Column (4) is the difference between Columns (3) and (1). This is equivalent to bias as calculated using the formula in Section 3. Column (5) gives the difference between the detected (TP) and nondetected (FN) migrants. Column (6) gives thep-value for at-test on mean difference (or difference in proportion) between TP and FN. Finally, Column (7) shows the effect size for the difference between TP and FN. Cohen’s d¼ ðM12M2Þ=ðSDpooledÞ was used as a
measure of effect size. Values ofdgreater than 0.2 are considered as small effects, values greater than 0.5 as medium effects (Ellis 2010, p. 41).
Table 1. Differences betw een all migrant s, false ne gative and tru e positiv e cases (Rule 1: G N or SN) (1) (2) (3) (4) (5) (6) (7) all false true bias migrants negative positive D (3)-(1) D (3)-(2) p ( t ) Cohen’s d Household characterist ics Household size (persons) 3.3 2.8 3.3 0.0 þ 0.6 , 0.01 0.34 Number of children 2.2 1.9 2.3 0.0 þ 0.3 0.04 0.27 Basic demographi cs Proportion of females (%) 52.2 64.4 51.4 2 0.1 2 13.0 0.01 0.26 Age (years) 37.6 42.6 37.3 2 0.3 2 5.3 , 0.01 0.39 Born outside Germany (%) 83.1 83.2 83.1 0.0 0.0 0.98 0.00 Years since immigration 20.9 21.3 20.9 0.0 2 0.4 0.76 0.04 Binational marriage a (%) 31.3 61.4 29.3 2 2.0 2 32.2 , 0.01 0.70 Education Without degree (%) 17.0 10.9 17.4 þ 0.4 þ 6.5 0.09 0.17 University entrance diploma (%) 23.8 41.6 22.6 2 1.2 2 19.0 , 0.01 0.45 Years of education 11.1 12.8 11.0 2 0.1 2 1.7 , 0.01 0.55 Employmen t Employed (%) 19.7 30.3 19.1 2 0.7 2 11.3 0.01 0.28 Unemploye d (%) 42.4 36.0 42.7 þ 0.4 þ 6.8 0.21 0.14 Welfare benefit receipt (%) 59.9 44.6 61.0 þ 1.1 þ 16.4 , 0.01 0.37 Maternity leave (%) 3.3 9.0 2.9 2 0.4 2 6.1 , 0.01 0.34 Income Net household income (Euro) 1475.4 1876.2 1448.1 2 27.3 2 428.1 , 0.01 0.48 Deprivation Deprivation index (raw count) 6.7 4.8 6.8 þ 0.1 þ 2.0 , 0.01 0.49 Deprivation index (weighted) 2.1 1.4 2.1 0.0 þ 0.7 , 0.01 0.48
Tab le 1. Continued (1) (2) (3) (4) (5) (6) (7) all false true bias migrants negative positive D (3)-(1) D (3)-(2) p ( t ) Cohen’s d Religion Member in rel. community (%) 74.1 65.6 74.6 þ 0.5 þ 9.0 0.05 0.21 Self-rating as religious (%) 64.2 53.3 64.9 þ 0.7 þ 11.6 0.02 0.24 Proportion of Muslims (%) 37.4 5.9 39.5 þ 2.1 þ 33.6 , 0.01 0.70 Language not German During interview (%) 19.0 9.9 19.6 þ 0.6 þ 9.7 0.02 0.25 Within household (%) 71.2 44.6 72.9 þ 1.7 þ 28.3 , 0.01 0.63 Among friends (%) 44.7 26.3 46.4 þ 1.7 þ 20.0 , 0.01 0.41 Subjective satisfaction b Housing conditions 6.6 7.1 6.5 0.0 2 0.6 0.03 0.22 Living standard 5.7 6.4 5.6 0.0 2 0.8 , 0.01 0.30 Life in general 6.2 6.7 6.2 0.0 2 0.5 0.06 0.19 Health 6.8 6.7 6.8 0.0 þ 0.1 0.73 0.04 Social participation 6.4 6.5 6.4 0.0 2 0.1 0.77 0.03 Sample size 1,610 101 1,509 aPartn er has German cit izenship. bMea n o n 10-po int scale.
Tab le 2. Differences be tween all migrant s, false negative and true positi ve cases (Rule 2: GN and SN) (1) (2) (3) (4) (5) (6) (7) all false true bias migrants negatives positives D (3)-(1) D (3)-(2) p ( t ) Cohen’s d Household characteristic s Household size (persons) 3.3 3.0 3.5 þ 0.2 þ 0.5 , 0.01 0.28 Number of children 2.2 2.0 2.4 þ 0.1 þ 0.4 , 0.01 0.29 Basic demographi cs Proportion of females (%) 52.2 60.5 47.4 2 4.1 2 13.2 , 0.01 0.27 Age (years) 37.6 39.4 36.6 2 1.0 2 2.7 , 0.01 0.20 Born outside Germany (%) 83.1 86.1 81.3 2 1.8 2 4.8 0.01 0.13 Years since immigration 20.9 18.8 22.2 þ 1.3 þ 3.4 , 0.01 0.29 Binational marriage a (%) 31.3 45.8 22.3 2 8.9 2 23.4 , 0.01 0.52 Education Without degree (%) 17.0 10.7 20.6 þ 3.6 þ 9.9 , 0.01 0.27 University entrance diploma (%) 23.8 30.6 19.8 2 4.0 2 10.8 , 0.01 0.26 Years of education 11.1 12.0 10.6 2 0.5 2 1.3 , 0.01 0.42 Employment Employed (%) 19.7 21.2 18.9 2 0.9 2 2.4 0.26 0.06 Unemployed (%) 42.4 39.8 43.8 þ 1.4 þ 4.0 0.13 0.08 Welfare benefit receipt (%) 59.9 55.4 62.6 þ 2.7 þ 7.2 , 0.01 0.15 Maternity leave (%) 3.3 4.3 2.7 2 0.6 2 1.7 0.08 0.09 Income Net household income (Euro) 1475.4 1562.4 1424.0 2 51.4 2 138.4 , 0.01 0.15 Deprivation Deprivation index (raw count) 6.7 6.1 7.0 þ 0.3 þ 0.8 , 0.01 0.20 Deprivation index (weighted ) 2.1 1.9 2.2 þ 0.1 þ 0.3 , 0.01 0.22 Religion Member in rel. community (%) 74.1 67.5 77.8 þ 3.7 þ 10.2 , 0.01 0.24 Self rating as religious (%) 64.2 60.7 66.3 þ 2.1 þ 5.6 0.03 0.18 Proportion of Muslims (%) 37.4 18.5 48.3 þ 10.9 þ 29.9 , 0.01 0.65
Tab le 2. Continued (1) (2) (3) (4) (5) (6) (7) all false true bias migrants negatives positives D (3)-(1) D (3)-(2) p ( t ) Cohen’s d Language not German During interview (%) 19.0 19.0 19.0 0.0 0.0 0.99 0.00 Within household (%) 71.2 63.5 75.6 þ 4.4 þ 12.1 , 0.01 0.27 Among friends (%) 44.7 43.1 45.8 þ 1.1 þ 2.7 0.48 0.05 Subjective satisfaction b Housing conditions 6.6 6.8 6.5 2 0.1 2 0.3 0.02 0.12 Living standard 5.7 5.8 5.6 2 0.1 2 0.2 0.07 0.10 Life in general 6.2 6.4 6.1 2 0.1 2 0.3 0.01 0.13 Health 6.8 6.7 6.8 0.0 þ 0.1 0.38 0.05 Social participation 6.4 6.3 6.4 þ 0.1 þ 0.2 0.22 0.06 Sample size 1,610 590 1,020 aPartn er has German cit izenship. bMea n o n 10-po int scale.
[image:11.471.165.356.66.657.2]6.1. Overall Comparison of Rule 1 Versus Rule 2
Rule 2 results in quite a substantial false negative rate of 36.7% but generates few false positives (6.8%). By contrast, Rule 1 has a false negative rate of only 6.3%, but produces more false positives (41.1%). Thus screening costs would be lower for Rule 2.
A general pattern is obvious from the tables: On most (20 of 28) variables the absolute difference between false negatives and true positives (Column 5) is higher for Rule 1 (GN or SN) than for Rule 2. This is exactly what we would predict based on our hypotheses: Migrants who differ in given name and surname from the domestic population are less well assimilated than persons who only differ in either first name or last name. However, as bias is equal to the product of this difference with the false negative rate and the false negative rate is more than five times higher for Rule 2 than for Rule 1 the resulting absolute bias (Column 4) is, in almost all cases, larger for Rule 2 than for Rule 1. Thus, Rule 1 should be used if there are concerns about a possible assimilation bias.
6.2. Demographic and Assimilation Variables
In accordance with the hypotheses about the assimilation process, correctly identified persons (TP) live in larger households with more children than FN (who would have been missed by NBS). Furthermore, NBS would miss more females. All three effects are significant (withp,0:05). However, NBS would yield small biases for household size and number of children. This holds for both rules. The exception is the proportion of females: NBS with Rule 2 would result in an underestimation of 4.1 percentage points, since the proportion of females is higher among the FN. The smaller proportion among the TP is most probably due to the adoption of the name of the husband after marriage. This could be indicative of more general assimilation bias in NBS, since gender is correlated with many assimilation indicators (for example, employment status and education).
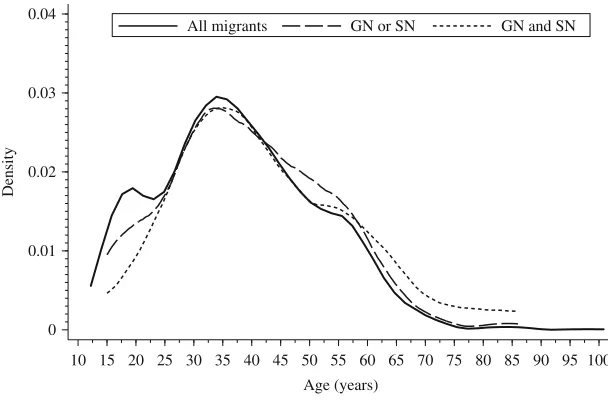
Whereas the individual probability of a change of name due to naturalisation or marriage is expected to decrease with age, the overall probability for a domestic name should increase with duration of stay; furthermore the proportion of domestic names is expected to be higher for children of migrants. Therefore, the age distribution of all migrants should differ from the distribution of those who could be found by NBS. As can be seen from the tables, in fact the migrants from NBS were significantly younger on average (Rule 1: 5.3 years; Rule 2: 2.7 years). From the kernel-density plots inFigure 1, it is also clear that both rules more likely miss the younger migrants (aged 15 – 22 years). In particular, Rule 2 seems to favour older migrants above the age of 45. In total, this is a small effect, causing a small bias of less than one year in the estimation of the mean age. As age is closely related to years since immigration (for those who were born outside Germany) a similar effect could be expected for this variable. The estimation of years since immigration is unbiased for Rule 1 and slightly biased for Rule 2 (1.3 years difference); giving a small but significant effect for Rule 2. Almost the same pattern can be seen for the percentage of respondents born outside Germany.
6.2.1. Binational Marriage
Binational marriage is defined here as an officially recorded partnership of a migrant with a German partner. This is a rare event in Germany: Based on official statistics,
Haug (2011)reports about 17% of the first generation male migrants (20% for females) to be married to a German partner. For the second generation of migrants these figures rise to 28% and 21% for males and females respectively. In this dataset, about 31% of the respondents in a recorded partnership reported a binational marriage. Amongst those who would have been missed by NBS, the percentage is almost double (61.4%). Amongst those selected by NBS, the percentage is about 29% (Rule 1) and 22% (Rule 2). Both differences are significant with medium effect sizes. Due to the small proportion of false negatives for Rule 1, however, the overall underestimation (i.e., bias) by NBS would be 2 percentage points for Rule 1 and 8.9 percentage points for Rule 2.
6.2.2. Education
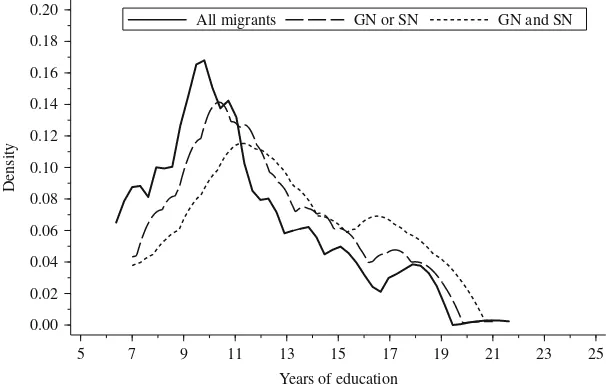
Education is considered as a key requirement for successful assimilation. Therefore, higher educational attainment would be expected amongst more assimilated migrants. Hence, differences between population parameters and NBS estimates are most probable. In fact, regardless of which indicator is used to reflect educational attainment in PASS, the predicted differences can be observed.Tables 1 and 2show the same pattern of results for the proportion of migrants with no school qualifications, the proportion of migrants with a university entrance diploma and years of education. On average, those missed by NBS are better educated than those found by NBS. Five of six comparisons between FN and TP are significant, but only one indicator has a medium effect size. The indicator ‘years of education’ has one of the largest effects reported here with d¼0:55 for Rule 1 and d¼0:42 for Rule 2. Nonetheless, the resulting underestimation would be small (0.1 and 0.5 years).Figure 2shows the effect clearly: better-educated persons are more likely to be missed by both rules, but the proportion of highly educated persons among the migrants is so small that the effect on overall mean estimation is also small.
0 0.01 0.02 0.03 0.04
Density
10 15 20 25 30 35 40 45 50 55 60 65 70 75 80 85 90 95 100
Age (years)
[image:13.471.98.402.71.271.2]All migrants GN or SN GN and SN
Fig. 1. Distribution of age for all migrants and false negative cases for Rule 1 and 2
6.2.3. Employment Status and Receipt of Benefits
About 20% of all migrants in the total sample are employed. Regardless of which rule is used, the proportion of employed persons is always higher among the migrants who would have been missed by NBS. For Rule 1, the difference between FN and TP is more than 11 percentage points (2.4 percentage points for Rule 2): a significant, albeit small effect. The resulting bias in the estimation of employed persons would be lower than 1 percentage point. The same pattern of results can be observed for the estimation of unemployment and the proportion of females on maternity leave.
The effect is slightly more prominent in the estimation of households receiving welfare benefits. About 60% of the migrants in the unweighted PASS sample received welfare benefits. Migrants who would have been missed by NBS received welfare benefits less frequently than the population of all migrants and less frequently than those who would have been selected by NBS. The difference of 16.4 percentage points (Rule 1; for Rule 2: 7.2 percentage points) is significant, with only a small effect size. It leads to a bias ofþ1.1 percentage points for Rule 1 andþ2.7 percentage points for Rule 2.
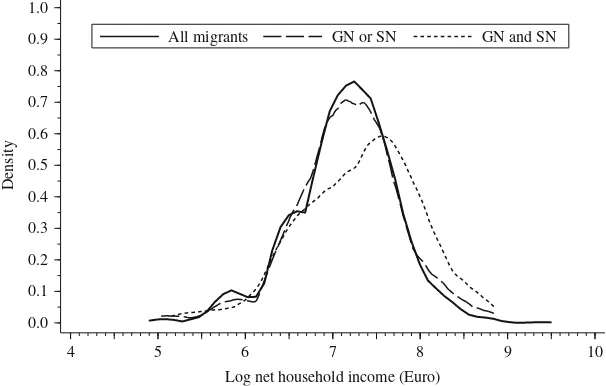
6.2.4. Household Income
Income is a central variable in social science and economic research and also a major indicator of successful assimilation. Therefore, if NBS has an assimilation bias, lower income would be expected for migrants identified by NBS compared to migrants who would have been missed by NBS. This hypothesis is clearly supported by the data: the differences of 428 Euros (Rule 1) and 138 Euros (Rule 2) between true positives and false negatives are significant. For Rule 2, the effect size of d¼0:48 is among the largest effects reported here. The absolute bias of 27 Euros (Rule 1; 51 Euros for Rule 2) approximates to nearly 1.9% (3.5%) of total income. A plot (Figure 3) of the estimated
0.00 0.02 0.04 0.06 0.08 0.10 0.12 0.14 0.16 0.18 0.20
Density
5 7 9 11 13 15 17 19 21 23 25 Years of education
[image:14.471.67.370.73.268.2]All migrants GN or SN GN and SN
Fig. 2. Distribution of years of education for all migrants and false negative cases for Rule 1 and 2
income distributions for all migrants and the false negative cases of both rules shows the large bias in income which would occur if NBS with Rule 2 were used.
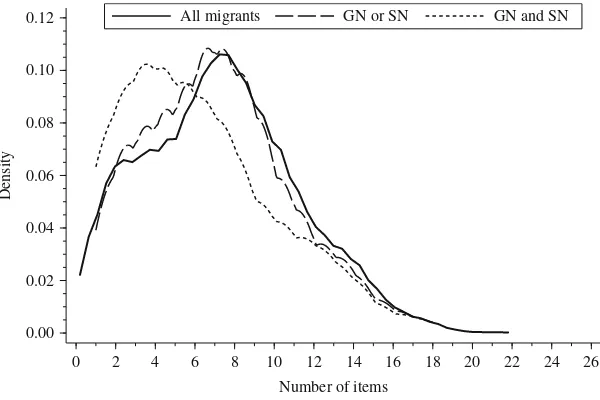
6.2.5. Deprivation
Based on a list of 26 goods, facilities and social activities,Christoph et al. (2008, p. 46)
defined an “index of deprivation” as the number of items or facilities which the members of a household do not possess or use due to financial restrictions. The list contained goods and facilities such as central heating, indoor toilet, washing machine, refrigerator, TV and social activities such as inviting friends for dinner or visiting cultural events. The weighted version of this index counts items if the respondents rate them as ‘necessary’. This deprivation index can be seen as a measure of successful assimilation, and therefore differences between better and less well-assimilated migrants are likely. Thus an assimilation bias of NBS would be expected in this instance.
Figure 4shows the estimated distributions of the deprivation index for all migrants and
migrants who would have been missed by NBS according to Rule 1 or Rule 2. For both subgroups of false negatives, the distribution shifted to the left, so that true positives of NBS would overestimate the index. The difference between the subgroups is significant with a small to medium effect size. Again, the overestimation effect is larger for Rule 2 (biasþ.3 points compared toþ.1 points for Rule 1).
6.2.6. Religion
The traditional assimilation process in modern Western societies usually leads to weakened religious values and decreased religious behaviour. So differences in indicators of religious behaviour due to NBS are to be expected. PASS has three indicators of religious behaviour: Membership in a religious community, the proportion of Muslims, and the degree of self-reported religiousness (seeTables 1 and 2). The pattern of results is
0.0 0.1 0.2 0.3 0.4 0.5 0.6 0.7 0.8 0.9 1.0
Density
4 5 6 7 8 9 10
Log net household income (Euro)
[image:15.471.100.403.74.267.2]All migrants GN or SN GN and SN
Fig. 3. Distribution of log net household income (Euro) for all migrants and false negative cases for Rule 1 and 2
the same for all three indicators and both rules: those migrants who would have been missed by NBS are less religious than the sample of all migrants and those who would have been identified by NBS are more religious than the sample of all migrants. The difference in the proportions of Muslims is striking. In the population of all migrants in PASS, the proportion of Muslims is about 37%, but among those missed by NBS, the proportion is only about 6% (Rule 1) and about 19% (Rule 2). All six differences between FN and TP are significant. However, all but the effect sizes regarding the proportion of Muslims (d¼0:70 with Rule 1 and d¼0:65 with Rule 2) should be regarded as small. Bias is much larger for Rule 2 than for Rule 1 for all three variables, peaking 10.9 percentage points for the proportion of Muslims which is the largest bias reported here.
6.2.7. Language
The ability to read, speak and write the language of the host society is considered to be of crucial importance for assimilation. Sufficient language skills enable contact with the domestic population and participation in social, political and everyday activities. Success in school and in the labour market also depends on language skills. Therefore differences in indicators relating to the command of the language of the host society due to NBS can be expected. PASS has three direct or indirect indicators of language skills and language use. PASS records the language in which an interview was conducted, there is a question about the language used predominantly in the household and finally the predominant language used amongst friends outside the household is recorded.Table 1shows the same pattern of results as for most other indicators for Rule 1. Those missed by NBS seem to be more assimilated than those detected by NBS. All three language indicators differ significantly between FN and TP. However, despite some medium-sized effects, the differences between TP and the total sample are small. The effect sizes for Rule 2 are even
0.00 0.02 0.04 0.06 0.08 0.10 0.12
Density
0 2 4 6 8 10 12 14 16 18 20 22 24 26
Number of items
[image:16.471.69.369.72.272.2]All migrants GN or SN GN and SN
Fig. 4. Deprivation index for all migrants and false negative cases for Rule 1 and 2
smaller. The largest effect for both rules can be seen for the dominant language within the household. Here, Rule 2 produces a bias of þ4.4 percent. Surprisingly, results for language use do not seem to be strongly biased by NBS.
6.2.8. Subjective Satisfaction
These results are based on demographic variables or language use. When subjective variables such as satisfaction with housing conditions and living standards were considered, there were only minor differences between the overall population and the two groups of false negatives. In general, satisfaction was higher amongst the smaller group of false negatives (with first and last names classified false negative) than in the population. As might be expected, subjective satisfaction with health and social participation, which are less related to the assimilation process, do not show the same pattern: overall bias for subjective measures is never larger than .1 points on the eleven point scale employed.
6.3. Summary
Our central hypothesis is clearly supported by the data. For most of the assimilation-related variables considered here, there are significant differences between migrants identified by NBS versus migrants not identified by NBS: in total, 21 of 28 tests for Rule 1 and 20 of 28 tests for Rule 2 showed significant differences with p#0:05. However, the effect sizes for Rule 1 were small for 17 of 28 tests, four additional effect sizes were medium whereas only three Rule 2 effect sizes were larger than d¼0:3. In summary: name-based sampling results in biased estimates, but the effect sizes are mostly small.
7. Discussion
Name-based sampling procedures differ with respect to details for the generation of sampling frames. However, since all name-based methods share the common problem of undercoverage through assimilation, they are all vulnerable to the same selection effects. Therefore, it is reasonable to expect the same overall pattern of results for all name-based sampling procedures.
In this study on assimilation bias we found significant, but usually small differences in education, employment, frequency of intermarriage, income and religious behaviour between the complete sample and the name-based sample. Although effect sizes were on average larger for Rule 1 than for Rule 2, Rule 1 produced almost no bias due to the low FN rate; no single bias exceeded 2.1 percentage points for this rule. Rule 2 on the other hand showed a substantial FN rate which caused considerable bias for some variables despite small effect sizes. For example, the proportion of Muslims was overestimated by 10.9 percentage points and the proportion of binational marriages was underestimated by
28.9 percentage points. In studies with sample sizes in the order of 2,000 to 5,000 respondents, which are quite common, this systematic bias will exceed the sampling error. If high accuracy for assimilation variables is required by a research project, procedures with lower FN rates than Rule 2 should be used. Although this is the first study to date on bias in name-based samples, it has some limitations. The restrictions imposed by German
law limit name classification to survey respondents only; names of refusals cannot be used. Therefore, the results depend on the assumption that response in the survey is not highly correlated with the classification result. Although it seems possible that false negative migrants in NBS have higher refusal or noncontact rates, we consider our results to be robust with regard to this assimilation effect. However, this issue merits further examination in a separate study.
Furthermore, we have to assume that the survey report on migration background is unbiased and that answers to the questions about dependent variables are either unbiased or bias is the same across the groups that we have compared. If there was bias in the responses to questions on these dependent variables such as income or welfare receipt and this bias differed in size between all migrants, whether false negatives or false positives, this would affect the results of this study. There is, however, no evidence for this artifact.
This study focused on foreign national migrants, which was justified by the theoretical assumption that limiting the study to this subgroup should reduce bias. We tested the effect of this definition further using broader definitions of migrant groups. As expected, bias increased when broader definitions of migration status were used. For example, when migrants were defined as everyone who has foreign nationality, or was born abroad, or has at least one parent born abroad, bias inTable 1increased for 25 of 28 variables. Using other definitions of migration status also seemed to increase bias; we therefore consider our results indicative of the lower limit of bias.
The results of this study are of course dependent on the current German migrant population. Each country will have different results at different points in time. These results are likely to depend on the proportions and characteristics of migrant groups, likelihood of intermarriages, legal requirements for naturalisation or name changes and so on. However, it is highly plausible that the four mechanisms leading to biased estimates for name-based sampling discussed above will be universal across most cultures: changing names after marriage and naturalisation, giving offspring names that are common in the host culture, and higher probability of migration from countries with a common language. These mechanisms will result in a higher probability of exclusion by name-based sampling procedures for better-assimilated migrants in almost every society. The basic message of this study thus also applies to countries other than Germany: when name-based methods are used, potential bias should be carefully examined since name-based sampling methods have the potential to enforce stereotypes about migrant populations by oversampling less-assimilated individuals.
8. References
Alba, R. and Nee, V. (1997). Rethinking Assimilation Theory for a New Era of Immigration. International Migration Review, 31, 826 – 874.
Babka von Gostomski, C. (2010). Fortschritte der Integration. Nuremberg: Bundesamt fu¨r Migration und Flu¨chtlinge.
Becker, B. (2009). Immigrants’ Emotional Identification With the Host Society: The Example of Turkish Parents’ Naming Practices in Germany. Ethnicities, 9, 200 – 225.
DOI:http://www.dx.doi.org/10.1177/1468796809103460
Bertelsmann Stiftung (2009). Zuwanderer in Deutschland. Ergebnisse einer repra¨senta-tiven Befragung von Menschen mit Migrationshintergrund. Gu¨tersloh: Bertelsmann Stiftung.
Bethlehem, J. (2009). Applied Survey Methods: A Statistical Perspective. Hoboken, NJ: Wiley.
Bethmann, A. and Gebhardt, D. (2011). User Guide “Panel Study Labour Market and Social Security” (PASS). Wave 3. (FDZ-Datenreport No. 04-2011). Nuremberg: Research Data Centre FDZ of the German Employment Agency.
Blane, H.D. (1977). Acculturation and Drinking in an Italian American Community. Journal of Studies on Alcohol, 38, 1324 – 1346.
Braun, M. and Santacreu, O. (2009). Methodological Notes. In Pioneers of European Integration: Citizenship and Mobility in the EU, E. Recchi and A. Favell (eds). Cheltenham: Edward Elgar, 241 – 254.
Christoph, B., Mu¨ller, G., Gebhardt, D., Wenzig, C., Trappmann, M., Achatz, J., Tisch, A., and Gayer, C. (2008). Codebook and Documentation of the Panel Study Labour Market and Social Security (PASS): Introduction and Overview, Wave 1 (2006/2007) (FDZ-Datenreport No. 05-2008). Nuremberg: Research Data Centre FDZ of the German Employment Agency.
Ecob, R. and Williams, R. (1991). Sampling Asian Minorities to Asses Health and Welfare. Journal of Epidemiology and Community Health, 45, 93 – 101. DOI:
http://www.dx.doi.org/10.1136/jech.45.2.93
Ellis, P.D. (2010). The Essential Guide to Effect Sizes: Statistical Power, Meta-Analysis, and the Interpretation of Research Results. Cambridge: Cambridge University Press. Fassmann, H. and Mu¨nz, R. (1994). European Migration in the Late Twentieth Century:
Historical Patterns, Actual Trends, and Social Implications. Frankfurt: Campus. Gerhards, J. and Hans, S. (2009). From Hasan to Herbert: Name-Giving Patterns of
Immigrant Parents Between Acculturation and Ethnic Maintenance. American Journal of Sociology, 114, 1102 – 1128.
Haug, S. (2011). Binationale, Interethnische und Interreligio¨se Ehen in Deutschland. Familie, Partnerschaft, Recht, 10, 417 – 422.
Humpert, A. and Schneiderheinze, K. (2000). Stichprobenziehung Fu¨r Telefonische Zuwanderumfragen. Einsatzmo¨glichkeiten der Namensforschung. ZUMA-Nachrichten, 24, 36 – 64.
Kalter, F. and Granato, N. (2002). Demographic Change, Educational Expansion and Structural Assimilation of Immigrants: The Case of Germany. European Sociological Review, 18, 199 – 216. DOI:http://www.dx.doi.org/10.1093/esr/18.2.199
Kalton, G. (2009). Methods for Oversampling Rare Subpopulations in Social Surveys. Survey Methodology, 35, 125 – 141.
Kosmidis, G., Rutishauser, I., Wahlquist, M., and McMichael, A. (1980). Food Intake Patterns Amongst Greek Immigrants in Melbourne. Proceedings of the Nutrition Society of Australia, 5, 165.
Kreuter, F., Mu¨ller, G., and Trappmann, M. (2010). Nonresponse and Measurement Error in Employment Research: Making Use of Administrative Data. Public Opinion Quarterly, 74, 880 – 906. DOI:http://www.dx.doi.org/10.1093/poq/nfq060
Liebig, T. (2007). The Labour Market Integration of Immigrants in Germany (OECD Social, Employment and Migration Working Paper No. 47). Paris: Organisation for Economic Co-operation and Development OECD.
Mateos, P. (2007). A Review of Name-Based Ethnicity Classification Methods and Their Potential in Population Studies. Population, Space and Place, 13, 243 – 263.
DOI:http://www.dx.doi.org/10.1002/psp.457
Milewski, N. (2007). First Child of Immigrant Workers and Their Descendants in West Germany: Interrelation of Events, Disruption, or Adaptation? Demographic Research, 17, 859 – 895.
Mitchell, T.M. (1997). Machine Learning. Boston, MA: McGraw-Hill.
Rutishauser, I.H. and Wahlquist, M. (1983). Food Intake Patterns of Greek Migrants to Melbourne in Relation to Duration of Stay. In Proceedings of the Nutrition Society of Australia, 8, 49 – 55.
Sakshaug, J. and Kreuter, F. (2012). Assessing the Magnitude of Non-Consent Biases in Linked Survey and Administrative Data. Survey Research Methods, 6, 113 – 122. Schnell, R., Gramlich, T., Mosthaf, A., and Bender, S. (2010). Using Complete
Administration Data for Nonresponse Analysis: The PASS Survey of Low-Income Households in Germany. In Proceedings of Statistics Canada Symposium 2010. Social Statistics: The Interplay among Censuses, Surveys and Administrative Data. Ottawa: Statistics Canada, 104 – 109.
Schnell, R., Trappmann, M., Gramlich, T., Bachteler, T., Reiher, J., Smid, M., and Becher, I. (2013a). Ein neues Verfahren fu¨r namensbasierte Zufallsstichproben von Migranten. Methoden – Daten – Analysen, 7(2), 5 – 33.
Schnell, R., Trappmann, M., Gramlich, T., Bachteler, T., Reiher, J., Smid, M., and Becher, I. (2013b). A new method for name-based sampling of migrants using n-grams. (Working Paper No. 2013-04). German Record Linkage Center, Nuremberg. Available
at;http://www.record-linkage.de/-download=wp-grlc-2013-04.pdf
Statistisches Bundesamt (ed.). (2011). Datenreport 2011. Berlin: Bundeszentrale fu¨r politische Bildung.
Sudman, S. and Kalton, G. (1986). New Developments in the Sampling of Special Populations. Annual Review of Sociology, 12, 401 – 429.
Sulaiman-Hill, C.M. and Thompson, S.C. (2011). Sampling Challenges in a Study Examining Refugee Resettlement. BMC International Journal of Health and Human Rights, 11, 2 – 11. DOI:http://www.dx.doi.org/10.1186/1472-698X-11-2
Trappmann, M., Gundert, S., Wenzig, C., and Gebhardt, D. (2010). PASS: A Household Panel Survey for Research on Unemployment and Poverty. Schmollers Jahrbuch. Zeitschrift fu¨r Wirtschafts- und Sozialwissenschaften, 130, 609 – 622.
Trappmann, M., Beste, J., Bethmann, A., and Mu¨ller, G. (2013). The PASS Panel Survey after Six Waves. Journal for Labour Market Research, 46, 275 – 281.
DOI:http://www.dx.doi.org/10.1007/s12651-013-0150-1
Received February 2013 Revised October 2013 Accepted November 2013