City, University of London Institutional Repository
Citation
:
Agyei-Ampomah, S., Clare, A., Mason, A. and Thomas, S. (2015). On luck versus skill when performance benchmarks are style-consistent. Journal of Banking & Finance, 59, pp. 127-145. doi: 10.1016/j.jbankfin.2015.05.013This is the accepted version of the paper.
This version of the publication may differ from the final published
version.
Permanent repository link:
http://openaccess.city.ac.uk/12010/Link to published version
:
http://dx.doi.org/10.1016/j.jbankfin.2015.05.013Copyright and reuse:
City Research Online aims to make research
outputs of City, University of London available to a wider audience.
Copyright and Moral Rights remain with the author(s) and/or copyright
holders. URLs from City Research Online may be freely distributed and
linked to.
City Research Online: http://openaccess.city.ac.uk/ [email protected]
On luck versus skill when performance
benchmarks are style-consistent
Sam Agyei-Ampomaha, Andrew Clareb,*, Andrew Masonc, and Stephen Thomasb
a
Cranfield School of Management, Cranfield University, Cranfield MK43 0AL. b
The Sir John Cass Business School, City University, London, UK. c
Surrey Business School University of Surrey Guildford GU2 7XH
.
This Version: April 2015
___________________________________________________________________________ Abstract
We firmly believe that style-appropriate, investible benchmarks not only provide a more parsimonious way of describing manager performance, but also that their use better aligns performance evaluation with the real world performance targets of fund managers’. It is against such benchmarks that managers should be judged. With this principle foremost in our approach, in this paper we use style-consistent benchmarks to determine whether any observed alpha produced by a sample of U.S. equity funds is due to skill or to luck. We find that different segments of the market, ranging from large-cap growth to small-cap value, exhibit different levels of skill and luck. Our results also show that the use of standard multi-factor models underestimates managerial ability and overstates the proportion of funds whose abnormal performance can be attributed to chance rather than to skill, when compared against the use of style-consistent practitioner benchmarks. We also find that a single factor performance evaluation model that uses Russell style indices consistent with the style orientation of a fund and market practice provides a parsimonious way of accounting for fund performance. Finally, our findings should be of particularly relevance in mutual fund markets where the risk factors commonly used in the academic literature to evaluate manager performance – SMB, B/M, MOM and others – are not readily available
JEL classification: G1
Keywords: Mutual fund performance; style benchmarks; skill versus luck
___________________________________________________________________________
*Corresponding author. Tel.: +442070405169
E-mail addresses:[email protected] (Agyei-Ampomah);
[email protected] (Clare); [email protected] (Mason); [email protected]
2
1. Introduction
It is difficult to understate the importance of the US mutual fund industry; 92 million
individuals, or 54 million households in the U.S. own mutual funds and these funds hold 24%
of U.S. corporate equity. At the end of 2012 the $13 trillion of mutual fund assets were
approximately the same size as the assets of all commercial banks in the United States.
(Investment Company Institute, 2013, Federal Reserve, 2013). Of this $13 trillion, $4.3
trillion are invested in U.S. domestic equities, and 83% is managed on an active basis. Given
its importance it is essential to strive to explain the existence or absence of skill amongst
those charged with the oversight of these actively managed assets. However, there is a
significant amount of evidence in the finance literature that suggests that actively managed
mutual funds underperform the market and/or their assigned benchmarks on average (at least
net of fees). For example, Lakonishok et al (1994) and Carhart (1997) (amongst many
others) find little evidence of skill. Wermers (2000) finds that skill may exist at the gross of
fee level but this does not filter through to the ultimate investor through net of fee returns. A
number of researchers have found that performance persistence tends to exist amongst the
poorest performers (see for example Goetzmann and Ibbotson (1994) or Berk and Tonks
(2009)), although Grinblatt and Titman (1992), Goetzmann and Ibbotson (1994) and Fama
and French (2010) document evidence of positive persistence for the very top performing
funds.
Many of the studies that attempt to establish the existence, or otherwise of skill amongst
active fund managers, apply standard multi-factor models as the relevant benchmarks for
performance comparison, with the factors popularised by Fama-French serving as the major
point of reference here. However, recent empirical studies have shown that alphas obtained
3
Cremers et al (2012), Argon and Ferson (2006), or Angelidis et al (2013)). However, as well
as potentially misstating the degree of skill, the use of multifactor benchmarks embodies the
implicit suggestion that, in addition to the market portfolio, fund managers should invest in
hedge portfolios that compensate for risks associated with small, growth and momentum
stocks. However, the major drawback of this ‘advice’ from the academic community to the
fund management community is that these hedge portfolios are not investible when one takes
into account capacity constraints and transaction costs, particularly the transactions costs of
shorting even the largest, most liquid stocks (see Huij and Verbeek (2009)). Christopherson
et al (2009) provide an excellent description of the desirable characteristics of a financial
market benchmark. A benchmark should provide a “naïve” representation of the set of
investment opportunities facing investors; in our case a style group of mutual funds. The
index should be investible and cover the practical opportunities for an investment style. It
should be float-adjusted, that is, it should be based on the market capitalisation of tradable
shares. Perhaps more importantly, the benchmarks should have a clear, simple and
transparent construction methodology that can be easily replicated by others. The risk factors
that comprise the multi-factor performance evaluation models are not replicable, investible
benchmarks and as such their use in performance evaluation raises the question as to what
exactly is being evaluated with their use.
With regard to the constraints that managers have to operate within by their mandates such
constraints can vary significantly across different investment style groups. If, for example, a
fund markets itself as a ‘Large Cap Growth fund’, then managers of the fund are constrained
in terms of the stocks that they can hold in the fund’s portfolio as a result of regulatory
requirements and other restrictions from the fund’s sponsors and trustees (see Clarke et al
4
be inefficient in assessing managerial ability. Indeed, Kothari and Warner (2001) and
Angelidis et al (2013) argue that standard mutual fund performance measures are unable to
identify significant abnormal performance if the fund's style characteristics differ from those
of the benchmark portfolio, while Cremers et al (2012) highlight biases and shortcomings of
the standard factor models. Chan et al (2009) show that for conventional size and value style
U.S. funds over the period 1989-2001, there is disagreement about the sign of excess returns
in approximately one quarter of cases, while absolute annual abnormal returns can also differ
by large magnitudes depending on the choice of benchmark. Consistent with the predictions
of Kothari and Warner (2001), Angelidis et al (2013) and Cremers et al (2012), we show in
this paper that average performance of the different style groups using style-consistent
benchmarks is economically different from those obtained using the standard multi-factor
models, by as much as 0.34% per month in the case of small cap growth funds. All the small
cap style groups (growth, blend and value), on aggregate, generate significant superior
performance (net of cost) when measured against their respective style benchmarks. Using
benchmarks that ignore the fund manager’s mandated investment style and philosophy can
therefore affect performance evaluation by misstating managerial skill. Evidence of
differential performance across different style groups has also been reported by Chen,
Jegadeesh and Wermers (2000) and Kosowski et al (2006).
Although using an appropriate, investable benchmark is a necessary component in the
identification of manager skill, it is not however necessarily sufficient. Recent empirical
studies have shown that the identification of significant positive alphas is not sufficient to
confirm whether superior investment skill exists. These studies examine whether abnormal
fund performance, where it is observed, is due to managerial skill or pure luck. Cuthbertson
5
others, all provide evidence to suggest that the limited amount of skill that can be identified is
largely attributable to good luck rather than to skill. These studies however examine the issue
of luck versus skill across the entire cross-section of funds as a whole and use standard
multi-factor benchmark models, ignoring the potential differential performance across style groups
and industry convention which emphasises peer groups and investable benchmarks.
Kosowski et al (2006) find evidence of skill amongst a ‘sizeable minority’ of funds that
cannot be attributed solely to luck. When they look at fund performance on the basis of a
small number of prospectus objectives they find evidence of skill for growth-oriented funds
but none for income-oriented funds.
Although a number of studies mentioned above show that alphas that are obtained from
standard multi-factor models misstate managerial ability compared to industry style
benchmarks, we are not aware of any study that provides a similar comparison with regard to
the ‘luck versus skill’ debate. If the alphas generated by multifactor models can be
economically different from comparative alphas from the style-consistent benchmarks, then
luck versus skill analysis based on the multifactor models also has the potential to be
misleading. This observation is important because evidence of skill using the style-consistent
benchmarks can provide an explanation for the apparent inconsistency between lack of
managerial skill in the literature and growth in the mutual fund industry. In addition to
aligning manager objectives with the benchmark more appropriately, the use of
style-consistent benchmarks is also more appropriate for the ‘skill versus luck’ debate because a
style-consistent factor model should provide a better explanation of style-based fund returns
(compared to standard factor models) because the factor (benchmark) will be more closely
aligned with each fund’s objectives and risk return parameters1. Chan et al (2009) note that
6
the better a benchmark tracks a manager’s active portfolio the more confidence there can be
that any excess performance is due to skill and not to luck.
In this paper we address these issues by examining the performance of U.S. equity mutual
funds, over the period 1990 to 2011, both at the aggregate level and by investment style to
determine whether these managers have positive skill, or not. However, we analyse this
performance using both standard single, and multi-factor models and by using
style-consistent benchmarks produced by Russell Indexes2. We then extend the ‘luck versus skill
debate’, by using both multi-factor models and style-appropriate benchmarks. To do this we
implement Fama and French’s (2010) simulation methodology to determine how much of any
fund manager’s performance is due to luck (good or bad) and how much is due to skill. Our
results indicate that within sub-samples of funds, based on the industry conventions of
investment style groups, investment skill exists, as does the antithesis of investment skill.
Further, we find that some segments of the market perform much better than others when
measured against their respective benchmarks. These segments tend to be in the small-cap
and mid-cap sectors where it might be reasonable to expect specialised management skills to
be rewarded. Our results also show that the use of standard multi-factor models
underestimates managerial ability and overstates the proportion of funds whose abnormal
performance can be attributed to chance rather than to skill, when compared against the use
of style-consistent, practitioner benchmarks. We also find that standard information criteria
measures (such as the Akaike (1973, 1981), and Schwarz (1978) information criteria) for the
style-consistent models were mostly lower or comparable to similar measures for the
multi-factor models. As a result, we also conclude that style-consistent benchmarks, being better
2 As Haughton and Pritamani (2005) note, Russell Indexes aim to create indices that maximise the ease with
7
aligned with investment manager mandates, offer a more parsimonious way of accounting for
the risks in style and size tilts. Finally, although we find that the addition of the multi-factor
risk variables can enhance the explanatory power of performance evaluation models based
only an appropriate Russell Style index marginally, the economic meaning on the related
signs of the coefficients are often difficult to rationalise.
The paper therefore makes three key contributions to the literature. First, we show that as
well as producing results that can be difficult to assign economic meaning, the use of
standard multi-factor models underestimate managerial ability and overstate the proportion of
funds whose performance can be attributed to chance3. In other words, we find that more
managers have skill than has been documented elsewhere in the literature. Second, we
evaluate different levels of skill across the main style groups typically used in the U.S.
mutual fund industry. Finally, we find that the use of style-consistent and investable passive
benchmarks provides a parsimonious approach accounting for the size and style tilts of the
funds. These findings should have significant implications for both institutional and retail
investors when they consider allocating funds to specific sectors of the market and in the
decision to select an active or a passive manager. The rest of the paper is organised as
follows: in Section 2 we describe our data and methodology; in Section 3 we present our
empirical results; while Section 4 concludes the paper.
2. Data and Methodology
In this paper, following industry practice, we examine mutual fund performance among
different investment style groups and consider whether the observed performance goes
3
8
beyond what can be attributed to ‘luck or chance’. Using monthly returns of over 2,300 US
equity mutual funds over the period from 1990 to 2011, we assess fund performance using a
range of performance benchmarks suggested in the literature and a simulation technique that
follows Fama and French (2010). The range of performance benchmarks includes the use of
appropriate Russell Indices that are consistent with the size and style orientation of the
respective style groups.
2.1Data
Our sample of mutual funds is from the Morningstar database and consists of 2,384 surviving
and non-surviving U.S. equity funds over the period from January 1990 to December 2011.
Our sample selection began with all actively managed funds from the diversified U.S. equity
funds sector over the sample period. For the purposes of the regression exercises we only
included those funds that should have monthly returns data spanning at least 36 months. In
some cases funds may have more than one share class, but these different share classes are
not different funds; instead they are based on the same underlying portfolio. These different
classes of fund are available to different types of investors; including all of the share classes
of all funds, and would not tell us anything additional about manager skill. We deal with this
issue by screening for the oldest fund share classes which, as well as having the longest
time-series of return (by definition), are generally the largest fund classes and account for the
largest proportion of total fund assets4. The number of funds in the sample varies from year
to year, ranging between 421 funds in 1990 to 1,992 funds at the end of 2011. For each fund,
we obtain monthly data on fund returns (both gross and net of fees), assets under
4 Different authors have addressed this issue in different ways. For example, Vardharaj and Fabozzi (2007)
9
management (AUM) and the fund’s equity style as assigned by Morningstar. The
Morningstar-assigned equity style box is used to separate funds into different style groups.5
The choice of benchmark is an important issue. When examining the performance of fund
managers we believe that it is important to use a benchmark that is closely aligned to the
manager’s active portfolio and mandate. In this paper we use the style-based Russell indices
as benchmarks. The Russell indices are the most commonly used industry benchmarks
accounting for an estimated 72% market share in terms of U.S. domiciled institutional assets.
while the S&P 500 is the most commonly used individual benchmark, and remains the
dominant benchmark for the Large-cap Blend segment of the market, it has been overtaken
by the Russell Indices for the larger Large-cap segment (according to the Russell Annual
Benchmark Survey (2013)). The Large-cap blend segment of the market also contains the
vast majority of index funds, which are excluded from our study because we focus only on
active managers, who account for 83% of assets under management in U.S. domestic
equities. The Russell Style Indices also have a longer history than other style indices, and are
commonly used in academic research (see for Chan et al. (2009 and Cremers et al (2012)).
We obtained the Russell Total Return Indices used in the style-consistent model from Russell
Investments, and the risk factors for the market, size, book-to-market and momentum used in
the Fama and French (1993) and the Carhart (1997) models from the Ken French Data
Library.6
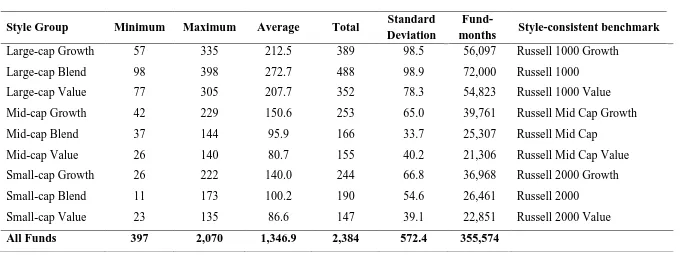
An overview of our data is found in Table 1 which shows the minimum, maximum, average
and the standard deviation of the temporal number of funds and fund-months in each style
5 Morningstar style groups are formed on the basis of size and a combination of the growth and valuation factors
which are used to assess a fund’s growth/value orientation.
6 K. French Data library http://mba.tuck.dartmouth.edu/pages/faculty/ken.french/data_library.html. Russell
10
group over the sample period. There are a total of 355,574 fund-month observations from
2,384 funds over the period from January 1990 through December 2011. The different style
groups contain the following number of funds: Large-Cap Growth 389; Large-Cap Blend
488; Large-Cap Value 352; Mid-Cap Growth 253; Mid-Cap Blend 166; Mid-Cap Value 155;
Small-Cap Growth 244; Small-Cap Blend 190; and Small-Cap Value 147. All style groups
are therefore well represented in the sample. The last column in Table 1 shows the relevant
style-consistent Russell Indices used in subsequent analysis.
2.2Performance Measures
Following the literature, we estimate fund performance using both single-factor and
multi-factor asset pricing models. Our empirical framework can therefore be expressed as:
∑ (1)
where is the fund return, is the return on the risk free rate, is the fund alpha,
is the kth benchmark or risk factor and is the residual error term.
We estimate alphas from four different perspectives. First, we estimate alphas from the
traditional single-factor capital asset pricing model (CAPM) (Jensen (1968)) in which the risk
factor is the excess return on the market; second, the Fama and French (1993) three-factor
model in which the risk factors are the excess return on the market, plus the Fama and French
size and book-to-market factors; third, the Carhart (1997) four factor model where we add to
the Fama and French three factors Carhart’s momentum risk factor. The fourth version of the
model is a single-factor CAPM-style model in which the risk factor is a style-consistent
11
in their stock selection by their investment style and objective. The specific Russell Index
used for each style group is shown in the last column of Table 1.
In addition to running our models for our full sample and style sub-samples we also run our
models for equally-weighted and value-weighted portfolios of all funds and style sub-groups.
In calculating the monthly value-weighted portfolio returns, funds in the portfolio are
weighted by the assets under management at the previous month-end.
2.3 Bootstrap Simulations
Bootstrap experiments have been used extensively in the literature to examine whether
superior fund performance is due to managerial skill or pure luck. See for example Kosowski
et al, (2006), Fama and French (2010) and Busse et al, (2010). Following Fama and French
(2010), we use simulations of individual fund returns to assess whether the observed
performance is due to the skill of fund managers or to luck by comparing the distribution of
the benchmark-adjusted, actual t(alphas) to the distribution of t(alphas) from equivalent
zero-alpha returns. We use the Fama and French (2010) simulation technique because of the
concerns raised in their paper about other simulation approaches.
More specifically, we estimate each fund’s alpha using a given benchmark model and then
subtract the alpha estimate obtained from the fund’s monthly returns. For each fund this
therefore produces a ‘net of alpha’ return series, relative to the given benchmark model, that
has the same statistical properties as the actual fund returns.- We then randomly select, with
replacement, 264 monthly returns for each of the funds. Re-sampling is done in such a way
that the 264 months drawn is the same for each fund and the other benchmark returns. This
re-12
sampled series. Ignoring the cross-sectional dependencies in the fund returns can lead to
incorrect inferences. Using the re-sampled series, for each fund we estimate the alpha and
t(alpha) for the different benchmarks. Thus for each run the same batch of re-sampled series
of zero-alpha returns is used to estimate the alpha and t(alpha) for the benchmark models.
The re-sampling process is repeated 10,000 times.
We then examine the distribution of the t(alpha)s from the simulated series and compare that
with the distribution of the actual t(alphas) of the individual funds. First, we compare the
percentiles of the cross-section of t(alpha) estimates from actual fund returns against the
average values of the percentiles from the simulated returns. We then examine the likelihood
of the observed percentile t(alphas) of the actual fund returns being realized even when the
t(alphas) are known to be zero. This is used to assess whether the observed performance is
due to skill or luck.
We focus on the distribution of the t(alphas) instead of the alpha estimates for the same
reasons outlined in Kosowski et al (2006) and Fama and French (2010). This approach
controls for differences in the precision of the alpha estimates due to differences in the
number of observations and the residual variances across the different funds. It should be
noted that alpha estimates with low precision could be spurious, albeit economically
significant. The t(alphas) can therefore be considered as precision-adjusted alpha estimates.
3. Results
In this section of the paper we present the results of our analysis based on the four benchmark
models: the CAPM, Style-Appropriate Russell Indices, the Fama and French three factor
13
3.1Aggregate Fund Performance
We begin our empirical analysis by examining the overall, or collective performance of the
funds. We do this using equally-weighted (EW) and value-weighted (VW) portfolios of all
the funds in our sample. In other words we form two ‘portfolios’ of mutual funds: the first
where each fund has an equal weighting and the second where each fund is weighted
according to its NAV. We then use these two aggregated versions of the US equity mutual
fund universe as dependent variables in OLS regressions, where the independent variables are
the appropriate factors of the four performance models. We estimate each model in gross and
net of fee versions. Each regression allows us to say something about the alpha generated by
the US equity mutual fund industry over time. These regression results are reported in Table
2.
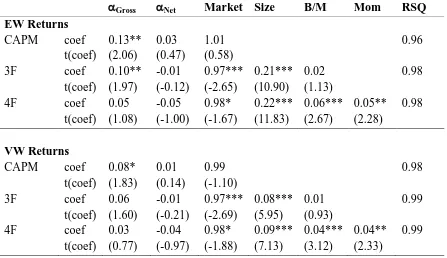
The equally-weighted CAPM alpha for all funds is 0.13% (0.03%) per month for gross (net)
returns with a t-statistic of 2.06 (0.47)7. The value-weighted portfolio of all funds has a lower
alpha of 0.08% (0.01%) per month for the gross (net) returns. These results indicate that any
manager skill is concentrated in smaller funds. If we measure performance using the Fama
and French three-factor or the Carhart four-factor models we find that there is little
value-added in these aggregate portfolios. Only the EW, Gross of fee portfolio based on the three
factor model has significant alpha 0.10% (t-statistic = 1.97). But at the net level both the EW
portfolio and VW portfolio of funds are negative, though insignificantly so. Thus in
summary, funds do generate positive alphas when benchmarked against the one factor model,
but only just enough to cover fees because the economic and statistical significance of the
alpha disappears when using net returns. These results are largely consistent with the findings
7 Note that reported alphas in this paper are on percentage per month basis unless otherwise stated in the text
14
reported in the literature (see for example Fama and French (2010)) but we document these
results to provide a basis for comparison with subsequent analysis across style groups.
On the basis of equilibrium accounting as espoused by Fama and French (2010), the
aggregate results reported in Table 2 could mask any true, value-added or positive alpha
performance because positive alpha performance in some style groups may be offset by other
fund groups with negative alpha. Kosowski et al (2006) report that while on average funds
did not beat their benchmarks there were large sub-groups with strong positive performance,
most notably the top 20% of ‘Growth’ and ‘Aggressive Growth Funds’. They also reported
the underperformance of funds with the ‘Growth and Income’ objective, which is typically
favoured by value funds. We therefore examine, at the aggregate level, whether there are
cross-sectional differences in performance based on investment style. To examine this issue,
we construct EW and VW portfolio returns for each style group and estimate their alphas
using the four variants of equation 1 above. The results are reported in Table 3, Panels A to
D.
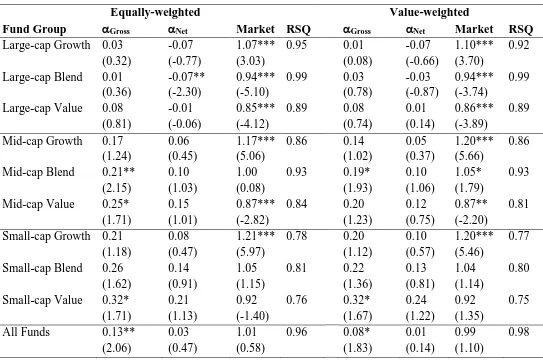
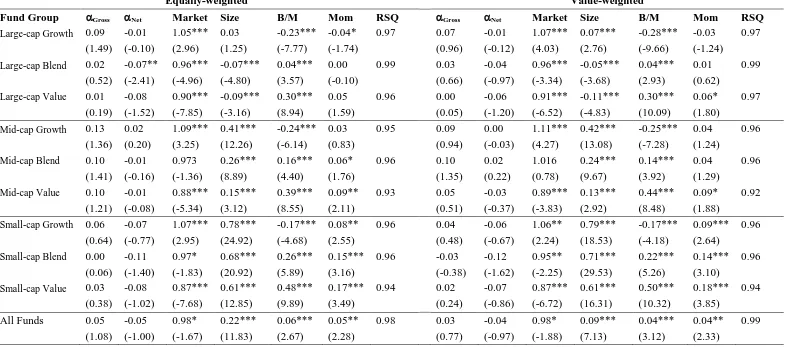
In Table 3 Panel A, we present the results based on the CAPM model for nine equity style
groups8. The gross, equally-weighted alphas are positive for all three Large-cap styles,
although none are found to be statistically significant. The net alpha equivalents are all
negative, and in the case of the Large-cap Blend category, the alpha is estimated to be -0.07%
per month and is statistically significant. The equivalent value-weighted alphas are
qualitatively very similar: the gross alphas are positive and small, but still not statistically
significant, while the net alphas are all negative although none are found to be statistically
significant. The negative net alphas for each category suggest that manager skill is not
8 The results in the last row in Panels A, B and C of Table 3, representing the results for ‘All funds’, can also be
15
sufficient to cover the fees charged for that skill. The gross and net alphas for the Mid-cap
styles are all positive, for both the equally-weighted and value-weighted versions of the
results. Relatively speaking, there appears to be more manager skill evident in these styles
than in the equivalent Large-cap styles. Furthermore the net alphas are economically
significant too. For example, the net alphas for the Mid-cap Value style are 0.15% and
0.12% per month for the equally and value-weighted calculations respectively. However, the
alphas are only found to be statistically significant for the equally-weighted, gross Mid-cap
Blend and Value styles, though not for the net equivalents, and for the gross value-weighted
results for Mid-cap blend style. Finally, the estimated net and gross alphas for the Small-cap
styles are all found to be positive for both the equally-weighted and value-weighted
calculations. Indeed, the results are qualitatively similar to those for the Mid-cap styles. The
net alphas are economically significant, particularly for the Small-cap Value style where we
find the equally and value-weighted net alphas to be 0.21% and 0.24% per month
respectively. However, once again, we do not find any of the Small-cap net alphas to be
statistically different from zero, although the equally-weighted gross alpha for Small-cap
Value is found to be statistically significant. Overall, our results indicate scant evidence of
significant, positive skill amongst US equity managers when using the traditional CAPM
model; any skill that is evident seems to be concentrated in Mid- and Small-cap funds and/or
in smaller funds.
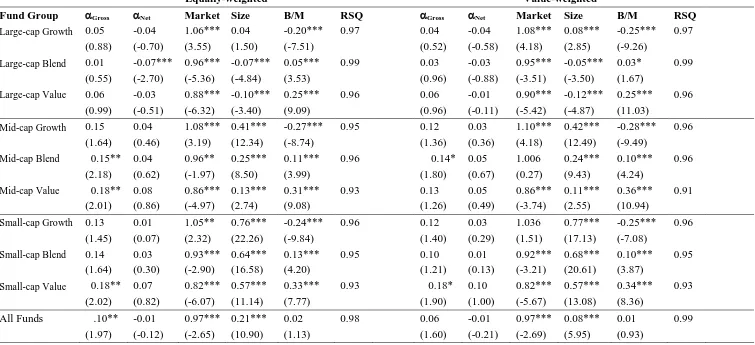
Panel B of Table 3 present results based upon the three factor model. The equally-weighted,
gross alphas are all positive when we use the three-factor model, although only significantly
so for the Mid-cap Blend, Mid-cap Value and Small-cap Value styles. The equivalent net
alphas are of course smaller, are negative for all three Large-cap styles, but positive for the
16
equivalent value-weighted results are qualitatively similar. As might be expected, the
Small-cap funds have a significantly positive exposure to the size factor in Panels B and C, while
the Large-Cap funds exhibit a negative exposure to the same factor. For example, in Table
3B the ‘Size’ coefficient for Small-cap Value funds (equally-weighted) is 0.57 and highly
significant while the equivalent size coefficient for Large-cap Blend is -0.07 and again highly
significant. Similarly, Growth funds (regardless of size orientation) exhibit a negative
exposure to the book-to-market (B/M) factor with Value funds showing a positive exposure.
For example Large-cap Growth funds (equally-weighted) have a ‘book-to-market’ coefficient
of -0.20 which is significant, while the same coefficient for Large-cap Value funds is a highly
significant 0.25%.
Panel C of Table 3 presents analogous results but using Carhart’s four factor model. Again,
all of the equally-weighted gross alphas are positive although unlike with the three factor
model, none are statistically different from zero. However, the related net alphas are now
almost uniformly negative. We find that only the Mid-cap Growth style produces a positive
net alpha of 0.02% per month, which is economically small and insignificantly different from
zero anyway. The value-weighted net alphas are all found to be negative. With regard to
Carhart’s differentiating, fourth factor, momentum, the table shows that the coefficients
related to this factor are positive in all cases, the Large-cap Growth sector is the exception
here, where we find it to be negative and marginally significant for the equally-weighted
formulation, but negative and insignificantly different from zero in the value-weighted
formulation. The momentum factor is positive, statistically significant, and largest for the
three Small-cap styles. For example, for Small-cap Value style funds the equally-weighted
17
In Panel D of Table 3 we present estimates based upon the Russell style-consistent
benchmarks. First, the evidence of the existence of positive gross alpha (manager skill) is far
more compelling when we use style-consistent benchmarks. Second, all of the
equally-weighted and value-equally-weighted gross alphas are positive. With regard to the equally-equally-weighted
results, of the Large-cap styles only Growth is found to produce a significant gross alpha, but
there is evidence of an economically and statistically significant gross Mid-cap Growth and
Mid-cap Blend alphas, and even stronger evidence for all three Small-cap styles. The signs
of the equally-weighted net alphas relating to Large-cap and Mid-cap Blend and Value styles
are negative (but only significantly so for Large-cap Blend). More interestingly, the net
alphas for the Small-cap Growth and Blend styles are not only statistically significant, but
also economically significant too. The net alphas for Small-cap Growth and Small-cap Blend
are 0.28% and 0.17% per month respectively. Again, the value-weighted results are
qualitatively similar to the equally-weighted results.
3.2 Aggregate fund performance results summary
The results in Panel D of Table 3 indicate that some managers do exhibit ‘skill’ when fund
performance is measured against a benchmark which is broadly consistent with the
investment style and objectives of the fund. Cremers et al (2012) investigate the systematic
biases in the three and four factor models which may well play a part in benchmark-varying
results, notably the equal weighting of small and large stocks which do not reflect market
capitalisation and therefore investment opportunity. However, it is important to note that
while Cremers et al (2012) measure the degree of ‘active management’ inherent in managers’
decisions, we investigate where managerial skill lies within the style spectrum. The studies
are similar in the sense that both require an appropriate benchmark as a starting point.
18
since it is these benchmarks that are used to measure and monitor manager performance and,
consequently, used to determine manager remuneration.
Our results also show that the choice of benchmark has an impact on the value premium that
investors can ‘earn’ (“value minus growth”) and the size premium (“small minus large”). In
Panel 3A we find a positive value premium, that is, the alpha of the value portfolio is larger
than the alpha of the equivalent growth portfolio. For example, the gross alpha of the
Large-Cap Value portfolio is 0.08% while the gross alpha of the Large-cap Growth portfolio is
0.03%. Similarly, Panel 3A shows that the size premium is also positive. For example, the
gross alpha of the Small-cap Value portfolio is 0.32%, while the gross alpha of the Large-cap
Value portfolio is 0.08%. An interesting result arises when we consider these premia based
on the style benchmarks in Panel D of Table 3. First, the size premium remains positive. For
example, the gross Small-cap Value alpha is 0.19%, while the gross Large-cap Value alpha is
estimated to be 0.04%. However, the value premium becomes negative. For example, the
gross Small-cap Value alpha is 0.19% compared with the Small-cap Growth gross alpha of
0.40%; the Mid-cap Value gross alpha is 0.09% compared with the gross Mid-cap Growth
alpha of 0.19%; and finally, the gross Large-cap Value alpha is 0.04% compared to the gross
Large-cap Growth alpha of 0.12%.
We also find that when we use the three factor model we generate a positive value premium,
but the same process using the four factor model produces a negative value premium.9 When
we use the three factor model the size premium is estimated to be negative. Our results show
9 These observations are based on Table 3 Aggregate Fund Performance. It should be noted that for the CAPM
19
that for the three factor model and the style-consistent benchmark model there is some
evidence of superior performance amongst some style groups. In aggregate however, where
superior performance is observed this is, mostly, just enough to cover fees and expenses.
Overall, the CAPM produces the lowest average R-squared values, particularly with regard to
the three Small-cap styles of Growth, Blend and Value which were estimated respectively as
77%, 80% and 75%. Perhaps unsurprisingly the average R-squared values generated for the
Small-cap styles using the style-consistent benchmarks were the highest of all four models at
97%, 97% and 96% for the Growth, Blend and Value styles. The equivalent values produced
by the four factor model (the next highest) were 96%, 96% and 94% respectively. These
results show clearly that the style-consistent benchmarks do as good a job as the multifactor
models in explaining fund returns. We can therefore reasonably argue that the respective
Russell benchmarks used for each of the style groups adequately captures the risks embedded
in the fund characteristics such as size and growth-value orientation. This argument is further
supported by the Schwarz Information Criterion (SIC) values reported in Table 4. Table 4
shows that the SICs of the multifactor models are consistently lower than that of the CAPM.10
The SIC values of the style-consistent Russell Index model, are not only consistently lower
than the CAPM but are also lower than the comparative values of the multifactor models in at
least six cases out of nine (six in the case of the value-weighed style portfolios and seven in
the case of the equally-weighted style portfolios).11 Thus, the use of the style-appropriate
Russell indices may provide a more parsimonious way of accounting for the risks in these
style tilts as well as being more in line with industry practice which generally compares fund
returns against relevant (ie. industry constructed), passive index benchmarks. Our findings
10 The SIC is one of the standard approaches to model selection. When comparing the SIC values for different
models, the lower the value the better.
20
should also be of particularly relevance in markets where the appropriate multi-factors are not
readily available.
3.3 Combining Russell Style benchmarks with familiar risk factors
Our results in Section 3.1 and 3.2 show how it is possible to use a parsimonious model to
evaluate the performance of mutual fund managers, when the risk benchmark is more
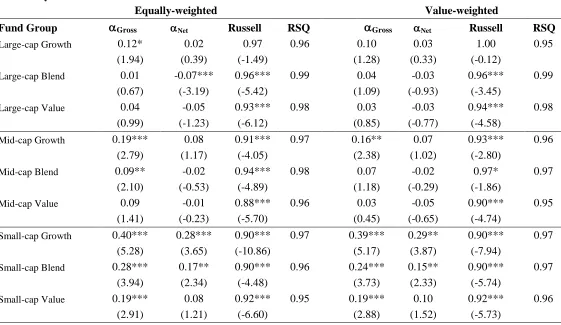
appropriately aligned with the benchmarks’ of the fund managers. In Table 5A we augment
the performance evaluation model with the familiar risk factors of Fama and French to see
what role these factors have in the presence of the fund-specific Russell Style benchmarks12.
Essentially we examine the marginal value of the risk factors in the presence of the Russell
Style benchmarks. However, given the very high correlation with the “Market” risk factor, to
avoid problems of multi-collinearity, we only add the familiar Fama and French size (SMB)
and value factors (B/M), along with Carhart’s Momentum factor (MOM) to the Russell Style
benchmarks.
Panel A in the table presents the results of average OLS coefficients from the re-estimation of
expression (1) for net of fee returns13. For each style group the table presents average
coefficients and related test statistics for estimates of expression (1) where the independent
variables are either the relevant Russell Style benchmark, or the relevant Russell Style
benchmark plus SMB, B/M and MOM. The second column in Panel A of Table 5A shows
that the average alpha for the Large Cap Growth funds is 0.013% per month, the associated t
value of 0.83, is calculated from the estimated alphas. The average coefficient on the Russell
Large Cap Growth style index is 0.979, with an associated t-value of 91.67. The third
column in Panel A presents comparable results for this style group, but with the inclusion of
12 This additional line of enquiry was suggested by an anonymous referee.
21
the SMB, B/M and MOM risk factors. The inclusion of the three risk factors increases the
average R2 from 87.1% to 91.3%, and reduces the average alpha to -0.104%, with an
associated t value of (10.01). The average beta on the Russell benchmark increases very
marginally to 0.995. The coefficients on all three risk factors representing, the size, value
and momentum effect are positive and highly significant.
The results in Panel A of Table 5A for the Large Cap Blend and Mid Cap Growth funds are
qualitatively similar to those for the Large Cap Growth funds. However, the results for the
remaining six categories are different. For these style groups one or more of the average
coefficients on the risk factors are negative. For example, the results for the Large Cap Value
style group show that the average coefficients on both the Value (B/M) and the Momentum
factors (MOM) are both negative, at -0.114 and -0.061 respectively, and are both highly
significant with t values of 10.07 and 9.46 respectively. Furthermore the intuition behind the
factors is not supported by the coefficient values. For example, the size factor (SMB) is
positive for all categories, including all the Large Cap styles, but is negative for the Small
Cap Growth style. Similarly the Value risk factor (B/M), is positive for seven of the
categories, including all three growth styles, but is negative for the Large and Mid Cap Value
styles. A simple conclusion that can be drawn from the varying and ‘incorrect’ signs of the
coefficients on the risk factors when added to the Russell indices is that style tilts have
already been accommodated by the index and that the factors are essentially surplus to
requirement.
Panel B of Table 5A presents results that are equivalent to those in Panel A, but where the
independent regressors – the return on the Russell indices, and on the risk factors – have been
22
does not affect the estimates of alpha, or the t values on the average coefficients, or R2 of the
regressions, but does change the scale of the average coefficients on the returns on the
Russell Style benchmark and on the additional risk factors. For example, the average
coefficient on the Russell Style benchmark for the Large Cap Growth style group is 0.979 in
Panel A but 4.94 in Panel B. Although this rescaling does not change the significance of the
estimated alphas or the independent regressors it does help to put into perspective the
marginal explanatory value of each of the independent regressors.
The coefficients presented in Panel B allow for a clear comparison of the impact on fund
return due to a one standard deviation increase in the value of a regressor in the model. For
example, for the Large Cap Growth style the average coefficient on the Russell Index
Benchmark (RS) is 4.94 in column 2, and 5.02 in column 3. This suggests that a one standard
deviation shock to the returns on the benchmark leads to an increase or decrease in fund
returns of around ±5% (depending upon the direction of the shock). In column 3, the average
coefficients of the SMB, B/M and MOM risk factors are 0.411, 0.289, and 0.53 respectively.
Which in turn means that a one standard deviation shock in these risk factors leads to a
±0.411%, ±0.289% and ±0.53% in fund returns respectively. Although each of the
coefficients on the additional market risk factors is statistically significant, the impact of the
benchmark returns on fund returns on average is a minimum of around 10 times larger in the
Large Cap Growth style category. In some style categories, for example for the Large Cap
Blend group, the impact of a one standard deviation shock in the style benchmark has an
impact on fund returns that is more than 25 times the impact of the same scale shock to any
of the risk factors.
23
returns is marginal in the presence of the style benchmarks. Furthermore, as stated earlier we
do not believe that these factors represent appropriate tools for evaluating the performance of
fund managers given that they are not benchmarked against these factors by their managers or
by their clients, and because these factors, in contrast to the Russell indices, are neither
investible benchmarks and are unavailable in most mutual fund markets.
3.3Luck versus skill in performance
Although the results presented in Section 3 suggest that fund managers can outperform some
benchmarks in some style groups (particularly within the Small-cap style), they do not
necessarily provide evidence of ‘managerial skill’. As argued by Fama and French (2010),
among others, the outperformance could be due to good fortune. After all, bad managers can
be lucky while good managers can be unlucky. We now explore this issue.
We apply the bootstrap simulation approach, suggested by Fama and French (2010) to
examine whether there is evidence that superior manager skill is style group-specific. We do
this in two steps. First, we examine whether funds on average exhibit superior skill; in this
case we aggregate all the funds and ignore any differential performance across style groups.
Second, we conduct the same exercise but on all funds within the nine Morningstar style
groups which correspond to commonly used market segments. This enables us to make
inferences about skill across the different style groups. In the interests of parsimony our
discussion of the results focuses on the results generated by the three-factor model and on the
style-consistent, single-factor benchmark models14.
14 Those results based upon the CAPM and the four factor model which are equivalent to those presented in
24
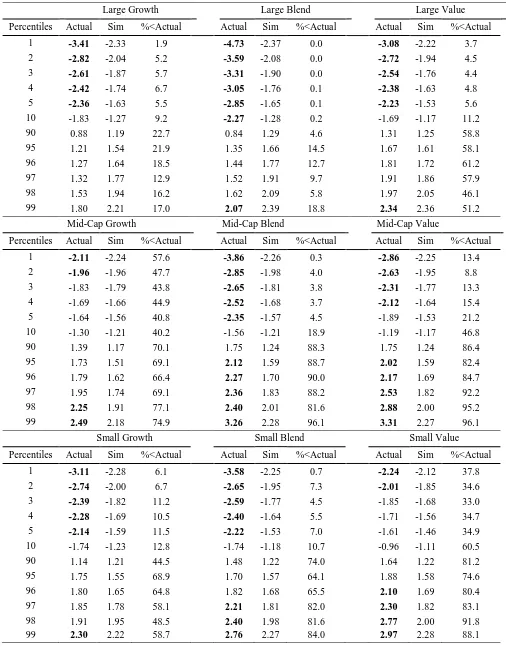
Following Fama and French’s methodology, in Tables 6 to 8 we present actual fund t(alpha)s
and simulated t(alpha)s at various percentile breakpoints in order to consider whether any
extreme negative or positive performance is due to skill or luck. In the interests of
parsimony all results are based on net of fee fund returns. The simulated t(alphas)s have been
generated using the procedure described in Section 2 of this paper. More precisely we
present estimates of t(alpha) at selected percentiles of the cumulative distribution function
(CDF) for the actual net returns (Actual), the average of the 10,000 simulations (Sim), and in
the column headed ‘%<Actual’, the percentage of the simulated runs that produce lower
values of t(alphas) at the selected percentiles than the observed percentile value for the actual
fund returns. Statistically significant results are highlighted in bold print in the tables.
Finally, in Figures 1 to 3 we present pictures of the full, related CDFs for each distribution of
t(alphas) presented in Tables 6, 7 and 8.
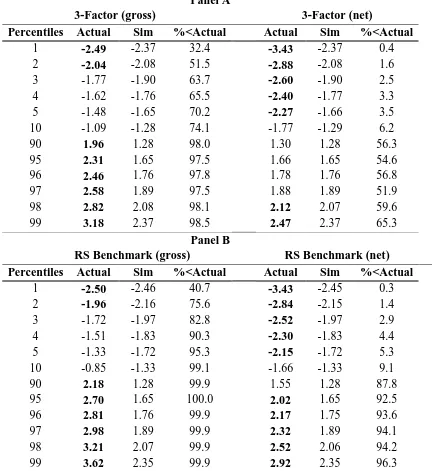
In Table 6 Panel A, we present the aggregate results for the three factor model for gross and
net of fee returns. The related cumulative distribution functions (CDF) for the actual and
simulated gross and net t(alphas) are shown in full in Panel A of Figure 1. The net of fee
results indicate evidence that the bottom five per cent of managers have demonstrated
negative skill. At the other end of the performance spectrum, only the top two per cent of
managers generate positive alpha that is due to skill (net of fees); positive alpha produced
elsewhere is not distinguishable from luck. These results are consistent with those of Fama
and French (2010). The results are also consistent with those of Busse et al (2010) who find
that the distribution of actual t(alpha) and simulated t(alpha) for the four factor model were
indistinguishable from their simulated counterparts. However, Kosowski et al (2006)
reported that while on average funds did not beat their benchmarks there were large
25
‘Aggressive Growth Funds’. They also reported underperformance by funds with the
‘Growth and Income’ objective, which is typically favoured by value funds.15
In Panel B of Table 6 we present the aggregated actual and simulated t(alphas) based upon
the style-consistent benchmarks, and present the corresponding CDFs in full in Panel B in
Figure 1. Again we focus here on the net of fee results. Using the style-consistent
benchmarks we find evidence again that the bottom five per cent of managers have
demonstrated value reducing skill. However, at the other end of the performance spectrum
we find that five per cent of managers to have added value to their funds’ performance,
compared with the just two per cent of managers when we use the three factor model.
To summarise, the results based on the style-consistent benchmarks indicate stronger
evidence of skill at the top end, while at the lower end the net of fee performance is still due
to value reducing managerial skill. At the aggregate level then our results are similar to those
of Fama and French (2010) and support their equilibrium accounting view of mutual fund
performance. Given our emphasis on the role of style benchmarks and our belief in their
potency for investment mandates and performance measurement, what can we say about luck
versus skill within different style groupings?
3.4Luck versus skill in style group performance–net of fees performance
Table 7 shows the net of fee, bootstrapped results based on the three factor Fama-French
model applied to the different Morningstar styles. Figure 2 shows the related CDFs. Forall
Large-cap fund styles we find the same pattern. In the left hand tail (bottom 10%) there is
evidence of ‘wealth reducing skill’ since the simulated alphas are lower than their actual
15 Kosowski et al (2006) consider four prospectus investment objectives Aggressive Growth, Growth, Growth
26
equivalents. At the top end of the performance spectrum, where positive t(α) is observed, it is
almost certainly due to luck, since simulated t(alpha)s are always higher than equivalent
actual alphas.
The results for the Mid-cap funds are less straightforward. For the Mid-cap Growth funds we
find evidence of a lack of skill since the actual t(α)s are more negative than the simulated
equivalents. However, the top two per cent of managers in this category demonstrate
statistically significant evidence of positive skill. For Mid-cap Blend funds we find evidence
of significant negative skill at the lower end of the performance range (bottom 5 per cent),
but evidence of significant, positive value-added skill for the top 5 per cent of performers.
The results of the Mid-cap Value funds is very similar to that of the equivalent Blend funds,
where the top five per cent of managers demonstrate skill, and the bottom 4 per cent
demonstrating significant negative skill.
The Small-cap results in Table 7 also produce some interesting results. For Small-cap
Growth funds we find evidence of negative, or value reducing skill in the lower tail, but
evidence that luck plays a large role in any apparent positive skill found in the upper tail.
Only the top 1% of Small-cap Growth managers seem to have skill. For Small-cap Blend
funds we find similar results, that is, evidence of negative skill at the bottom end of the
performance spectrum (bottom 5 per cent), and evidence of a limited amount of positive skill
among the top 3 per cent of managers. For Small-cap Value funds we find less evidence of
negative skill at the bottom end of the performance range with only the bottom two per cent
of managers demonstrating negative skill. We find that evidence of positive skill can only be
27
In Table 8 we present results based on the style-consistent Russell indices (e.g. Russell 1000
Growth for large-cap growth) as benchmarks; Figure 3 presents the related CDFs. When we
considerperformance against the Russell Indices (net of fees)it is immediately apparent that
there are considerable differences with regard to the degree of skill evident in fund
performance. Broadly speaking as we move from funds invested in Large-cap stocks through
to Mid-cap and small-cap stocks we see progressively more evidence of skill. Our results are
consistent with the comments of Busse et al (2010) who note that while it may be difficult to
observe skill when controlling for various factor models there is considerable heterogeneity
in performance. This is clearly illustrated when we consider the performance of mutual funds
on a style basis. Our results suggest strong evidence of skill at the net level for small-cap
funds as illustrated in Figure 2 Cumulative Distribution Functions by Style (based on the
results outlined in Table 8). The bottom set of plots shows a clear divergence between actual
and predicted performance for Small-cap funds.
For Large-cap Growth funds we find evidence of the antithesis of skill within the bottom 5%
of performers and evidence that luck plays a big role in those managers in the 99th percentile
that produce positive alpha. For the Large-cap Blend funds at the lower levels, the bottom
10%, we see that fund managers show significant evidence of value destroying skill, while at
the very upper end of the scale (top 1%) where positive performance is found, we find that
this positive performance is probably due more to luck than to skill. For Large-cap Value
funds we again find significant evidence of the antithesis of skill in the lower tail (bottom
5%) while at the upper tail any apparent evidence of skill in the top two per cent of funds is
28
Our results for the Mid-cap Growth funds show that in the upper tail (top 2%) the positive
performance appears to be determined by skill, whereas value destroying skill is the source of
underperformance in the lower tail. We find that the bottom ten per cent of Mid-cap Blend
funds demonstrate negative skill, while the top 3% demonstrate evidence of manager skill.
We find similar, though less extreme evidence when we consider the performance of Mid-cap
Value funds. The bottom five per cent of Mid-cap Value managers demonstrate evidence of
negative skill, while the top two per cent of these managers demonstrate evidence of skill.
Finally, the style-consistent results for the Small-cap funds presented in Table 8 indicate less
evidence of negative skill; only the bottom 3 per cent of Small-cap Blend managers
demonstrate negative skill, and there is no evidence of negative skill amongst Small-cap
Growth or Value managers, poor performance here seems to be due more to bad luck.
Second, we find clear evidence of positive skill for the top ten per cent of all Small-cap
styles. This evidence of greater skill among this group of managers is perhaps demonstrated
more clearly in Figure 3 which shows that the actual t(alpha) is considerably higher than for
the simulated results in more than 99% of cases. These results are consistent with those of
Schultz (2010) who finds evidence of stock picking skill among Small-cap growth managers.
3.5Results summary
Overall, we see more evidence of positive skill when moving from the three-factor Fama and
French model to the use of style-consistent benchmarks16. These results lead us to the
conclusion that more generic factor models may be mis-specifying the levels of luck or skill
which exists within the mutual fund industry. What general points can be extracted from
these results? First, we find that when using appropriate style benchmarks there is more
29
evidence of manager skill, that is, when compared against their mandates/prospectuses, US
equity mutual fund managers seem to possess some skill. Argon and Ferson (2006), Sensoy
(2009), Chan et al, (2009), Cremers et al (2012) and Angelidis et al (2013) all argue that a
dedicated style-consistent passive benchmark should provide a more accurate, and more
appropriate estimate of a manager’s value-added skill. In addition, we believe that it is more
appropriate to evaluate fund manager performance against benchmarks that better reflect
managers’ goals. When we compare our Russell Style benchmark results with those of Fama
and French (2010) we find that our results are not as extreme as their CAPM-based results,
that is, not as bad at the bottom end or as strong at the top end, presumably because the
Russell Style benchmarks are more closely aligned to funds’ investment universes and
objectives.
Second, we find that there are different levels of skill to be found across the main style
groups within the U.S. mutual fund industry. In the Large-cap segment of the market, where
information content and analyst coverage is very high it could be argued that more luck is
needed to differentiate fund managers from the pack. This, and economies of scale, may in
part explain the concentration of index funds in this area.
Third, in the Mid-cap and Small-cap segments of the US mutual fund industry, where we
might reasonably expect proprietary, fundamental analysis to yield more benefits, there is
statistically significant evidence of skill not only when we consider performance using the
single factor, style-consistent indices, but also when we use the three factor model (and the
four factor model). Style groups and market segments where stock picking skill have been
noted have tended to be Small-cap or growth where keeping ahead in the ‘information race’
30
consistent with the concept of the existence of ‘private information’ as considered by
Grossman and Stiglitz (1980), and Cullen et al, (2010) and Schultz’ (2010) explanation of the
economic rationale for these segments of outperformance in terms of market efficiency,
including liquidity, the costs of gathering information and the level of analytical skill
required. This value-added performance among Small-cap managers is achieved despite
higher management fees than those charged by Large-cap managers where economies of
scale can be reaped (see ICI (2013)). While we find evidence of skill in the Small-cap and
Mid-cap sectors we find no such evidence for Large-cap funds where any significant alpha is
probably due to luck and not to skill.
The results we have reported show that Mid-cap and Small-cap styles seem to perform better
than Large-cap styles against the performance models we have used at the upper end of the
performance spectrum, but the performance of Mid-cap and Small-cap blend funds is
generally worse at the lower end of the spectrum.
Another point that we would like to emphasise strongly is that the results presented in Tables
6 and 7 suggest that the risks of getting things ‘right or wrong’ are greater for Blend funds
than for those that stick to one style. For example, whether using the style-consistent or three
factor model the bottom ten per cent of Large Blend managers demonstrate significant
negative skill. Perhaps we can infer from this that it is better to be a specialist rather than a
generalist? Although, the ability to blend growth and value styles might seem attractive, it
may be that timing moves from one style to another is difficult and that the rigour associated
31
When we introduce the Small Minus Large (SML) and High Minus Low (B/M) factors of the
Fama and French (1992) model we find performance differences that probably tell us as
much about the factors themselves as about individual styles (see Table 3 Panel C or Cremers
et al, (2012)). This is perhaps most evident when we consider the performance of the
Small-cap managers. The style-consistent results for the Small-Small-cap Growth and Value funds in
Table 8, indicate that performance at the lower end of the performance spectrum might be
more the result of bad luck. However, when we look at the same tail and group of Small-cap
funds using the three-factor model in Table 7, which has a ‘size factor’, we find stronger
evidence of negative skill. At the top end of the performance spectrum, the results based
upon the three factor model for the Small-cap stocks (Table 7) indicate that most of this
positive performance is due to luck, not skill. But when we use the style-consistent
benchmarks we find strong evidence of manager skill (Table 8). We therefore conclude that
the standard, multifactor models not only underestimate managerial ability, but also overstate
the proportion of funds whose performance can be attributed to chance.
4. Conclusions
Using both industry and style-consistent benchmarks we have considered the role of skill and
luck in the performance of US equity mutual funds and asked the question: does style matter.
The academic literature is firmly wedded to the use of multifactor benchmarks whereas in
practice fund managers are generally mandated to benchmark the performance of their funds
against commercially available style-consistent ones, the most important of which by industry
penetration are constructed by Russell Indexes. We discover economically and statistically
significant performance differences when we use typical factor models compared with
style-consistent benchmarks when applied to different market segments of the U.S. mutual fund
industry. We therefore conclude that the selection of an appropriate performance benchmark
32
support the view that looking at mutual funds by market segment or investment style provides
the investor or investment sponsor with considerably more information about the existence of
value-added skill, or luck, than is revealed at the aggregate level using standard multi-factor
models. Although the average fund in our aggregate universe does little more than cover its
costs we find considerable variability in results when analysed by style group with small
proportions of funds exhibiting both value-added skill and value-destroying behaviour. The
U.S. mutual fund market is a differentiated market where managers and their clients consider
managers’ performance on the basis of style peer groups and passive benchmarks that possess
similar risk- return characteristics to the funds’ objectives. We find that style differentiation
of performance conveys useful and accurate information about the skill or lack of skill of
investment managers. Our findings also indicate that the use of style-consistent and
investable benchmarks provide a parsimonious way of assessing performance measurement
which accounts for the size and style tilts of U.S. equity mutual funds.
Our results indicate that the standard multifactor models which are most often used in
academic studies understate the existence of skill and overstate the role of luck in excess
returns, or alpha generation. Further, when we disaggregate the equity mutual fund universe
there is sufficiently diverse information based on fund styles to warrant careful evaluation
and due diligence in the selection of funds within and between styles. The economic
implications of these findings are substantial with the worst performing funds recording a
negative t(alpha) of around 5%, while the very best funds record a positive t(alpha) of more
than 3% against their relevant benchmark index. This information is economically useful, and
may in part influence the investor decision as to whether or not they use an active fund