City, University of London Institutional Repository
Citation:
Endress, A. & Siddique, A. (2016). The cost of proactive interference is constant across presentation conditions. Acta Psychologica, 170, pp. 186-194. doi:10.1016/j.actpsy.2016.08.001
This is the accepted version of the paper.
This version of the publication may differ from the final published
version.
Permanent repository link:
http://openaccess.city.ac.uk/18122/Link to published version:
http://dx.doi.org/10.1016/j.actpsy.2016.08.001Copyright and reuse: City Research Online aims to make research
outputs of City, University of London available to a wider audience.
Copyright and Moral Rights remain with the author(s) and/or copyright
holders. URLs from City Research Online may be freely distributed and
linked to.
The cost of proactive interference is constant across presentation conditions
Ansgar D. Endress
Department of Psychology, City University, London, UK
Aneela Siddique
Department of Psychology, City University, London, UK
Ansgar D. Endress
Department of Psychology
City University
Northampton Square
London EC1V 0HB, UK
Abstract
Proactive interference (PI) severely constrains how many items people can remember.
For example, Endress and Potter (2014a) presented participants with sequences of
everyday objects at 250ms/picture, followed by a yes/no recognition test. They
manipulated PI by either using new images on every trial in the unique condition (thus
minimizing PI among items), or by re-using images from a limited pool for all trials in
the repeated condition (thus maximizing PI among items). In the low-PI unique
condition, the probability of remembering an item was essentially independent of the
number of memory items, showing no clear memory limitations; more traditional
working memory-like memory limitations appeared only in the high-PI repeated
condition. Here, we ask whether the effects of PI are modulated by the availability of
long-term memory (LTM) and verbal resources. Participants viewed sequences of 21
images, followed by a yes/no recognition test. Items were presented either quickly
(250ms/image) or sufficiently slowly (1500ms/image) to produce LTM representations,
either with or without verbal suppression. Across conditions, participants performed
better in the unique than in the repeated condition, and better for slow than for fast
presentations. In contrast, verbal suppression impaired performance only with slow
presentations. The relative cost of PI was remarkably constant across conditions:
Relative to the unique condition, performance in the repeated condition was about 15%
lower in all conditions. The cost of PI thus seems to be a function of the relative
strength or recency of target items and interfering items, but relatively insensitive to
The cost of proactive interference is constant across presentation conditions
Introduction
Proactive interference (PI) occurs when the retrieval of a stimulus is impaired due
to previously experiencing similar stimuli. It has long been known to limit how many
items we can remember over the short term (see, among many others, e.g., Baddeley &
Scott, 1971; Berman, Jonides, & Lewis, 2009; Cowan, Johnson, & Saults, 2005; Endress
& Potter, 2014a; Keppel & Underwood, 1962; Kincaid & Wickens, 1970; Lewandowsky,
Oberauer, & Brown, 2009; Lustig, May, & Hasher, 2001; May, Hasher, & Kane, 1999;
Makovski & Jiang, 2008; Wickens, Born, & Allen, 1963) and over the long term (e.g.,
Baddeley, 1966; da Costa Pinto & Baddeley, 1991; Ericsson & Kintsch, 1995). It might
also contribute to one of the classic memory limitations, namely those of Working
Memory (WM). WM is a temporary memory store where we can store items for
on-going cognitive operations. It has a limited capacity (e.g., Awh, Barton, & Vogel,
2007; Luck & Vogel, 1997; Miller, 1956; Cowan, 2005; Rouder et al., 2008; W. Zhang &
Luck, 2008) or a limited precision (e.g., Alvarez & Cavanagh, 2004; Bays & Husain,
2008; Bays, Catalao, & Husain, 2009; van den Berg, Shin, Chou, George, & Ma, 2012).
Some authors have suggested that its function is to counteract the effects of PI (e.g.,
Engle, 2002). Accordingly, there are interference-based computational models of even
the most complex WM tasks — complex span tasks (Oberauer, Lewandowsky, Farrell,
Jarrold, & Greaves, 2012). Indeed, WM capacity as measured by complex span tasks
correlates with susceptibility to interference (e.g., Conway & Engle, 1994; Conway,
Kane, & Engle, 2003; Kane & Engle, 2000, 2003; May et al., 1999; Rosen & Engle,
1998), and both WM capacity and susceptibility to interference correlate with IQ (e.g.,
Braver, Gray, & Burgess, 2008; Burgess, Gray, Conway, & Braver, 2011; Conway et al.,
2003; Engle, Tuholski, Laughlin, & Conway, 1999; Fukuda, Vogel, Mayr, & Awh, 2010;
Gray, Chabris, & Braver, 2003; Kane et al., 2004). Further, brain imaging studies have
shown that the prefrontal regions that are generally linked to control functions in WM
tasks are also activated by PI, and, in fact, memory tasks that minimize PI do not seem
Ranganath & Rainer, 2003; Stern, Sherman, Kirchhoff, & Hasselmo, 2001).
Here, we investigate the cost of PI under different presentation conditions. This
question is important because the types of mechanisms we use to remember items over
the short-term are not unitary, and show contributions from visual, conceptual,
linguistic, and attentional processes, among others (e.g., Baddeley & Hitch, 1974;
Baddeley, 1996, 2003; Cowan, 1995, 2001, 2005; Endress & Potter, 2012; Feigenson &
Halberda, 2008; Kibbe & Feigenson, 2014; Olsson & Poom, 2005; Potter, 1976, 1993;
Potter, Kroll, Yachzel, Carpenter, & Sherman, 1986; Rosenberg & Feigenson, 2013;
Wong, Peterson, & Thompson, 2008; Wood, 2008). Further, at least according to some
prominent theories of WM (e.g., Cowan, 2001), the storage function of WM is fulfilled
by long-term memory (LTM; though recent research casts doubt on whether LTM is
really distinct from more short-lasting forms of memory; see Ranganath & Blumenfeld,
2005, for a review).
Given that PI emerges in a variety of situations, and that it acts on many different
processes and memory stores, the effects of PI might well be different in different
situations. Here, we start investigating this issue by testing two components of memory:
the availability of verbal memory, and the availability of LTM. We take advantage of a
recent paradigm that showed virtually no memory limitations over the short-term when
PI was minimized, but that revealed more traditional capacity limitations in the
presence of strong PI among items (Endress & Potter, 2014a). Specifically, these
authors presented adult participants with sequences of everyday pictures (taken from
Brady, Konkle, Alvarez, & Oliva, 2008) in rapid sequential visual presentation (RSVP)
at a presentation rate of 4 Hz, followed by a yes/no recognition test. Results showed
that, as long as memory items were never repeated across trials (hereafter the unique
condition), the proportion of remembered items, while well below ceiling, was essentially
independent of the number of sequence items: the longer the sequence, the more items
participants remembered (see Banta Lavenex, Boujon, Ndarugendamwo, & Lavenex,
2015, for similar results). In terms of memory capacities, participants thus did not show
across trials (hereafter the repeated condition), more traditional capacity limitations
were observed. As repeating items across trials likely creates PI among items, PI
limited the number of retrievable items. In fact, such PI is present in most WM
experiments, as memory items are typically sampled from a limited set of items that
are, therefore, repeated across trials. For example, in Luck and Vogel’s (1997) change
detection experiment, just 7 colors were re-used in hundreds of trials, which, in turn,
might have led to substantial PI across trials. Hence, PI might have limited WM
capacity estimates also in previous studies of visual WM (but see Hartshorne (2008);
Lin and Luck (2012); Makovski and Jiang (2008), for opposing views, and Endress and
Potter (2014a), for discussion).
In the experiment below, we keep “Temporary Memory” as a label for the
short-lived memory investigated here. While WM capacity estimates might have been
limited by PI in many WM experiments, we believe that the relationship between
Temporary Memory and WM is an open issue, especially for the varieties of WM
investigated in complex span tasks.
We build on Endress and Potter’s (2014a) work, and ask how the cost of PI
depends on the availability of verbal processes and of LTM. To manipulate the
availability of verbal resources, participants did or did not complete a verbal
suppression task simultaneously with the memory task. The manipulation of the
availability of LTM relies on Endress and Potter’s (2014a) and Endress and Potter’s
(2014b) experiments. In some of Endress and Potter’s (2014a) experiments, participants
completed a surprise LTM test at the end of the experiment; the retention delay was
about half an hour. Results showed virtually no retention of the unique items,
suggesting that a single 250 ms presentation of a memory item is not sufficient to create
stable memory traces. In contrast, subsequent experiments showed that four separate
250 ms presentations of an image are sufficient to yield memory traces roughly half an
hour later (Endress & Potter, 2014b). To manipulate the availability of LTM, we thus
presented memory items either for durations too fast to yield stable LTM traces
earlier research (1.5 s/picture).
Materials and method
Design
The experiment had a 2 (PI: unique vs. repeated condition) ×2 (presentation
speed: slow vs. fast) × 2 (verbal suppression: present vs. absent) mixed design. The
strength of proactive interference (unique vs. repeated) was a within-subject factor; the
two PI conditions were administered by blocks, with the order of the blocks
counterbalanced across participants. The presentation speed and verbal suppression
were between-participant factors.
This design does not separate the contributions of encoding and retrieval
operations; rather, our goal was to test whether the availability of verbal resources and
of LTM affect memory performanceat all.
Participants
Fifty-six individuals (14 per condition; 44 females; mean age = 22 years and 12
males; mean age = 29 years) from City University London participated in the
experiments below. The sample size was determined by participant availability, subject
to the constraint that the effect sizes in Endress and Potter’s (2014a) suggest that we
should find reliable PI with this sample size. An additional two individuals took part in
the experiment, but were excluded from analysis due to computer malfunction (N=1)
and excessive breaks and unusual behavior (N=1).
Participants were sequentially assigned to the conditions without verbal
suppression and with verbal suppression, respectively. Each participant chose which
presentation speed (fast or slow) they wished to take part in, based on the duration of
the session they signed up for. The order of the unique and repeated conditions were
Apparatus
Stimuli were presented on a Dell P2213 22” (55.88 cm) LCD (resolution: 1024 ×
640 pixels at 60 Hz), using the Matlab psychophysics toolbox (Brainard, 1997; Pelli,
1997) on a Mac mini computer (Apple Inc, Cupertino, CA). Responses were collected
from pre-marked “Yes” and “No” keys on the keyboard.
For the verbal suppression condition, participants were provided with a regular
rhythm at which they were to repeat the syllables. We used the Metronomo app
(downloaded from the Apple Appstore), set to a tempo of 90 beats per minute and a
rhythm of 1 beat per measure (i.e., the sequence of sounds did not comprise any
accents). The participants’ vocalizations were recorded through a USB webcam
(Logitech, Lausanne, Switzerland), using Audacity (Version 2.1.0;
http://audacity.sourceforge.net/) and exported to the mp3 format using the LAME
MP3 encoder (version 3.98.2, http://lame1.buanzo.com.ar/).
Materials
Stimuli were colour pictures of everyday objects taken from Brady et al. (2008).
These were randomly selected for each participant from a set of 2,400. In the unique
condition, the stimuli thus came from a randomly selected set of 1,290 pictures; in the
repeated condition, a randomly selected set of 22 pictures was used in all trials. There
was no overlap between these picture sets.
The pictures were presented at a resolution such that they subtended
approximately the same visual angle (approximately 12.7 × 12.7 degrees) as in Endress
and Potter (2014a). The syllables participants had to repeat during the verbal
suppression task were “vlim,”“toff,”“plof.” These syllables were chosen to have a low
phonotactic probability to make it relatively hard to automatize the verbal suppression
task.
In the verbal suppression condition, participants were tested individually in a
sound attenuated testing room. In the no suppression condition, participants were
separated by screens so that they could not see each other’s computer screens. They
were seated at a comfortable viewing distance from the computer.
Procedure
Memory task. Participants completed 120 trials in total (60 for each of the
unique and repeated conditions); the order of these conditions was counterbalanced
across participants.
They were informed that they would view sequences of pictures presented one at a
time. After the last picture of the sequence, they would see another picture, and would
have to decide whether it has been part of the sequence.
Participants started each trial by a key-press and then viewed instructions to look
at the pictures for 1,000 ms, followed by a fixation cross for 300 ms, a blank screen for
200 ms and then a sequence of 21 randomly chosen pictures. Each picture was presented
for either 250 ms or 1500 ms, depending on the condition. The sequence of pictures was
followed by a question mark (‘?’) for 800 ms, a blank screen for 900 ms and the test
item for 800 ms. Responses were collected from pre-marked keys on the keyboard. The
left shift key corresponded to a “new” response, and the right shift key to an “old”
response; both keys were marked with post-it notes. Once the response had been
recorded the next trial began with a key press.
“New” test items were presented on half of the trials. In the unique condition,
completely new images were used. In the repeated condition, the “new” picture was the
one image from the set of 22 that was not presented in the sequence. “Old” test items
(i.e. those that had been presented in the sequence) were randomly sampled from two
initial serial positions (2, 3), two medial serial positions (10, 11), and two final serial
positions (19, 20); each position was equally presented in the test items. The very first
and last images were never used as test pictures as they were unmasked. A further
constraint was that no more than 3 trials could occur in a row that had the same
response (yes/no) or the same serial position for the “old” test picture.
trials whereas those in the fast condition were given a break only after the 60th trial.
Upon completion of the experiment, all participants were given a debriefing
questionnaire, where they were asked about the kinds of strategies they had used.
Verbal suppression task. Before completing the main experiment,
participants in the verbal suppression condition were pre-familiarized with the nonsense
syllables “vlim”, “toff” and “ploff.” Specifically, the experimenter repeated these syllables
for 15 s at a rate of 90 syllables per minute, and asked the participants to repeat these
syllables as well. This was repeated until it was clear the task was understood.
Participants were instructed to repeat the syllables at a constant rhythm of 90 beats per
minute throughout the experiment (i.e. during encoding, maintenance and retrieval).
Participants were told that the verbal suppression task and the memory task had
equal importance. The participants’ vocalizations were recorded to be checked
afterwards to allow for the exclusion of any participants not engaging in verbal
suppression.
Analysis
Verbal suppression task. The participants’ vocalizations were analyzed in two
ways. First, we visually inspected the waveform using the graphical user interface of
Audacity (where syllables and their rhythm are clearly visible). We specifically verified
whether there were changes in the pronunciation rate as the experiment progressed.
The second analysis consisted of listening to randomly chosen 10 s segments from
each recording to verify that participants kept repeating the syllables at the desired
rhythm (irrespective of their phase with respect to the metronome tones). We inspected
15 and 5 segments per participants in the slow and the fast conditions, respectively.
Specifically, we verified that participants (i) performed verbal suppression throughout
the experiment without any long pauses or omissions, (ii) produced the non-sense
syllables in the correct order and (iii) pronounced the syllables at the correct rate.
Among the twenty-eight participants, two did not perform the suppression task
whilst performing both verbal suppression and the memory task. As we do not analyze
reaction times, exclusion of this participant from the data was not deemed necessary.
The other participant increased the rate of repetition on the last 2-3 trials to 270 beats
per minute, but performed the suppression task as intended for the rest of the
experiment. However, as verbal suppression still took place — as expected for most of
the experiment and in a more difficult form for 2-3 trials, this participant’s data was
retained for analysis as well.
Memory Performance. The results are reported in terms of the percentage of
correct responses. The number of correct scores was averaged for each participant.
Analyses in terms of memory capacities as estimated by Cowan’s formula (e.g.,
Cowan, 2001) would yield identical results, because, for a constant sequence length and
an equal number of “old” and “new” trials, the memory capacity estimate is linearly
related to the proportion of correct responses. However, Endress and Potter’s (2014a)
results are clearly inconsistent with constant memory capacities in this paradigm; for
example, if participants had a capacity of 30 (as estimated for 100 memory items in
their experiments), they should be at ceiling for all set sizes below 30, which was not
the case (see also Banta Lavenex et al., 2015, for similar results for spatial memory).
Hence, we analyze the data in terms of the percentage of correct responses, the hit rate,
and the false alarm rate. We will analyze the data using standard ANOVAs as well as
using generalized linear mixed models (presented in the Appendix).
We also report signal detection analyses. However, as standard signal detection
theory assumes equal variance of the noise distribution and the signal distribution, it
would not be appropriate for our data. In fact, there is substantial evidence that the
variance of the memory strength of “old” items is larger (by roughly 25%) than of new
items, irrespective of whether it is measured directly or from receiver-operant
characteristics (e.g., Mickes, Wixted, & Wais, 2007; Ratcliff, Sheu, & Gronlund, 1992,
but see Rouder, Pratte, & Morey, 2010). As a result, d0 would be an overestimate of the
actual discrimination index, and estimates of bias would be biased as well. We thus
albeit using the corrected formulae by J. Zhang and Mueller (2005). Specifically, their
sensitivity measure A is the average of (a) the minimum area under a (proper) Receiver
Operant Characteristic (ROC) curve compatible with the empirically observed hit and
false alarm rates, and (b) the maximum area under a (proper) Receiver Operant
Characteristic (ROC) curve compatible with the empirically observed hit and false
alarm rates, where a “proper” ROC curve lies above the diagonal (i.e., is concave).
Their bias measure b is the slope of the ROC curve at the criterion c, and is thus
equivalent to the likelihood ratio of the signal distribution and the noise distribution at
the criterion c.1
Finally, we calculate the cost of PI as the difference of the percentage of correct
responses between the unique and the repeated condition, divided by the percentage of
correct responses in the unique condition, i.e. uniqueunique−repeated.
Results
Percentage of correct responses
The results in terms of the percentage of correct responses are shown in Figure 1a.
We analyzed the results with an ANOVA with the within-participant predictor PI
(Repeated vs. Unique) and the between-participant predictors PI Order (Repeated first
vs. unique first), Picture Duration (slow vs. fast), and Suppression (present vs. absent)
as well as all interactions. We observed main effects of PI, F(1,48) = 60.65, p < .0001,
η2p = .519, suggesting that participants performed better in the unique condition (M =
73.96%, SD = 11.32%) than in the repeated condition (M = 62.38%, SD = 10.77%), of
Picture Duration, F(1,48) = 46.49, p < .0001,η2
p = .413, suggesting that participants
performed better for slow presentations (M = 74.23%, SD = 13.00%) than for fast
presentations (M = 62.11%, SD = 8.28%), and of Suppression, F(1,48) = 7.83, p =
.007, η2
p = .070, suggesting that participants performed better without suppression
1J. Zhang and Mueller’s (2005) proof is straightforward. If the hit and false alarm rates are
parame-terized as a function of the criterionc, they are given byH(c) =R∞
c fs(x)dxandF A(c) =
R∞
c fn(x)dx,
where fs and fn are the signal and noise density functions, respectively. As a result, the derivative of
the hit rate as a function of the false alarm rate at the criterion is given by dF AdH F A=F A(c),H=H(c) =
H0(c)
F A0(c) =
fs(c)
(M = 70.65%, SD = 12.95%) than with suppression (M = 65.68%, SD = 11.49%).
The effect of Suppression was modulated by an interaction between Picture
Duration and Suppression, F(1,48) = 4.39, p = .042, η2
p = .039. We followed up this
interaction with separate ANOVAs for the two picture durations, using the same
predictors as above except for Picture Duration and all interactions with it. For fast
presentations, the effect of Suppression was not significant, F(1,24) = .42, p = .523,
η2p = .017. When comparing a linear “null” model with only an intercept to a model
with an intercept and a slope for Suppression, the likelihood ratio was 4.2 in favor of the
null hypothesis after correction for the different numbers of model parameters, using the
Bayesian Information Criterion (Glover & Dixon, 2004). In contrast, for slow
presentations, the main effect of Suppression reached significance, F(1,24) = 8.48, p =
.008, η2
p = .235, and the likelihood ratio in favor of the non-null hypothesis was 8.0,
again after correction with the Bayesian Information Criterion.
The triple interaction between PI, PI Order and Suppression almost reached
significance, F(1,48) = 3.93, p = .053, η2p = .034.
It should be noted, however, that, when the Holm-Bonferroni correction to the α
level is applied, the only effects to reach significance are the main effect of PI
(pcorrected < .0001 for the overall ANOVA;pcorrected <.001 for the follow-up
ANOVAs), and of Picture Duration (pcorrected < .0001). Hence, at least for fast
presentations, participants do not seem to rely on verbal mechanisms when
remembering meaningful images (see also Endress & Potter, 2012, for a similar
conclusion), even though participants extract conceptual information from images even
with fast presentations (e.g., Potter, 1975; Potter, Staub, & O’Connor, 2004). However,
we believe that it is useful to know that, for slow presentation rates, we cannot exclude
that participants might use verbal strategies. An analysis using a generalized linear
Hits, false alarms, signal detection theory
We next analyzed the results in terms of the hit rates and false alarm rates (see
Figure 1b and c). We analyzed the hit rates in an ANOVA with the within-participant
factors PI and Serial Position (first vs. middle vs. last), and the between-participant
predictors PI Order (repeated first vs. unique first), Picture Duration (slow vs. fast),
and Suppression (present vs. absent), as well as all interactions. This ANOVA yielded
only a significant main effect of Serial Position, F(2,96) = 36.13, p <.0001, η2p= .39,
and a significant triple interaction between PI, PI Order and Serial Position, F(2,96) =
4.78, p = .011, η2
p = .084. However, mixed model analyses suggest that this triple
interaction is most likely due to two outliers in the middle positions of the repeated
condition when participants start with the unique conditions, see Appendix B. (The
main effects of Picture Duration, F(1,48) = 3.32, p = .075, η2
p = .057, and PI, F(1,48) =
2.95, p = .092, η2
p = .055, were only marginal, and should not be considered reliable,
given the large number of comparisons we performed.)
In sum, the main results of the analysis of the hit rates is a serial position effect.
As shown in Appendix A, this serial position effect reflects an advantage for the last
positions, and thus a recency effect.
We analyzed the False Alarm rates in the same ANOVA as the Hit rates; the
Serial Position factor was just a pro forma factor, but new items had no serial position
of course. This ANOVA yielded a main effect of Picture Duration, F(1,48) = 18.62, p <
.0001, η2
p= .253, suggesting that False Alarm Rates were higher for faster presentations,
(M = 45.65%, SD = 25.89%) than for slow presentations, (M = 27.26%, SD = 26.62%),
as well as a main effect of PI, F(1,48) = 79.29, p < .0001,η2
p= .597, suggesting that
false alarm rates were higher in the repeated condition (M = 50.24%, SD = 27.12%),
than in the unique condition, (M = 22.68%, SD = 20.78%). In other words, both a
faster presentation rate and PI boost false alarm rates. Further, it appears that the
effects of PI are carried mainly by the false alarm rates, at least in the current
experiments (see below for discussion).
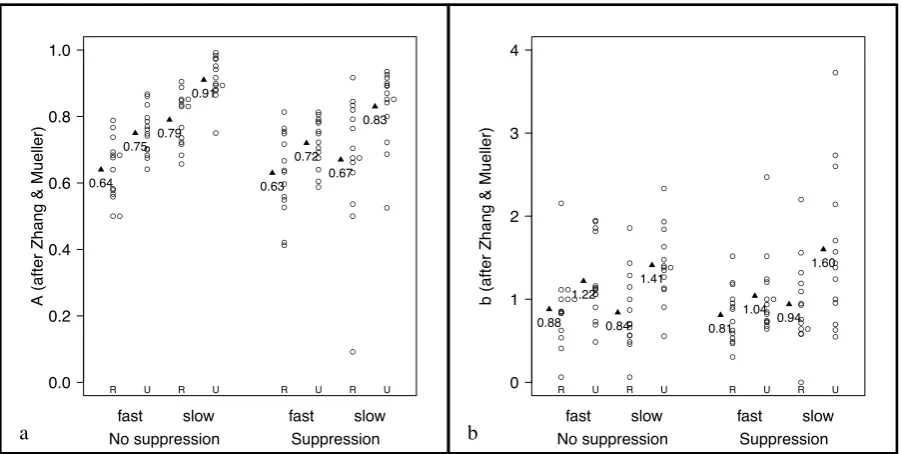
and Mueller (2005), we used A as a sensitivity estimate. We analyzed it in an ANOVA
with the within-participant predictor PI (Repeated vs. Unique) and the
between-participant predictors PI Order (Repeated first vs. unique first), Picture
Duration (slow vs. fast), and Suppression (present vs. absent) as well as all interactions
(see Figure 2a).
The ANOVA revealed a significant main effect of PI, F(1,48) = 35.19, p < .0001,
η2p= .394, suggesting that A was higher in the unique condition (M = .80, SD = .11)
than in the repeated condition (M = .68, SD = .15). The main effect of Picture
Duration was significant, F(1,48) = 28.59, p <.0001, η2
p= .312, suggesting that A was
higher in the slow condition (M = .80, SD = .15) than in the fast condition (M = .69,
SD = .11). We also observed a significant main effect of Suppression, F(1,48) = 8.07,
p= .007, η2
p= .088, reflecting that, overall, discrimination was better without
suppression (M = .78, SD = .12) than with suppression (M = .71, SD = .15).
We found a marginal interaction between Picture Duration and Suppression,
F(1,48) = 3.35, p = .073,ηp2 = .037. The triple interaction between PI, PI Order and
Suppression was marginal as well, F(1,48) = 3.02, p = .089, ηp2 = .034.
Given the results obtained for the percentage of correct responses above, the
marginal interaction between Picture Duration and Suppression was followed up by
separate ANOVAs for the fast and the slow condition, respectively. The interactions
indicate that the effect of Suppression is only significant for the slow condition,
F(1,24) = 8.68, p = .007, η2
p = .25, but not in the fast condition, F(1,24) = .69, p = .42,
η2
p = .027. The effect of PI was significant for both presentation speeds (slow condition:
F(1,24) = 17.84, p = .0003, η2
p = .389; fast condition: F(1,24) = 18.05, p = .0003, η2p =
.423).
However, when applying the Holm-Bonferroni correction to the α level, the only
effects to reach significance are the main effect of PI (pcorrected <.0001 for the overall
ANOVA; pcorrected < .001 for the follow-up ANOVAs), of Picture Duration
(pcorrected <.0001), and of Suppression (pcorrected = .007 for the overall ANOVA and
percentage of correct responses: PI, faster presentation rates and articulatory
suppression all impair sensitivity, though the effect of suppression was specific to slow
presentation rates.
We analyzed b using the same ANOVA as above. A main effect of PI, F(1,48) =
17.86, p = .0001,η2
p = .258, suggests thatb was higher in the unique condition (M =
1.32, SD = .63) than in the repeated condition (M = .87, SD = .45). In other words,
the criterion for accepting items as “old” was more stringent in the unique condition
than in the repeated condition. The main effect for Picture Duration, F(1,48) = 4.40,
p = .041, η2
p = .072, suggests b was higher in the slow condition (M = 1.20, SD = .68)
than in the fast condition (M = .99, SD = .46). Finally, the main effect of PI Order,
F(1,48) = 5.99, p = 0.018, η2
p = 0.098, suggests that b was larger when participants
started with the repeated condition (M = 1.21, SD = .68) compared to when they
started with the unique condition (M = .97, SD = .46).
The analyses of b largely mirror those of the false alarm rate, except for the main
effect of PI order: PI and faster presentation rates (as well as starting with the unique
condition) lead to more liberal criteria.
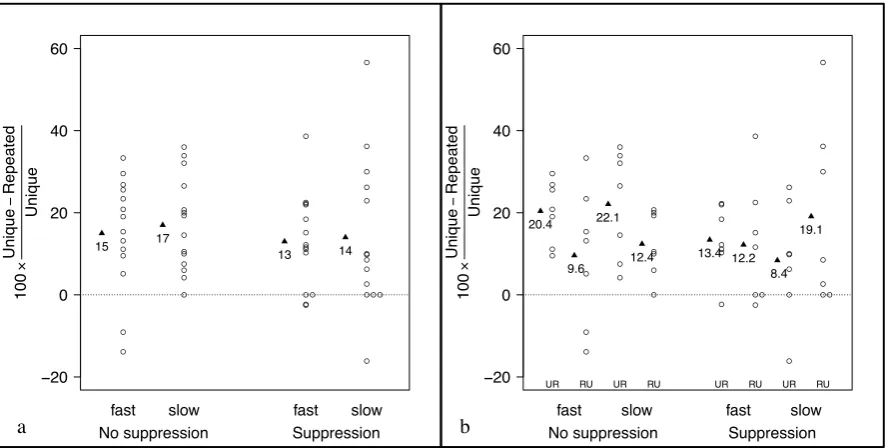
Cost of Proactive Interference
We next analyzed the cost of PI, using performance in the unique condition as a
baseline (see Figure 3). Specifically, we computed the difference between performance in
the unique and the repeated condition, and divided this difference by the performance
in the unique condition.
Visual inspection of Figure 3(a) reveals that the cost of PI is remarkably constant
across conditions: Performance in the repeated condition is always about 15% lower
than in the unique condition. We first analyzed the cost of PI in an ANOVA with the
between-subject factors Picture Duration, PI Order, and Suppression as well as all
interactions. Only the interaction between PI Order and Suppression was marginal,
F(1,48) = 4.0, p = .051, η2 = .073. In the no suppression condition, the cost of PI was
η2 = .172, but there was no difference between the condition orders in the suppression
condition, F(1,24) = .64, p = .431,η2 = .025. However, none of these effects survived
when the α level was adjusted using the Holm-Bonferroni method. Mixed model
analyses yielded similar results (see Appendix B).
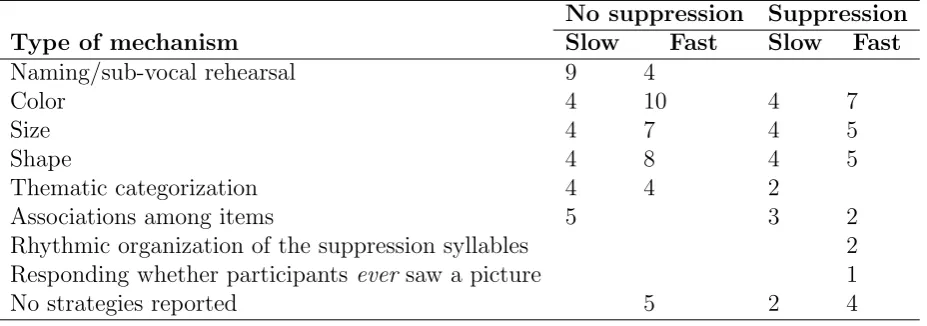
Debriefing questionnaire
To analyze the strategies participants believed to have followed, they were given
debriefing questionnaires where they were asked to mention any strategies they might
have followed. These questionnaires were analyzed informally by looking for recurring
keywords (e.g., “I repeated the words”, “I looked at the color and shape of the picture”
and so forth). This analysis revealed 8 distinct strategies, in addition to some
participants reporting that they did not use any particular strategy. These strategies
were related to (sub-vocal) rehearsal, trying to identify matches between the sample
images and the test image in terms of color, size or shape of the objects, categorizing
them in terms of particular themes (e.g., furniture, animal, decorative object etc.),
creating associations between the different sample pictures, and creating a rhythm with
the non-sense syllables so that one of the three suppression syllables carried stress,
which apparently made the suppression task subjectively less interfering at least for
some participants.
We note that it is not always clear what the participants might have meant, nor
do all the answers make sense (e.g., all images had exactly the same size, and the
latency of picture naming is just too slow for participants being able to name pictures
at 250 ms per picture; e.g., Potter & Faulconer, 1975). Be that as it might, Table 1
presents a tally of the strategies reported by the participants. The main interpretable
result was that participants attempted less to rehearse pictures under verbal
suppression than without verbal suppression.
Within the fast condition however, the majority of participants either did not use
any strategies or simply attended to the general visual appearance of the pictures (i.e.
conceptual short-term memory suggest that participants clearly encode more abstract,
conceptual information about the items as well (e.g., Endress & Potter, 2012; Potter,
1975; Potter et al., 2004).
General Discussion
Proactive Interference (PI) is known to limit memory performance over time scales
from seconds to years. More controversially, it might also be at the root of the capacity
limitations typically observed in (visual) WM. However, even when remembering items
over brief periods of time, memory is unlikely to be a unitary phenomenon, and draws
on visual, conceptual, linguistic, and attentional processes, among others. In the present
research, we start investigating the effects of PI while selectively manipulating some of
these contributions. Specifically, we investigated the effects of PI as a function of the
availability of verbal processes and of LTM, by manipulating the presence of an
articulatory suppression task (that should affect the availability of verbal resources),
and by manipulating the presentation speed of the pictures (that should affect the
availability of LTM).2
We made several important observations. First, and as expected, participants
performed better in a situation with less PI, and they performed better when items
were presented more slowly. Second, verbal suppression seems to affect performance
only for slow presentation rates (though this effect was not significant after
Holm-Bonferroni correction), but not for fast presentations, even though participants
are perfectly capable of extracting conceptual information at these presentation rates
2Interestingly, our presentation speed manipulation might be related to a prominent phenomenon in
(e.g., Potter, 1975; Potter et al., 2004). This supports the view that conceptual and
linguistic information can be processed through different channels even very early on in
processing (Endress & Potter, 2012).
Third, the cost of PI might have been slightly higher when participants started
with unique rather than the repeated condition; if this effect is reliable, it might be
because, when participants start with the unique condition, the inherent PI in the
repeated condition will be combined with the cumulative PI from the unique condition,
which might simply be due to the fact of having seen many pictures before.
Alternatively, participants might be more vigilant when starting with the more difficult
repeated condition.3 In line with the latter view, participants adopted a somewhat more
conservative criterion when starting with the repeated condition.
Fourth, in the current experiments, the effect of PI seems to be carried more by
the false alarm rate than the hit rate, which did not differ across the experimental
conditions. However, in Endress and Potter’s (2014a), the contributions of the hit rate
and the false alarm rate depended on the experiment. As a result, the main effects of PI
thus seem to be variable in the current paradigm, perhaps because participants can
develop different biases that are optimal in different experiments.
Fifth, and crucially, the cost of PI was relatively constant at about 15% of the
performance in the unique condition, across presentation conditions. The cost of PI
thus seems to be remarkably insensitive to items variations in the presentation
conditions, and seems mainly to depend on the relative memory strength or the relative
recency of the target items compared to the interfering items.
These results raise important questions about the mechanisms (if any) that
counteract PI. Indeed, these mechanisms are generally believed to be active and
effortful (e.g., Braver et al., 2008; Kane & Engle, 2000). However, while WM items are
3When the experiments starts with the unique condition, participants can initially endorse pictures
assumed to be maintained by active and effortful processes as well (e.g., Baddeley &
Hitch, 1974; Conway & Engle, 1994; Cowan, 2005; Kane, Poole, Tuholski, & Engle,
2006; Poole & Kane, 2009), the involvement of active and effortful processes is
questionable in some experiments, because the presentation rate appears too fast for the
deployment of active and effortful processes (e.g., in Endress and Potter’s (2014a) and
Luck and Vogel’s (1997) experiments), and because some WM tasks show only very
limited interactions with active attentional tasks (e.g., Fougnie & Marois, 2006;
H. Zhang, Xuan, Fu, & Pylyshyn, 2010). The present results do not clarify this issue
either. On the one hand, slowing down the presentation should be beneficial for dealing
with PI if the mechanisms counteracting PI are active; after all, it is easier to attend to
items that are presented more slowly. On the other hand, if PI just happens with few
active mechanisms counteracting it, then the cost of PI should be more important when
the presentation rate is slowed down; after all, items that are presented more slowly are
memorized better, and should thus interfere more as well, and the two effects might well
cancel out.4 As a result, it is an important question to find out whether the remarkable
constancy of the cost of PI is a largely inevitable consequence of the relative strength of
the target memory items and the interfering items, or if the (active) mechanisms
counteracting PI have some fundamental limit beyond which they cannot protect
memory from the detrimental effects of PI.
4If PI is due to the distinctiveness of the memory trace (e.g., Brown, Neath, & Chater, 2007; Unsworth,
References
Alvarez, G. A., & Cavanagh, P. (2004, Feb). The capacity of visual short-term memory
is set both by visual information load and by number of objects. Psychol Sci,
15(2), 106–111.
Awh, E., Barton, B., & Vogel, E. K. (2007, Jul). Visual working memory represents a
fixed number of items regardless of complexity. Psychol Sci, 18(7), 622–628.
Retrieved fromhttp://dx.doi.org/10.1111/j.1467-9280.2007.01949.x doi:
10.1111/j.1467-9280.2007.01949.x
Baayen, R., Davidson, D., & Bates, D. (2008). Mixed-effects modeling with crossed
random effects for subjects and items. Journal of Memory and Language, 59(4),
390 - 412. doi: 10.1016/j.jml.2007.12.005
Baddeley, A. D. (1966, Nov). The influence of acoustic and semantic similarity on
long-term memory for word sequences. Q J Exp Psychol, 18(4), 302–309.
Retrieved fromhttp://dx.doi.org/10.1080/14640746608400047 doi:
10.1080/14640746608400047
Baddeley, A. D. (1996, Nov). The fractionation of working memory. Proc Natl Acad Sci
U S A, 93(24), 13468-72.
Baddeley, A. D. (2003, Oct). Working memory: looking back and looking forward. Nat
Rev Neurosci, 4(10), 829–839. Retrieved from
http://dx.doi.org/10.1038/nrn1201 doi: 10.1038/nrn1201
Baddeley, A. D., & Hitch, G. (1974). Working memory. In G. Bower (Ed.), The
psychology of learning and motivation: Advances in research and theory. (Vol.
VIII, p. 47-90). New York: Academic Press.
Baddeley, A. D., & Scott, D. (1971). Short term forgetting in absence of proactive
interference. Q J Exp Psychol, 23, 275-283.
Banta Lavenex, P., Boujon, V., Ndarugendamwo, A., & Lavenex, P. (2015, Mar).
Human short-term spatial memory: precision predicts capacity. Cogn Psychol, 77,
1–19. Retrieved from http://dx.doi.org/10.1016/j.cogpsych.2015.02.001
Bays, P. M., Catalao, R. F. G., & Husain, M. (2009). The precision of visual working
memory is set by allocation of a shared resource. J Vis, 9(10), 7.1–711. Retrieved
fromhttp://dx.doi.org/10.1167/9.10.7 doi: 10.1167/9.10.7
Bays, P. M., & Husain, M. (2008, Aug). Dynamic shifts of limited working memory
resources in human vision. Science, 321(5890), 851–854. Retrieved from
http://dx.doi.org/10.1126/science.1158023 doi: 10.1126/science.1158023
Berman, M. G., Jonides, J., & Lewis, R. L. (2009, Mar). In search of decay in verbal
short-term memory. J Exp Psychol Learn Mem Cogn, 35(2), 317-33. Retrieved
fromhttp://dx.doi.org/10.1037/a0014873 doi: 10.1037/a0014873
Brady, T. F., Konkle, T., Alvarez, G. A., & Oliva, A. (2008, Sep). Visual long-term
memory has a massive storage capacity for object details. Proc Natl Acad Sci U S
A, 105(38), 14325–14329. doi: 10.1073/pnas.0803390105
Brainard, D. (1997). The psychophysics toolbox. Spat Vis, 10(4), 433–436.
Braver, T., Gray, J., & Burgess, G. (2008). Explaining the many varieties of working
memory variation: Dual mechanisms of cognitive control. In A. Conway,
C. Jarrold, M. Kane, A. Miyake, & J. N. Towse (Eds.), Variation in working
memory (pp. 76–106). New York, NY: Oxford University Press.
Brown, G. D. A., Neath, I., & Chater, N. (2007, Jul). A temporal ratio model of
memory. Psychol Rev, 114(3), 539–576. Retrieved from
http://dx.doi.org/10.1037/0033-295X.114.3.539 doi:
10.1037/0033-295X.114.3.539
Burgess, G. C., Gray, J. R., Conway, A. R. A., & Braver, T. S. (2011, Nov). Neural
mechanisms of interference control underlie the relationship between fluid
intelligence and working memory span. J Exp Psychol Gen, 140(4), 674–692.
Retrieved fromhttp://dx.doi.org/10.1037/a0024695 doi: 10.1037/a0024695
Conway, A. R., & Engle, R. W. (1994, Dec). Working memory and retrieval: a
resource-dependent inhibition model. J Exp Psychol Gen, 123(4), 354–373.
Conway, A. R., Kane, M. J., & Engle, R. W. (2003). Working memory capacity and its
10.1016/j.tics.2003.10.005
Cowan, N. (1995). Attention and memory: An integrated framework. Oxford, UK:
Oxford University Press.
Cowan, N. (2001, Feb). The magical number 4 in short-term memory: a reconsideration
of mental storage capacity. Behav Brain Sci, 24(1), 87–114.
Cowan, N. (2005). Working memory capacity. Hove, UK: Psychology Press.
Cowan, N., Johnson, T. D., & Saults, J. S. (2005). Capacity limits in list item
recognition: evidence from proactive interference. Memory, 13(3-4), 293–299.
da Costa Pinto, A., & Baddeley, A. D. (1991). Where did you park your car? analysis
of a naturalistic long-term recency effect. European Journal of Cognitive
Psychology, 3(3), 297-313. doi: 10.1080/09541449108406231
Deese, J. (1959, Jul). On the prediction of occurrence of particular verbal intrusions in
immediate recall. J Exp Psychol, 58(1), 17–22.
Endress, A. D., & Potter, M. C. (2012). Early conceptual and linguistic processes
operate in independent channels. Psychol Sci, 23(3), 235–245. doi:
10.1177/0956797611421485
Endress, A. D., & Potter, M. C. (2014a). Large capacity temporary visual memory. J
Exp Psychol Gen, 143(2), 548–65.
Endress, A. D., & Potter, M. C. (2014b). Something from (almost) nothing: Buildup of
object memory from forgettable single fixations. Atten Percept Psychophys, 76(8),
2413–2423.
Engle, R. W. (2002). Working memory capacity as executive attention. Curr Dir
Psychol Sci, 11(1), 19-23. doi: 10.1111/1467-8721.00160
Engle, R. W., Tuholski, S. W., Laughlin, J. E., & Conway, A. R. (1999, Sep). Working
memory, short-term memory, and general fluid intelligence: a latent-variable
approach. J Exp Psychol Gen, 128(3), 309–331.
Ericsson, K. A., & Kintsch, W. (1995, Apr). Long-term working memory. Psychol Rev,
102(2), 211–245.
memory capacity. Proc Natl Acad Sci U S A, 105(29), 9926–9930. Retrieved from
http://dx.doi.org/10.1073/pnas.0709884105 doi: 10.1073/pnas.0709884105
Fougnie, D., & Marois, R. (2006, Jun). Distinct capacity limits for attention and
working memory: Evidence from attentive tracking and visual working memory
paradigms. Psychol Sci, 17(6), 526–534. doi: 10.1111/j.1467-9280.2006.01739.x
Fukuda, K., Vogel, E., Mayr, U., & Awh, E. (2010, Oct). Quantity, not quality: the
relationship between fluid intelligence and working memory capacity. Psychon
Bull Rev, 17(5), 673–679. Retrieved from
http://dx.doi.org/10.3758/17.5.673 doi: 10.3758/17.5.673
Gallo, D. A., Kensinger, E. A., & Schacter, D. L. (2006, Jan). Prefrontal activity and
diagnostic monitoring of memory retrieval: Fmri of the criterial recollection task.
J Cogn Neurosci, 18(1), 135–148. Retrieved from
http://dx.doi.org/10.1162/089892906775250049 doi:
10.1162/089892906775250049
Gallo, D. A., Perlmutter, D. H., Moore, C. D., & Schacrer, D. L. (2008, Mar).
Distinctive encoding reduces the jacoby-whitehouse illusion. Mem Cognit, 36(2),
461–466.
Gallo, D. A., Weiss, J. A., & Schacter, D. L. (2004). Reducing false recognition with
criterial recollection tests: Distinctiveness heuristic versus criterion shifts. Journal
of Memory and Language, 51(3), 473 - 493. Retrieved from
http://www.sciencedirect.com/science/article/pii/S0749596X04000634
doi: http://dx.doi.org/10.1016/j.jml.2004.06.002
Glover, S., & Dixon, P. (2004, Oct). Likelihood ratios: a simple and flexible statistic for
empirical psychologists. Psychon Bull Rev, 11(5), 791–806.
Gray, J. R., Chabris, C. F., & Braver, T. S. (2003, Mar). Neural mechanisms of general
fluid intelligence. Nat Neurosci, 6(3), 316–322. Retrieved from
http://dx.doi.org/10.1038/nn1014 doi: 10.1038/nn1014
Hartshorne, J. K. (2008). Visual working memory capacity and proactive interference.
http://dx.doi.org/10.1371/journal.pone.0002716 doi:
10.1371/journal.pone.0002716
Hasselmo, M. E., & Stern, C. E. (2006, Nov). Mechanisms underlying working memory
for novel information. Trends Cogn Sci, 10(11), 487–493. Retrieved from
http://dx.doi.org/10.1016/j.tics.2006.09.005 doi:
10.1016/j.tics.2006.09.005
Israel, L., & Schacter, D. L. (1997). Pictorial encoding reduces false recognition of
semantic associates. Psychonomic Bulletin & Review, 4(4), 577–581. doi:
10.3758/BF03214352
Kane, M. J., & Engle, R. W. (2000). Working-memory capacity, proactive interference,
and divided attention: Limits on long-term memory retrieval. J Exp Psychol
Learn Mem Cogn, 26(2), 336-358.
Kane, M. J., & Engle, R. W. (2003, Mar). Working-memory capacity and the control of
attention: the contributions of goal neglect, response competition, and task set to
stroop interference. J Exp Psychol Gen, 132(1), 47–70.
Kane, M. J., Hambrick, D. Z., Tuholski, S. W., Wilhelm, O., Payne, T. W., & Engle,
R. W. (2004, Jun). The generality of working memory capacity: a latent-variable
approach to verbal and visuospatial memory span and reasoning. J Exp Psychol
Gen, 133(2), 189–217. Retrieved from
http://dx.doi.org/10.1037/0096-3445.133.2.189 doi:
10.1037/0096-3445.133.2.189
Kane, M. J., Poole, B. J., Tuholski, S. W., & Engle, R. W. (2006, Jul). Working
memory capacity and the top-down control of visual search: Exploring the
boundaries of ”executive attention”. J Exp Psychol Learn Mem Cogn, 32(4),
749–777. Retrieved fromhttp://dx.doi.org/10.1037/0278-7393.32.4.749
doi: 10.1037/0278-7393.32.4.749
Keppel, G., & Underwood, B. J. (1962). Proactive inhibition in short-term retention of
single items. Journal of Verbal Learning and Verbal Behavior, 1(3), 153 - 161.
http://www.sciencedirect.com/science/article/pii/S0022537162800231
doi: 10.1016/S0022-5371(62)80023-1
Kibbe, M. M., & Feigenson, L. (2014, Dec). Developmental origins of recoding and
decoding in memory. Cogn Psychol, 75, 55–79. Retrieved from
http://dx.doi.org/10.1016/j.cogpsych.2014.08.001 doi:
10.1016/j.cogpsych.2014.08.001
Kincaid, J. P., & Wickens, D. D. (1970). Temporal gradient of release from proactive
inhibition. J Exp Psychol, 86(2), 313 - 316.
Lewandowsky, S., Oberauer, K., & Brown, G. D. A. (2009, Mar). No temporal decay in
verbal short-term memory. Trends Cogn Sci, 13(3), 120–126. Retrieved from
http://dx.doi.org/10.1016/j.tics.2008.12.003 doi:
10.1016/j.tics.2008.12.003
Lin, P.-H., & Luck, S. J. (2012). Proactive interference does not meaningfully distort
visual working memory capacity estimates in the canonical change detection task.
Front Psychol, 3, 42. Retrieved from
http://dx.doi.org/10.3389/fpsyg.2012.00042 doi: 10.3389/fpsyg.2012.00042
Luck, S. J., & Vogel, E. K. (1997, Nov). The capacity of visual working memory for
features and conjunctions. Nature, 390(6657), 279–281. Retrieved from
http://dx.doi.org/10.1038/36846 doi: 10.1038/36846
Lustig, C., May, C. P., & Hasher, L. (2001, Jun). Working memory span and the role of
proactive interference. J Exp Psychol Gen, 130(2), 199–207.
Macmillan, N. A., & Creelman, C. D. (1996, Jun). Triangles in roc space: History and
theory of ”nonparametric” measures of sensitivity and response bias. Psychon Bull
Rev, 3(2), 164–170. doi: 10.3758/BF03212415
Makovski, T., & Jiang, Y. V. (2008, Jan). Proactive interference from items previously
stored in visual working memory. Mem Cognit, 36(1), 43–52.
May, C. P., Hasher, L., & Kane, M. J. (1999, Sep). The role of interference in memory
Mickes, L., Wixted, J. T., & Wais, P. E. (2007, Oct). A direct test of the
unequal-variance signal detection model of recognition memory. Psychon Bull
Rev, 14(5), 858–865.
Miller, G. A. (1956). The magical number seven, plus or minus two: Some limits on our
capacity for processing information. Psychol Rev, 63(2), 81–97.
Oberauer, K., Lewandowsky, S., Farrell, S., Jarrold, C., & Greaves, M. (2012, Oct).
Modeling working memory: an interference model of complex span. Psychon Bull
Rev, 19(5), 779–819. Retrieved from
http://dx.doi.org/10.3758/s13423-012-0272-4 doi:
10.3758/s13423-012-0272-4
Olsson, H., & Poom, L. (2005, Jun). Visual memory needs categories. Proc Natl Acad
Sci U S A, 102(24), 8776-80. Retrieved from
http://dx.doi.org/10.1073/pnas.0500810102 doi: 10.1073/pnas.0500810102
Pelli, D. G. (1997). The VideoToolbox software for visual psychophysics: transforming
numbers into movies. Spat Vis, 10(4), 437-42.
Poole, B. J., & Kane, M. J. (2009, Jul). Working-memory capacity predicts the
executive control of visual search among distractors: the influences of sustained
and selective attention. Q J Exp Psychol (Colchester), 62(7), 1430–1454.
Retrieved fromhttp://dx.doi.org/10.1080/17470210802479329 doi:
10.1080/17470210802479329
Potter, M. C. (1975, Mar). Meaning in visual search. Science, 187(4180), 965-6.
Potter, M. C. (1976, Sep). Short-term conceptual memory for pictures. J Exp Psychol
Hum Learn, 2(5), 509-22.
Potter, M. C. (1993, Mar). Very short-term conceptual memory. Mem Cognit, 21(2),
156-61.
Potter, M. C., & Faulconer, B. A. (1975, Feb). Time to understand pictures and words.
Nature, 253(5491), 437–438.
Potter, M. C., Kroll, J. F., Yachzel, B., Carpenter, E., & Sherman, J. (1986, Sep).
281–294.
Potter, M. C., Staub, A., & O’Connor, D. H. (2004, Jun). Pictorial and conceptual
representation of glimpsed pictures. J Exp Psychol Hum Percept Perform, 30(3),
478-89. Retrieved from http://dx.doi.org/10.1037/0096-1523.30.3.478 doi:
10.1037/0096-1523.30.3.478
Ranganath, C., & Blumenfeld, R. S. (2005, Aug). Doubts about double dissociations
between short- and long-term memory. Trends Cogn Sci, 9(8), 374–380. Retrieved
fromhttp://dx.doi.org/10.1016/j.tics.2005.06.009 doi:
10.1016/j.tics.2005.06.009
Ranganath, C., & D’Esposito, M. (2001, Sep). Medial temporal lobe activity associated
with active maintenance of novel information. Neuron, 31(5), 865–873.
Ranganath, C., & Rainer, G. (2003, Mar). Neural mechanisms for detecting and
remembering novel events. Nat Rev Neurosci, 4(3), 193–202. Retrieved from
http://dx.doi.org/10.1038/nrn1052 doi: 10.1038/nrn1052
Ratcliff, R., Sheu, C. F., & Gronlund, S. D. (1992, Jul). Testing global memory models
using roc curves. Psychol Rev, 99(3), 518–535.
Roediger, H. L., & McDermott, K. B. (1995). Creating false memories: Remembering
words not presented in lists. Journal of experimental psychology: Learning,
Memory, and Cognition, 21(4), 803-814.
Rosen, V. M., & Engle, R. W. (1998). Working memory capacity and suppression,. J
Mem Lang, 39(3), 418 - 436. doi: 10.1006/jmla.1998.2590
Rosenberg, R. D., & Feigenson, L. (2013, Jul). Infants hierarchically organize memory
representations. Dev Sci, 16(4), 610–621. Retrieved from
http://dx.doi.org/10.1111/desc.12055 doi: 10.1111/desc.12055
Rouder, J. N., Morey, R. D., Cowan, N., Zwilling, C. E., Morey, C. C., & Pratte, M. S.
(2008, Apr). An assessment of fixed-capacity models of visual working memory.
Proc Natl Acad Sci U S A, 105(16), 5975–5979. doi: 10.1073/pnas.0711295105
Rouder, J. N., Pratte, M. S., & Morey, R. D. (2010, Jun). Latent mnemonic strengths
17(3), 427–435. Retrieved from http://dx.doi.org/10.3758/PBR.17.3.427
doi: 10.3758/PBR.17.3.427
Stern, C. E., Sherman, S. J., Kirchhoff, B. A., & Hasselmo, M. E. (2001). Medial
temporal and prefrontal contributions to working memory tasks with novel and
familiar stimuli. Hippocampus, 11(4), 337–346. Retrieved from
http://dx.doi.org/10.1002/hipo.1048 doi: 10.1002/hipo.1048
Unsworth, N., Heitz, R. P., & Parks, N. A. (2008, Nov). The importance of temporal
distinctiveness for forgetting over the short term. Psychol Sci, 19(11), 1078–1081.
Retrieved fromhttp://dx.doi.org/10.1111/j.1467-9280.2008.02203.x doi:
10.1111/j.1467-9280.2008.02203.x
van den Berg, R., Shin, H., Chou, W.-C., George, R., & Ma, W. J. (2012). Variability
in encoding precision accounts for visual short-term memory limitations.
Proceedings of the National Academy of Sciences, 109(22), 8780–8785. doi:
10.1073/pnas.1117465109
Wickens, D. D., Born, D. G., & Allen, C. K. (1963). Proactive inhibition and item
similarity in short-term memory. Journal of Verbal Learning and Verbal Behavior,
2(5–6), 440–445. Retrieved from
http://www.sciencedirect.com/science/article/pii/S0022537163800456
doi: 10.1016/S0022-5371(63)80045-6
Wong, J. H., Peterson, M. S., & Thompson, J. C. (2008, Sep). Visual working memory
capacity for objects from different categories: A face-specific maintenance effect.
Cognition, 108(3), 719-31. Retrieved from
http://dx.doi.org/10.1016/j.cognition.2008.06.006 doi:
10.1016/j.cognition.2008.06.006
Wood, J. N. (2008, Aug). Visual memory for agents and their actions. Cognition,
108(2), 522-32. Retrieved from
http://dx.doi.org/10.1016/j.cognition.2008.02.012 doi:
10.1016/j.cognition.2008.02.012
compete with objects in perception? Visual Cognition, 18(4), 617-640. doi:
10.1080/13506280903211142
Zhang, J., & Mueller, S. T. (2005). A note on roc analysis and non-parametric estimate
of sensitivity. Psychometrika, 70(1), 203–212. doi: 10.1007/s11336-003-1119-8
Zhang, W., & Luck, S. J. (2008, May). Discrete fixed-resolution representations in
Table 1
Tally of memory strategies reported by the participants. The numbers represent counts, and thus do not sum to the total number of participants.
No suppression Suppression
Type of mechanism Slow Fast Slow Fast
Naming/sub-vocal rehearsal 9 4
Color 4 10 4 7
Size 4 7 4 5
Shape 4 8 4 5
Thematic categorization 4 4 2
Associations among items 5 3 2
Rhythmic organization of the suppression syllables 2
Responding whether participants eversaw a picture 1
0 20 40 60 80 100 % Correct ● ● ● ● ● ● ● ● ● ● ● ● ● ● ● ● ● ● ● ● ● ● ● ● ● ● ● ● ● ● ● ● ● ● ● ● ● ● ● ● ● ● ● ● ● ● ● ● ● ● ● ● ● ● ● ● ● ● ● ● ● ● ● ● ● ● ● ● ● ● ● ● ● ● ● ● ● ● ● ● ● ● ● ● ● ● ● ● ● ● ● ● ● ● ● ● ● ● ● ● ● ● ● ● ● ● ● ● ● ● ● ●
No suppression Suppression
R U R U R U R U
fast slow fast slow 57 68 71 86 57 66 64 76 0.0 0.2 0.4 0.6 0.8 1.0 Hit r ate ● ● ● ● ● ● ● ● ● ● ● ● ● ● ● ● ● ● ● ● ● ● ● ● ● ● ● ● ● ● ● ● ● ● ● ● ● ● ● ● ● ● ● ● ● ● ● ● ● ● ● ● ● ● ● ● ● ● ● ● ● ● ● ● ● ● ● ● ● ● ● ● ● ● ● ● ● ● ● ● ● ● ● ● ● ● ● ● ● ● ● ● ● ● ● ● ● ● ● ● ● ● ● ● ● ● ● ● ● ● ● ●
No suppression Suppression
R U R U R U R U
fast slow fast slow
0.73 0.66 0.80 0.81 0.73 0.68 0.73 0.68 0.0 0.2 0.4 0.6 0.8 1.0 F alse alar m r ate ● ● ● ● ● ● ● ● ● ● ● ● ● ● ● ● ● ● ● ● ● ● ● ● ● ● ● ● ● ● ● ● ● ● ● ● ● ● ● ● ● ● ● ● ● ● ● ● ● ● ● ● ● ● ● ● ● ● ● ● ● ● ● ● ● ● ● ● ● ● ● ● ● ● ● ● ● ● ● ● ● ● ● ● ● ● ● ● ● ● ● ● ● ● ● ● ● ● ● ● ● ● ● ● ● ● ● ● ● ● ● ●
No suppression Suppression
R U R U R U R U
fast slow fast slow
0.583 0.293 0.386 0.086 0.590 0.360 0.450 0.169
[image:32.595.76.522.77.227.2]a b c
Figure 1. Results in terms of (a) the percentage of correct responses, (b) the hit rate,
a b 0.0 0.2 0.4 0.6 0.8 1.0
A (after Zhang & Mueller)
● ● ● ● ● ● ● ● ● ● ● ● ● ● ● ● ● ● ● ● ● ● ● ● ● ● ● ● ● ● ● ● ● ● ● ● ● ● ● ● ● ● ● ● ● ● ● ● ● ● ● ● ● ● ● ● ● ● ● ● ● ● ● ● ● ● ● ● ● ● ● ● ● ● ● ● ● ● ● ● ● ● ● ● ● ● ● ● ● ● ● ● ● ● ● ● ● ● ● ● ● ● ● ● ● ● ● ● ● ● ● ●
No suppression Suppression
R U R U R U R U
fast slow fast slow
0.64 0.75 0.79 0.91 0.63 0.72 0.67 0.83 0 1 2 3 4
b (after Zhang & Mueller)
● ● ● ● ● ● ● ● ● ● ● ● ● ● ● ● ● ● ● ● ● ● ● ● ● ● ● ● ● ● ● ● ● ● ● ● ● ● ● ● ● ● ● ● ● ● ● ● ● ● ● ● ● ● ● ● ● ● ● ● ● ● ● ● ● ● ● ● ● ● ● ● ● ● ● ● ● ● ● ● ● ● ● ● ● ● ● ● ● ● ● ● ● ● ● ● ● ● ● ● ● ● ● ● ● ● ● ● ● ● ● ●
No suppression Suppression
R U R U R U R U
fast slow fast slow
[image:33.595.73.524.74.301.2]0.88 1.22 0.84 1.41 0.81 1.04 0.94 1.60
Figure 2. Signal detection theory analyses. (a) Discriminability (A) and (b) bias (b).
−20 0 20 40 60 100 × U n iq u e − R e p e a te d U n iq u e ● ● ● ● ● ● ● ● ● ● ● ● ● ● ● ● ● ● ● ● ● ● ● ● ● ● ● ● ● ● ● ● ● ● ● ● ● ● ● ● ● ● ● ● ● ● ● ● ● ● ● ● ● ● ● ●
No suppression Suppression
UR RU UR RU UR RU UR RU
fast slow fast slow
20.4
9.6 22.1
12.4 13.4 12.2 8.4 19.1 −20 0 20 40 60 100 × U n iq u e − R e p e a te d U n iq u e ● ● ● ● ● ● ● ● ● ● ● ● ● ● ● ● ● ● ● ● ● ● ● ● ● ● ● ● ● ● ● ● ● ● ● ● ● ● ● ● ● ● ● ● ● ● ● ● ● ● ● ● ● ● ● ●
No suppression Suppression fast slow fast slow
15 17
13 14
[image:34.595.77.521.77.301.2]a b
Figure 3. (a) Cost of PI as a function of the factors Presentation Duration and
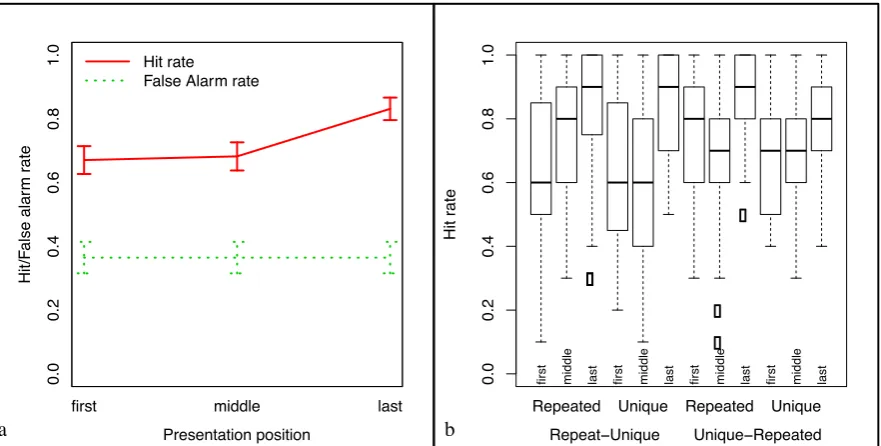
Appendix A
Serial Position Effects
For “yes” trials, we analyzed the Serial Position effect by collapsing across all other
conditions. As shown in Figure B1, there was a recency effect for the last items. While
performance did not differ between the initial (M = 67.05%, SD = 16.34%) and the
middle positions (M = 68.21%, SD = 16.55%), performance was significantly better for
items from the final positions (M = 83.13%, SD = 13.16%) than for items from the
initial positions, t(55) = 6.69, p <.0001, Cohen’s d = .89, CI.95 = [11.26, 20.89], or the
middle position, t(55) = 6.72, p <.0001, Cohen’s d = .9, CI.95 = [10.46, 19.36]. (The
confidence intervals refer to the confidence intervals for the difference; these differences
Appendix B
Analyses with generalized linear mixed models
Percentage of correct responses
We analyzed the data also using a generalized linear mixed-effects model. The
initial model comprised the fixed factors PI, PI Order, Picture Duration and
Suppression and their interactions as well as a random intercept for participants and
random slopes and intercepts for gender, age, and whether or not participants had more
than one native language. We then pruned the model to those factors that contributed
to the model likelihood (see Baayen, Davidson, & Bates, 2008). The final model
comprised only the predictors PI, Picture Duration and Suppression (but not PI Order),
and the interaction between Picture Duration and Suppression. We included only a
random intercept for participants. Significance was assessed by approximating the t
values as Z values.
This model revealed that participants performed better in the unique than in the
repeated condition,β = 11.6, SE = .1.5,CI.95 = [8.6, 14.5], p <.0001, and that they
performed better for slow presentations than for fast presentations, β = 15.8, SE = 2.6,
CI.95 = [10.8, 20.8], p <.0001. (Confidence intervals refer to the estimates.) The effect
of suppression did not reach significance, p = .624. However, the interaction between
Picture Duration and Suppression revealed that the cost of suppression was greater for
slow presentations, β = -7.4, SE = 3.6,CI.95 = [-14.5, -.4], p = .040. Follow-up
analyses with models using PI and Suppression as fixed factors but no interactions
revealed that the effect of Suppression was significant for slow presentations,β = -8.7,
SE = 1.9, CI.95 = [-14.7, -2.7], p = .005, but not for fast presentations,β = -1.3, SE =
1.9, CI.95 = [-4.96, 2.46], p = .509. The effect of PI was highly significant for either
presentation duration, p< .0001.
Hit and false alarm rate
We analyzed the hit rates using a generalized linear mixed model. The initial
vs. middle vs. last), PI Order (Repeated first vs. unique first), Picture Duration (slow
vs. fast), and Suppression (present vs. absent) as well as all interactions. The final
model comprised all the main effects, all 10 double interactions and the triple
interaction between PI, PI Order and Serial Position. We observed an enhancement for
the last positions relative to the first positions (our baseline level in the factor), β =
14.82, SE = 5.63, CI.95 = [3.78, 25.86], p = .009. It also provides an explanation for the
triple interaction. Specifically, hit rates for items from middle positions were somewhat
lower when participants started with the unique condition, β = -13.93, SE = 6.5,
CI.95 = [-26.68, -1.18], p = .032. However, this was modulated by the triple interaction
above, suggesting that this effect was less pronounced in the unique condition, β =
18.21, SE = 9.20, CI.95 = [.19, 36.24], p = .048. Figure B1(b) reveals that this is most
likely due to two outliers in the middle positions of the repeated condition when
participants start with the unique conditions. (Outliers are defined as differing by more
than 1.5 interquartile ranges from the lower quartile.) Visual inspection of the box and
whiskers plot in Figure B1(b) shows that the serial position effects were relatively
similar across conditions. As a result, we will ignore these double and triple interactions.
We analyzed the false alarm rates using a generalized linear mixed model. The
initial model had the random factor Participants and the fixed factors PI, PI Order
(Repeated first vs. unique first), Picture Duration (slow vs. fast), and Suppression
(present vs. absent) as well as all interactions. The final model comprised the main
effects and all 6 double interactions. The model revealed that the false alarm rate was
significantly lower for slow presentations,β = -20.60, SE = 8.02, CI.95 = [-36.32, -4.87],
p = .010, and significantly lower in the unique condition, β = -26.43, SE = 6.23,
CI.95 = [-38.64, -14.22], p < .0001.
Cost of Proactive Interference
We analyzed the cost of PI in a general linear model with the fixed factors Picture
Duration, Suppression and PI Order as well as all interactions and random intercepts
contribute to the model likelihood.
The final model comprised simple predictors for Picture Duration, Suppression
and PI Order, the interaction between Suppression and PI Order, as well as a random
intercept for multilingualism. (All estimates below reflect the cost of PI in percentage of
the performance in the unique condition.) This model revealed that the cost of PI was
slightly higher when starting with the unique condition β = 20.2, SE = 5.2,CI.95 =
[.04, 20.4], p = .049. This effect was modulated by an interaction between Suppression
and PI Order, whose magnitude revealed that almost the entire effect of PI Order was
due to the no suppression condition, β = -15.0, SE = 7.4, CI.95 = [-29.4, -.6], p = .042.
Accordingly, the effect of PI Order was only significant in the no suppression condition,
β = 10.2, SE = 4.5,CI.95 = [1.5, 19.0], p = .022, but not in the suppression condition,
0 .0 0 .2 0 .4 0 .6 0 .8 1 .0 H it r a te fi rs t m id d le la s t fi rs t m id d le la s t fi rs t m id d le la s t fi rs t m id d le la s t
Repeated Unique Repeated Unique
Repeat−Unique Unique−Repeated
a b
first middle last
[image:39.595.81.522.77.300.2]Presentation position 0 .0 0 .2 0 .4 0 .6 0 .8 1 .0 H it/ F a ls e a la rm r a te Hit rate False Alarm rate
Figure B1. (a) Serial position effects collapsed across all conditions. Error bars
represent standard errors from the mean. (b). Serial position effects as a function of the PI Order and the PI. Boxes extend from the lower to the higher quartile. The thick line represents the median, and the whiskers the range of the data points within 1.5