City, University of London Institutional Repository
Citation
:
Dima, D., de Jong, S., Breen, G. & Frangou, S. (2016). The polygenic risk for
bipolar disorder influences brain regional function relating to visual and default state
processing of emotional information. NeuroImage: Clinical, 12, pp. 838-844. doi:
10.1016/j.nicl.2016.10.022
This is the published version of the paper.
This version of the publication may differ from the final published
version.
Permanent repository link:
http://openaccess.city.ac.uk/15942/
Link to published version
:
http://dx.doi.org/10.1016/j.nicl.2016.10.022
Copyright and reuse:
City Research Online aims to make research
outputs of City, University of London available to a wider audience.
Copyright and Moral Rights remain with the author(s) and/or copyright
holders. URLs from City Research Online may be freely distributed and
linked to.
The polygenic risk for bipolar disorder in
fl
uences brain regional function
relating to visual and default state processing of emotional information
Danai Dima
a,b,c,⁎
, Simone de Jong
c,d, Gerome Breen
c,d, Sophia Frangou
ea
Department of Psychology, School of Arts and Social Sciences, City, University of London, London, UK bDepartment of Neuroimaging, Institute of Psychiatry, Psychology and Neuroscience, King's College London, UK c
NIHR BRC for Mental Health, Institute of Psychiatry, Psychology and Neuroscience, King's College London and SLaM NHS Trust, London, UK d
MRC Social, Genetic & Developmental Psychiatry Centre, Institute of Psychiatry, Psychology and Neuroscience, King's College London, London, UK e
Department of Psychiatry, Icahn School of Medicine at Mount Sinai, USA
a b s t r a c t
a r t i c l e i n f o
Article history:
Received 8 September 2016
Received in revised form 27 October 2016 Accepted 29 October 2016
Available online 01 November 2016
Genome-wise association studies have identified a number of common single-nucleotide polymorphisms (SNPs), each of small effect, associated with risk to bipolar disorder (BD). Several risk-conferring SNPs have been individually shown to influence regional brain activation thus linking genetic risk for BD to altered brain function. The current study examined whether the polygenic risk score method, which models the cumulative load of all known risk-conferring SNPs, may be useful in the identification of brain regions whose function may be related to the polygenic architecture of BD. We calculated the individual polygenic risk score for BD (PGR-BD) in forty-one patients with the disorder, twenty-five unaffectedfirst-degree relatives and forty-six unrelated healthy controls using the most recent Psychiatric Genomics Consortium data. Functional magnetic resonance imaging was used to define task-related brain activation patterns in response to facial affect and working mem-ory processing. We found significant effects of the PGR-BD score on task-related activation irrespective of diag-nostic group. There was a negative association between the PGR-BD score and activation in the visual association cortex during facial affect processing. In contrast, the PGR-BD score was associated with failure to de-activate the ventromedial prefrontal region of the default mode network during working memory processing. These results are consistent with the threshold-liability model of BD, and demonstrate the usefulness of the PGR-BD score in identifying brain functional alternations associated with vulnerability to BD. Additionally, our
findings suggest that the polygenic architecture of BD is not regionally confined but impacts on the task-depen-dent recruitment of multiple brain regions.
© 2016 Published by Elsevier Inc. This is an open access article under the CC BY-NC-ND license (http:// creativecommons.org/licenses/by-nc-nd/4.0/).
Keywords:
Bipolar disorder Facial affect fMRI
Polygenic risk score Visual
Working memory
1. Introduction
Bipolar Disorder (BD) is a complex disorder characterized by mood dysregulation resulting in significant psychosocial impairment (van der Voort et al., 2015). Family, twin, adoption and genome-wide associ-ation (GWAS) studies have consistently shown a substantial genetic contribution to disease etiology (Smoller and Finn, 2003; Alsabban et al., 2011) with heritability estimates ranging from 0.6 to 0.8 (Smoller and Finn, 2003; Lichtenstein et al., 2009). It is widely acknowledged that the genetic architecture of the BD is polygenic and consistent with a threshold-liability model (Gottesman and Shields, 1967). Candi-date gene and GWAS genetic studies have identified a number of single-nucleotide polymorphisms (SNPs) that are associated with increased risk for BD (International Schizophrenia Consortium et al., 2009;
Psychiatric GWAS Consortium Bipolar Disorder Working Group, 2011; Green et al., 2013). Individual risk-alleles for BD have been shown to in-fluence brain structure and function in healthy individuals (Kempton et al., 2009; Bigos et al., 2010; Erk et al., 2010; Franke et al., 2010; Krug et al., 2010; Wessa et al., 2010; Heinrich et al., 2013; Paulus et al., 2014), patients with BD (Mechelli et al., 2008; Perrier et al., 2011; Chakirova et al., 2011; Prata et al., 2011; Soeiro-de-Souza et al., 2012; Dima et al., 2013; Tesli et al., 2013) and their unaffected relatives (Lelli-Chiesa et al., 2011; Jogia et al., 2011; Whalley et al., 2012; Erk et al., 2014; Delvecchio et al., 2015). Collectively, these studies have established that risk-variants for BD are linked to brain alterations considered rele-vant to the pathophysiology of the disorder. For example, meta-analyses of functional magnetic resonance imaging (fMRI) studies have consis-tently shown increased activation in the amygdala and decreased acti-vation in the ventrolateral prefrontal cortex (vlPFC) across a number of cognitive tasks in patients with BD compared to healthy controls (Chen et al., 2011; Delvecchio et al., 2013). Similarly, GWAS-supported risk-alleles in the CACNA1C and ANK3 genes, have been independently ⁎ Corresponding author at: Department of Psychology, School of Arts and Social
Sciences, City, University of London, 10 Northampton Square, London EC1V 0HB, UK.
E-mail address:[email protected](D. Dima).
http://dx.doi.org/10.1016/j.nicl.2016.10.022
2213-1582/© 2016 Published by Elsevier Inc. This is an open access article under the CC BY-NC-ND license (http://creativecommons.org/licenses/by-nc-nd/4.0/).
Contents lists available atScienceDirect
NeuroImage: Clinical
associated with increased amygdalar activity in patients with BD (Dima et al., 2013; Jogia et al., 2011) and in the vlPFC (Jogia et al., 2011).
However, individual GWAS-supported genetic loci only account for a very small fraction of the risk of BD (Visscher et al., 2012). In response, the polygenic risk (PGR) score method has been developed to quantify the extent to which common risk-variants may collectively capture var-iation in susceptibility to disease (International Schizophrenia Consortium et al., 2009). The PGR score for BD (PGR-BD) is calculated in each individual by aggregating variation across GWAS loci nominally associated with BD into a quantitative score (International Schizophrenia Consortium et al., 2009; Dima and Breen, 2015), with the current PGR-BD explaining ~ 5% of the variance to BD (Cross-Disorder Group of the Psychiatric Genomics Consortium, 2013). Two previous studies have used the polygenic risk score method to examine the cumulative impact of BD-related risk-conferring SNPs on task-relat-ed brain activation during an emotional processing (Tesli et al., 2015) and a word generation task (Whalley et al., 2012). During emotional processing, a positive association was found in patients with BD and in controls between PRG-BD score and brain activation in the right vlPFC. In the word generation task a positive association was also present be-tween the PGR-BD score and amygdalar activation in unaffected rela-tives of patients and in controls. Neither study found an interaction between PGR-BD score and diagnostic group on the patterns of brain ac-tivation. This evidence collectively suggests that the influence of com-mon risk-alleles on brain function may be more informative with regards to brain phenotypes related to vulnerability to BD rather than overt disease. The PGR method has a relatively higher explanatory power compared to single SNP examinations (Dima and Breen, 2015), and may be useful in identifying regions where the additive effect of common risk-alleles converges to confer vulnerability to BD.
Based on the above we examined the effect of a PGR-BD on brain fMRI data from patients with BD, unaffected relatives and unrelated healthy controls while performing a facial affect and a working memory processing task. Current models of BD emphasise increased neural re-sponse to affective stimuli coupled with reduced efficacy of the neural systems responsible for cognitive control (Phillips et al., 2003; Cerullo et al., 2009). We therefore chose the facial affect and working memory tasks as the former maps onto the ventral PFC-limbic pathway (Dima et al., 2011; Vuilleumier and Pourtois, 2007) implicated in the ability to process the emotional significance of stimuli and the later engages frontoparietal regions involved in cognitive control (Dima et al., 2014; Niendam et al., 2012; Owen et al., 2005). Additionally, previous studies have reported brain functional abnormalities in patients with BD while performing these tasks (Cerullo et al., 2009) thus demonstrating their relevance to BD. Using two different paradigms on the same study sam-ple we aimed to test whether the polygenic load for BD has a localized effect to a region or a network of regions that are task dependent and may represent a common pathway linking genetic risk to BD-related brain abnormalities.
2. Material and methods
2.1. Participants
Euthymic patients with BD (n = 41), their unaffectedfirst-degree relatives (n = 25) and demographically matched unrelated healthy in-dividuals (n = 46) were selected from the VIBES study (Frangou, 2009) (Table 1). All participants were of white British ancestry. They were assessed using the structured clinical interview for the Diagnostic and Statistical Manual of Mental Disorders, 4th edition, revised (DSM-IV) for Axis I diagnoses (First et al., 2002a, 2002b). Patients that fulfilled the criteria for BD, type I according to the DSM-IV (APA, 1994) were in-cluded. The relatives were carefully selected from the VIBES sample based on the absence of any lifetime history of psychopathology. The sample included 17 BD patients-sibling pairs from 17 different families. Unrelated healthy individuals were selected based on the absence of
family history and personal lifetime history of psychiatric disorders. In all participants, current IQ was assessed using the Wechsler Adult Intel-ligence Scale 3rd Edition (Wechsler, 1997) and psychopathology was rated using the Hamilton Depression Rating Scale (Hamilton, 1960) (HDRS), Young Mania Rating Scale (Young et al., 1978) (YMRS) and Brief Psychiatric Rating Scale (Lukoff et al., 1986) (BPRS). Psychopathol-ogy was assessed weekly in patients over a period of 1 month prior to testing and at each assessment they scored below 7 in the HDRS and YMRS. Patients were also required to have remained on the same type and dose of medication for a minimum of 6 months. The BPRS, HDRS and YMRS scores were highly correlated (all rN0.73, pb0.0001). To avoid collinearity we used the total BPRS score as a covariate in subse-quent neuroimaging analyses because, unlike the two other scales, it is applicable to nonclinical populations.
2.2. DNA extraction and genotyping
We obtained DNA from the participants using buccal swabs and con-ventional procedures. All participants were genotyped on the Psych Chip (Illumina Infinium PsychArray-24). Data quality was controlled in PLINK v1.07 (Purcell et al., 2007) using the same parameters as de-scribed in Coleman et al. (2016). SNPs were excluded when missingnessN1%, minor allele frequency (MAF)b0.01 or Hardy-Wein-berg equilibrium (HWE)b0.00001 and participants were excluded when missingnessN1%. Sex and relatedness checks were carried out, in addition to principal component analyses to confirm self-reported ethnicities (Patterson et al., 2006).
2.3. Polygenic risk scores
Genome-wide polygenic risk scores for BD (PGR-BD) were generat-ed with the PRSice software (http://prsice.info/; Euesden et al., 2015) using the most recent Psychiatric Genomics Consortium (PGC) GWAS of BD from the cross disorder study (Cross-Disorder Group of the Psychiatric Genomics Consortium, 2013). The SNPs used were those se-lected by the analysts of those studies using P-value-informed clumping in PLINK with a cut-off of r2= 0.25 within a 200-kb window, and
[image:3.595.312.560.75.282.2]ex-cluding the Major Histocompatibility Complex (MHC) region of the Table 1
Sample characteristics.
Patients with bipolar disorder (n = 41)
Unrelated controls (n = 46)
Unaffected relatives (n = 25)
Age (years) 44.3 (11.9) 40.3 (13.2) 39.7 (13.7) Sex (male/female) 20/21 25/21 13/12 IQ 117.9 (17.9) 112.6 (14.5) 115.8 (18.5) Polygenic risk scorea
0.37 (0.04) 0.32 (0.06) 0.35 (0.04) HDRS total scoreb
4.8 (5.3) 0.1 (0.5) 0.14 (0.4) YMRS total scoreb
1.4 (3.0) 0.2 (0.6) 0.0 (0.0) BPRS total scoreb
27.5 (4.0) 24.3 (0.7) 24.1 (0.4) Age of onset (years) 24.7 (8.0) – –
Duration of illness (years)
20.2 (10.5) – –
Depressive episodes (n)
5.7 (7.5) – –
Manic episodes (n) 5.6 (7.7) – –
Facial affect recognition accuracy (%)
90.3 (4.1) 93.1 (4.8) 90.1 (5.2)
Facial affect recognition response time (sec)c
1.4 (0.20) 1.10 (0.24) 1.09 (0.14)
2-back accuracy (%) 83 (11.6) 88 (15.6) 92.3 (12.5) 2-back response time
(sec)
0.65 (0.19) 0.63 (0.31) 0.62 (0.35)
Continuous data are shown as mean (standard deviation); BPRS = Brief Psychiatric Rating Scale; HDRS = Hamilton Depression Rating Scale); YMRS = Young Mania Rating Scale.
a
PatientsNControls (p = 0.002).
b
PatientsNRelatives, Controls (pb0.02).
c
genome because of its complex linkage disequilibrium structure. Of 108,834 clumped SNPs from the original analyses of BD, 108,217 existed in our data. For each participant, seven PGR-BD scores were generated using SNPs with p-valuesb0.001 (SNPs: 417), 0.05 (SNPs: 9715), 0.1 (SNPs: 16,691), 0.2 (SNPs: 28,450), 0.3 (SNPs: 38,207), 0.4 (SNPs: 46,753) and 0.5 (SNPs: 54,127).
2.4. Facial affect recognition paradigm
Three negative facial emotions (fear, anger and sadness) were exam-ined in three event-related experiments presented in a random order during a single acquisition session. In each experiment, 10 different fa-cial identities (www.paulekman.com) depicting 150% intensity of an af-fective or a neutral facial expression were presented in a pseudorandom order interspersed with afixation cross. Each stimulus (affect and neu-tral faces;fixation cross) was displayed for 2 s and repeated 20 times. Participants were instructed to indicate whether the face was emotional or neutral. Response time and accuracy data were collected.
2.5. Working memory paradigm
The 2-back task was presented as an alternating block paradigm in-corporating the active (2-back) and baseline (0-back) conditions. Par-ticipants were instructed to respond to target letters by button press. In the baseline condition, participants responded to the X letter. In the 2-back condition participants responded when the letter presented matched the one in the preceding 2 trials. Each stimulus was presented for 2 s. There were 18 epochs in all, each lasting 30 s. Response time and accuracy data were collected.
2.6. Image acquisition
Anatomical and functional imaging data were acquired during the same session using a General Electric Sigma 1.5 Tesla. A high-resolution T1-weighted structural image was acquired for each participant in the same session in the axial plane for co-registration (inversion recovery prepared, spoiled gradient-echo sequence; repetition time = 18 ms, echo time = 5.1 ms,flip angle = 20°, slice thickness = 1.5 mm, matrix size = 256∗192,field of view = 240∗180 mm, voxel dimensions = 0.9375∗0.9375∗1.5 mm).
For the facial affect recognition paradigm, 450 T2-weighted MR im-ages reporting blood-oxygen-level dependent (BOLD) contrast were ac-quired (repetition time = 2000 ms, echo time = 40 ms,flip angle = 70°, slice thickness = 7 mm, matrix size = 64∗64, voxel dimensions = 3.75∗3.75∗7.7 mm). For the 2-back paradigm, a total of 180 T2-weight-ed MR volumes depicting BOLD contrast were acquirT2-weight-ed (repetition time = 3000 ms, echo time = 40 ms,flip angle = 90°, slice thickness = 3 mm, matrix size = 64 ∗ 64, voxel dimensions = 3.75∗3.75∗3.30 mm).
2.7. Functional neuroimaging data analysis
Data were analysed in SPM8 (www.fil.ion.ucl.ac.uk/spm/software/ spm8/). Data from each paradigm were analysed separately. For both paradigms, fMRI images were realigned, normalized and smoothed using an 8-mm full-width-half maximum Gaussian kernel. For the facial affect recognition paradigm, each participant's fMRI data from the three event-related experiments (fear, anger or sadness) were concatenated and vectors of onset representing correct responses were convolved with a canonical hemodynamic response function. The means of the three sessions as well as the transition at the end of each session were also modelled and images for the affectNneutral faces contrast were produced for each participant. For the 2-back paradigm, the smoothed single-participant images were analysed using the linear convolution model, with vectors of onset representing the active (2-back) and
baseline (0-back) condition. For each participant, images for the 2-backNbaseline contrast were produced.
2.8. Effect of PGR-BD score on task-related activation
For each task separately, contrast images from each participant were entered into second-level analyses using one-sample t-tests to identify clusters of increased task-related activation at pb0.05 with Family Wise Error (FWE) correction and cluster size (k)N20. The BPRS total score and relatedness were added as covariates. Beta value from the supra-threshold clusters were then extracted using the eigenvariate function in SPM8 and entered into a multivariate model to examine the effect of PGR-BD and its interaction with group (BD patients, unaf-fected relatives, unrelated healthy controls) in SPSS22, with relatedness as a covariate.
2.9. Effect of PGR-BD score on group differences on task-related activation
The effect of group (patients, relatives controls) was examined sep-arately for each paradigm (affect facesNneutral faces; 2-backN base-line) using a general lineal model in SMP8 with the BPRS total score as covariate. In each of these analyses, supra-threshold clusters signifying group differences were identified using FWE correction of pb0.05, kN20. Beta values were extracted from each supra-threshold cluster using the eigenvariate function in SPM8. To test whether the PGR-BD score explained additional variance in group differences, Pearson's cor-relation analyses were used to examine the cor-relationship between mean signal change in the suprathreshold clusters and PGR-BD score in SPSS22, with relatedness as a covariate.
3. Results
3.1. Polygenic risk scores
We used one-way analysis of variance to compare patients, relatives, controls on PGR-BD scores derived using seven statistical thresholds (i.e., using SNPs with p-valuesb0.001, 0.05, 0.1, 0.2, 0.3, 0.4 and 0.5). Al-though the effect of group was significant at all thresholds, the highest difference (F = 5.94, p = 0.004) was found for the PGR-BD score using 16,691 SNPs with pb0.1. This PGR-BD score was higher in pa-tients than controls (p = 0.002) while in relatives it was numerically intermediated between that of patients (p = 0.06) and controls (p = 0.09) (Table 1). All subsequent analyses and results refer to this PGR-BD score. In the patient group, no significant correlations were found between PGR-BD and symptom severity (based on the total score of the HDRS, YMRS and BPRS), age of onset, duration of illness, and num-ber of depressive and manic episodes (pN0.27).
3.2. Behavioural task performance
Details of task performance are shown inTable 1. Patients' medica-tion type and dose did not correlate with performance on either task (all pN0.40). In the facial affect recognition paradigm, we found a main effect of group on response time (p = 0.004), with BD patients being slower than the other two groups (pb0.007). However, the PGR-BD score showed a significant negative correlation with response time to affect compared to neutral faces when controlling for group (r =−0.31, p = 0.003). In the 2-back task, there was no effect of group and no significant correlations were found between PGR-BD score and task performance.
3.3. Effect of PGR-BD on task-related activation
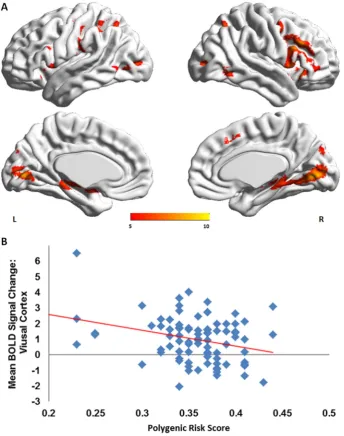
3.3.1. Facial affect recognition
(Supplemental Table 1;Fig. 1A). There was a main effect of PGR-BD score (F = 2.03, p = 0.04) but no group by PGR-BD interaction (F = 0.99, p = 0.46). The PGR-BD score influenced mean signal change in the visual cortex (peak MNI coordinates at: x =−32, y =−88, z = 2;p= 0.006) (Fig. 1B).
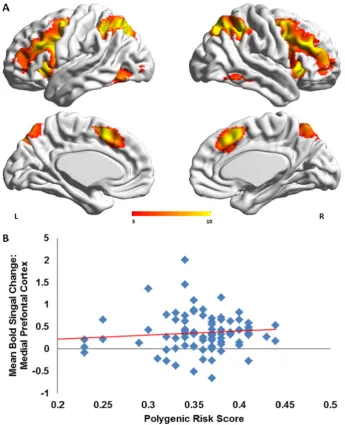
3.3.2. Working memory
In all participants, activation in 2-backNbaseline contrast was found in the ventral and dorsal lateral prefrontal cortex and in the parietal cor-tex (Supplemental Table 1;Fig. 2A). There was a main effect of PGR-BD score (F = 2.83, p = 0.01) but no group by PGR-BD interaction (F = 1.13, p = 0.33). The PGR-BD score influenced mean signal change in medial prefrontal cortex (peak MNI coordinates at: x = 22, y = 48, z =−14; p = 0.004) (Fig. 2B).
3.4. Effect of PGR-BD on group differences on task-related activation
3.4.1. Facial affect recognition
In the contrast affectNneutral faces, an effect of group was noted in the anterior cingulate cortex (ACC) and right superior frontal gyrus, where BD patients showed, respectively, increased and decreased
activation compared to their relatives and unrelated healthy individuals (Supplemental Table 2). No significant correlation between the PGR-BD score and signal change in the suprathreshold clusters was identified (pN0.05).
3.4.2. Working memory
No effect of group was noted in the 2-backNbaseline contrast.
4. Discussion
[image:5.595.131.476.283.720.2]The current study examined the cumulative impact of common risk-alleles for BD, expressed as a polygenic risk score (PGR-BD), on brain ac-tivation during facial affect and working memory processing in patients with BD, unaffected relatives and unrelated controls. As expected, the PGR-BD score was higher in BD patients. Relatives had intermediate values that were not statistically different from that of either patients or controls. In line with previous reports (Whalley et al., 2012; Tesli et al., 2015), there was a significant effect of PGR-BD on task-related BOLD signal change independent of group but no significant PGR-BD score by group interactions. The currentfindings therefore support the notion that the polygenic load method is more informative in terms of
identifying patterns of neural activation that mediate vulnerability to BD rather than symptom expression. This is consistent with the liabili-ty-threshold model of BD since a significant number of risk-alleles are also present in healthy individuals that are unlikely to ever develop BD. Our results also suggest that the effect of polygenic load for BD is not localized to a single region or pathway, irrespective of task. Instead we found that the PGR-BD score influenced task-dependent brain activation.
During the facial affect recognition task, we found a negative associ-ation between the PGR-BD score and activassoci-ation in the visual associassoci-ation cortex. This region is part of the ventral visual pathway, which together with the amygdala and ventral prefrontal regions, form the core facial affect processing network (Dima et al., 2011; Vuilleumier and Pourtois, 2007). Reduced visual cortical activation and connectivity dur-ing facial affect processdur-ing (Pavuluri et al., 2007; Dima et al., 2016) has been previously reported in patients with BD and have been consistent-ly coupled with increased amygdalar and decreased vlPFC activation (Chen et al., 2011; Delvecchio et al., 2013). Studies of single SNPs on brain function during emotional processing have found risk-variants to be related to increased amygdalar activation (Jogia et al., 2011; Dima et al., 2013; Tesli et al., 2013). However, when considering thou-sands of risk-conferring alleles, as reflected in the PGR-BD score, we
found that their additive effect on the facial affect network involved pri-marily the recruitment of visual cortical regions. Thesefindings add to the growing evidence of visual information processing abnormalities in patients with BD observed in visual backward masking (McClure, 1999), vernier acuity (Kéri et al., 2005), motion discrimination (Chen et al., 2006; O'Bryan et al., 2014), context modulation (Yang et al., 2013) and early visual evoked potentials (Yeap et al., 2009). It is sug-gested therefore that abnormalities in early sensory processing of affec-tive visual stimuli may contribute to inadequate emotional regulation and predispose individuals to development of the BD.
[image:6.595.121.467.51.477.2](Thermenos et al., 2010; Alonso-Lana et al., 2016) and have been previ-ously linked to risk-variants in the ANK3 gene (Delvecchio et al., 2015). Ourfindings further confirm that abnormalities in suppressing vmPFC activation are likely to represent a genetically mediated vulnerability trait for BD that is linked to greater polygenic load for the disorder.
The main limitation of the current study relates to the sample size which is relatively small for the purposes of genetic studies and could be a potential reason why we did notfind any significant group by PGR-BD interaction. On the other hand, the main advantage of the poly-genic risk score method is that it provides a quantitative measure of the polygenic load of each study participant without relying on their genetic distance from an affected proband. Moreover, the PGR-BD allows modelling the cumulative effect of multiple risk-variants for BD and is known to explain a greater proportion of phenotypic variance that sin-gle riks-alleles (International Schizophrenia Consortium et al., 2009; Dima and Breen, 2015).
In conclusion, we demonstrated that the polygenic risk architecture of BD influences the function of regions known to be involved in the sensory and default state processing of emotional information. Func-tional abnormalities in the visual cortex and ventromedial prefrontal re-gions of the DMN emerge as genetically influenced vulnerability traits of BD. The current results also indicate that the effect of genetic load for BD on brain function affects task-related recruitment of different brain re-gions. Future imaging genetics studies with large samples would be uniquely informative in mapping the spatial distribution of the genetic risk to BD on brain processes during various cognitive tasks and may lead to the discovery of biological pathways that may be crucial in me-diating the link between genetic factors and alterations in brain net-works in this disorder.
Acknowledgements
DD is partially supported by a NARSAD 2014 Young Investigator Award (Leichtung Family Investigator, Grant ID: 22471) and a Psychiat-ric Research Trust (Grant Reference: 92 Branthwaite) grant. SF is partial-ly supported by the R01 MH104284-01A1 from the National Institute of Mental Health (NIMH). SDJ is partially supported by NARSAD Young In-vestigator Grant (YI 60373) and European Union's Horizon 2020 Re-search and Innovation Programme (Marie Sklodowska-Curie grant agreement 658195). Additional part-funding was provided by the Na-tional Institute for Health Research (NIHR) Biomedical Research Centre at the South London and Maudsley NHS Foundation Trust and King's College London. The funding agencies had no involvement in data col-lection and analysis and in the writing of this manuscript.
Appendix A. Supplementary results
Supplementary data to this article can be found online athttp://dx. doi:10.1016/j.nicl.2016.10.022.
References
Alonso-Lana, S., Valentí, M., Romaguera, A., Sarri, C., Sarró, S., Rodríguez-Martínez, A., Goikolea, J.M., Amann, B.L., Maristany, T., Salvador, R., Vieta, E., McKenna, P.J., Pomarol-Clotet, E., 2016.Brain functional changes infirst-degree relatives of patients with bipolar disorder: evidence for default mode network dysfunction. Psychol. Med. 46 (12), 2513–2521.
Alsabban, S., Rivera, M., McGuffin, P., 2011.Genome-wide searches for bipolar disorder genes. Curr. Psychiatry Rep. 13 (6), 522–527.
American Psychiatric Association, 1994.Diagnostic and Statistical Manual of Mental Dis-orders. fourth ed. American Psychiatric Association, Washington, DC.
Bigos, K.L., Mattay, V.S., Callicott, J.H., Straub, R.E., Vakkalanka, R., Kolachana, B., Hyde, T.M., Lipska, B.K., Kleinman, J.E., Weinberger, D.R., 2010.Genetic variation in CACNA1C affects brain circuitries related to mental illness. Arch. Gen. Psychiatry 67 (9), 939–945.
Cerullo, M.A., Adler, C.M., Delbello, M.P., Strakowski, S.M., 2009.The functional neuroanat-omy of bipolar disorder. Int. Rev. Psychiatry. 21 (4), 314–322.
Chakirova, G., Whalley, H.C., Thomson, P.A., Hennah, W., Moorhead, T.W., Welch, K.A., Giles, S., Hall, J., Johnstone, E.C., Lawrie, S.M., Porteous, D.J., Brown, V.J., McIntosh, A.M., 2011.The effects of DISC1 risk variants on brain activation in controls, patients
with bipolar disorder and patients with schizophrenia. Psychiatry Res. 192 (1), 20–28.
Chen, Y., Levy, D.L., Sheremata, S., Holzman, P.S., 2006.Bipolar and schizophrenic patients differ in patterns of visual motion discrimination. Schizophr. Res. 88 (1–3), 208–216.
Chen, C.H., Suckling, J., Lennox, B.R., Ooi, C., Bullmore, E.T., 2011.A quantitative meta-anal-ysis of fMRI studies in bipolar disorder. Bipolar Disord. 13 (1), 1–15.
Coleman, J.R., Euesden, J., Patel, H., Folarin, A.A., Newhouse, S., Breen, G., 2016.Quality control, imputation and analysis of genome-wide genotyping data from the Illumina HumanCoreExome microarray. Brief Funct. Genomics 15 (4), 298–304.
Cross-Disorder Group of the Psychiatric Genomics Consortium, 2013,.Identification of risk loci with shared effects onfive major psychiatric disorders: a genome-wide anal-ysis. Lancet 381, 1371–1379.
Delvecchio, G., Dima, D., Frangou, S., 2015.The effect of ANK3 bipolar-risk polymorphisms on the working memory circuitry differs between loci and according to risk-status for bipolar disorder. Am. J. Med. Genet. B Neuropsychiatr. Genet. 168B (3), 188–196.
Delvecchio, G., Sugranyes, G., Frangou, S., 2013.Evidence of diagnostic specificity in the neural correlates of facial affect processing in bipolar disorder and schizophrenia: a meta-analysis of functional imaging studies. Psychol. Med. 43 (3), 553–569.
Dima, D., Breen, G., 2015.Polygenic risk scores in imaging genetics: usefulness and appli-cations. J. Psychopharmacol. 29 (8), 867–871.
Dima, D., Jogia, J., Collier, D., Vassos, E., Burdick, K.E., Frangou, S., 2013.Independent mod-ulation of engagement and connectivity of the facial network during affect processing by CACNA1C and ANK3 risk genes for bipolar disorder. JAMA Psychiatry. 70 (12), 1303–1311.
Dima, D., Jogia, J., Frangou, S., 2014.Dynamic causal modeling of load-dependent modu-lation of effective connectivity within the verbal working memory network. Hum. Brain Mapp. 35 (7), 3025–3035.
Dima, D., Roberts, R.E., Frangou, S., 2016.Connectomic markers of disease expression, ge-netic risk and resilience in bipolar disorder. Transl. Psychiatry 6, e706.
Dima, D., Stephan, K.E., Roiser, J.P., Friston, K.J., Frangou, S., 2011.Effective connectivity during processing of facial affect: evidence for multiple parallel pathways. J. Neurosci. 31 (40), 14378–14385.
Erk, S., Meyer-Lindenberg, A., Schmierer, P., Mohnke, S., Grimm, O., Garbusow, M., Haddad, L., Poehland, L., Mühleisen, T.W., Witt, S.H., Tost, H., Kirsch, P., Romanczuk-Seiferth, N., Schott, B.H., Cichon, S., Nöthen, M.M., Rietschel, M., Heinz, A., Walter, H., 2014.Hippocampal and frontolimbic function as intermediate phenotype for psy-chosis: evidence from healthy relatives and a common risk variant in CACNA1C. Biol. Psychiatry 76 (6), 466–475.
Erk, S., Meyer-Lindenberg, A., Schnell, K., Opitz von Boberfeld, C., Esslinger, C., Kirsch, P., Grimm, O., Arnold, C., Haddad, L., SH, W., Cichon, S., MM, N., Rietschel, M., Walter, H., 2010.Brain function in carriers of a genome-wide supported bipolar disorder var-iant. Arch. Gen. Psychiatry 67 (8), 803–811.
Euesden, J., Lewis, C.M., O'Reilly, P.F., 2015.PRSice: polygenic risk score software. Bioinfor-matics 31 (9), 1466–1468.
Fernández-Corcuera, P., Salvador, R., Monté, G.C., Salvador Sarró, S., Goikolea, J.M., Amann, B., Moro, N., Sans-Sansa, B., Ortiz-Gil, J., Vieta, E., Maristany, T., McKenna, P.J., Pomarol-Clotet, E., 2013.Bipolar depressed patients show both failure to activate and failure to de-activate during performance of a working memory task. J. Affect. Disord. 148 (2–3), 170–178.
First, M.B., Spitzer, R.L., Gibbon, M., Williams, J.B.W., 2002a.Structured Clinical Interview for DSM-IV-TR Axis I Disorders, Research Version, Patient Edition, (SCID-I/P). New York Biometrics Research, New York, USA.
First, M.B., Spitzer, R.L., Gibbon, M., Williams, J.B.W., 2002b.Structured Clinical Interview for DSM-IV-TR Axis I Disorders, Research Version, Non-Patient Edition, (SCID-I/NP). New York Biometrics Research, New York, USA.
Frangou, S., 2009.Risk and resilience in bipolar disorder: rationale and design of the Vul-nerability to Bipolar Disorders Study (VIBES). Biochem. Soc. Trans. 37 (5), 1085–1089.
Franke, B., Vasquez, A.A., Veltman, J.A., Brunner, H.G., Rijpkema, M., Fernández, G., 2010.
Genetic variation in CACNA1C, a gene associated with bipolar disorder, influences brainstem rather than gray matter volume in healthy individuals. Biol. Psychiatry 68 (6), 586–588.
Gottesman, I.I., Shields, J., 1967.A polygenic theory of schizophrenia. Proc. Natl. Acad. Sci. U. S. A. 58 (1), 199–205.
Green, E.K., Hamshere, M., Forty, L., Gordon-Smith, K., Fraser, C., Russell, E., Grozeva, D., Kirov, G., Holmans, P., Moran, J.L., Purcell, S., Sklar, P., Owen, M.J., O'Donovan, M.C., Jones, L., WTCCC, IR, J., Craddock, N., 2013.Replication of bipolar disorder susceptibil-ity alleles and identification of two novel genome-wide significant associations in a new bipolar disorder case-control sample. Mol Psychiatry 18 (12), 1302–1307.
Gusnard, D.A., Akbudak, E., Shulman, G.L., Raichle, M.E., 2001.Medial prefrontal cortex and self-referential mental activity: relation to a default mode of brain function. Proc. Natl. Acad. Sci. U. S. A. 98 (7), 4259–4264.
Hamilton, M., 1960.A rating scale for depression. J. Neurol. Neurosurg. Psychiatry 23, 56–62.
Heinrich, A., Lourdusamy, A., Tzschoppe, J., Vollstädt-Klein, S., Bühler, M., Steiner, S., Bach, C., Poustka, L., Banaschewski, T., Barker, G., Büchel, C., Conrod, P., Garavan, H., Gallinat, J., Heinz, A., Ittermann, B., Loth, E., Mann, K., Martinot, J.L., Paus, T., Pausova, Z., Smolka, M., Ströhle, A., Struve, M., Witt, S., Flor, H., Schumann, G., Rietschel, M., Nees, F., 2013.
IMAGEN consortium. The risk variant in ODZ4 for bipolar disorder impacts on amygdala activation during reward processing. Bipolar Disord. 15 (4), 440–445.
International Schizophrenia Consortium, Purcell, S.M., Wray, N.R., Stone, J.L., Visscher, P.M., O'Donovan, M.C., Sullivan, P.F., Sklar, P., 2009.Common polygenic variation con-tributes to risk of schizophrenia and bipolar disorder. Nature 460 (7256), 748–752.
Kempton, M.J., Ruberto, G., Vassos, E., Tatarelli, R., Girardi, P., Collier, D., Frangou, S., 2009.
Effects of the CACNA1C risk allele for bipolar disorder on cerebral gray matter volume in healthy individuals. Am. J. Psychiatry 166 (12), 1413–1414.
Kéri, S., Kelemen, O., Benedek, G., Janka, Z., 2005.Lateral interactions in the visual cortex of patients with schizophrenia and bipolar disorder. Psychol. Med. 35 (7), 1043–1051.
Krug, A., Nieratschker, V., Markov, V., Krach, S., Jansen, A., Zerres, K., Eggermann, T., Stöcker, T., Shah, N.J., Treutlein, J., Mühleisen, T.W., Kircher, T., 2010.Effect of CACNA1C r1006737 on neural correlates of verbalfluency in healthy individuals. NeuroImage 49 (2), 1831–1836.
Lelli-Chiesa, G., Kempton, M.J., Jogia, J., Tatarelli, R., Girardi, P., Powell, J., Collier, D.A., Frangou, S., 2011.The impact of the Val158Met catechol-O-methyltransferase geno-type on neural correlates of sad facial affect processing in patients with bipolar disor-der and their relatives. Psychol. Med. 41 (4), 779–788.
Lichtenstein, P., Yip, B.H., Björk, C., Pawitan, Y., Cannon, T.D., Sullivan, P.F., Hultman, C.M., 2009.Common genetic determinants of schizophrenia and bipolar disorder in Swed-ish families: a population-based study. Lancet 373 (9659), 234–239.
Lukoff, D., Liberman, R.P., Nuechterlien, K.H., 1986.Symptom monitoring in the rehabili-tation of schizophrenic patients. Schizophr. Bull. 12 (4), 578–602.
McClure, R.K., 1999.Backward masking in bipolar affective disorder. Prog. Neuro-Psychopharmacol. Biol. Psychiatry 23 (2), 195–206.
Mechelli, A., Prata, D.P., Fu, C.H., Picchioni, M., Kane, F., Kalidindi, S., McDonald, C., Demjaha, A., Kravariti, E., Toulopoulou, T., Murray, R., Collier, D.A., McGuire, P.K., 2008.The effects of neuregulin1 on brain function in controls and patients with schizophrenia and bipolar disorder. NeuroImage 42 (2), 817–826.
Niendam, T.A., Laird, A.R., Ray, K.L., Dean, Y.M., Glahn, D.C., Carter, C.S., 2012. Meta-analyt-ic evidence for a superordinate cognitive control network subserving diverse execu-tive functions. Cogn. Affect. Behav. Neurosci. 12 (2), 241–268.
O'Bryan, R.A., Brenner, C.A., Hetrick, W.P., O'Donnell, B.F., 2014.Disturbances of visual mo-tion percepmo-tion in bipolar disorder. Bipolar Disord. 16 (4), 354–365.
Owen, A.M., McMillan, K.M., Laird, A.R., Bullmore, E., 2005.N-back working memory par-adigm: a meta-analysis of normative functional neuroimaging studies. Hum. Brain Mapp. 25 (1), 46–59.
Patterson, N., Price, A.L., Reich, D., 2006.Population structure and eigenanalysis. PLoS Genet. 2 (12), e190.
Paulus, F.M., Bedenbender, J., Krach, S., Pyka, M., Krug, A., Sommer, J., Mette, M., Nöthen, M.M., Witt, S.H., Rietschel, M., Kircher, T., Jansen, A., 2014.Association of rs1006737 in CACNA1C with alterations in prefrontal activation and fronto-hippocampal con-nectivity. Hum. Brain Mapp. 35 (4), 1190–1200.
Pavuluri, M.N., O'Connor, M.M., Harral, E., Sweeney, J.A., 2007.Affective neural circuitry during facial emotion processing in pediatric bipolar disorder. Biol. Psychiatry 62 (2), 158–167.
Perrier, E., Pompei, F., Ruberto, G., Vassos, E., Collier, D., Frangou, S., 2011.Initial evidence for the role of CACNA1C on subcortical brain morphology in patients with bipolar dis-order. Eur. Psychiatry. 26 (3), 135–137.
Phillips, M.L., Drevets, W.C., Rauch, S.L., Lane, R., 2003.Neurobiology of emotion percep-tion II: implicapercep-tions for major psychiatric disorders. Biol. Psychiatry 54 (5), 515–528.
Pomarol-Clotet, E., Alonso-Lana, S., Moro, N., Sarró, S., Bonnin, M.C., Goikolea, J.M., Fernández-Corcuera, P., Amann, B.L., Romaguera, A., Vieta, E., Blanch, J., McKenna, P.J., Salvador, R., 2015.Brain functional changes across the different phases of bipolar disorder. Br. J. Psychiatry 206 (2), 136–144.
Pomarol-Clotet, E., Moro, N., Sarro´, S., Goikolea, J.M., Vieta, E., Amann, B., Fernandez-Corcuera, P., Sans-Sansa, B., Monte´, G.C., Capdevila, A., McKenna, P.J., Salvador, R., 2012.Failure of activation in the medial frontal cortex in mania: evidence for de-fault mode network dysfunction in the disorder. World J. Biol. Psychiatry. 13 (8), 616–626.
Prata, D.P., Mechelli, A., Picchioni, M., Fu, C.H., Kane, F., Kalidindi, S., McDonald, C., Kravariti, E., Toulopoulou, T., Bramon, E., Walshe, M., Murray, R., Collier, D.A.,
McGuire, P.K., 2011.No association of disrupted-in-schizophrenia-1 variation with prefrontal function in patients with schizophrenia and bipolar disorder. Genes Brain Behav. 10 (3), 276–285.
Psychiatric GWAS Consortium Bipolar Disorder Working Group, 2011,.Larscale ge-nome-wide association analysis of bipolar disorder identifies a new susceptibility locus near ODZ4. Nat. Genet. 43 (10), 977–983.
Purcell, S., Neale, B., Todd-Brown, K., Thomas, L., Ferreira, M.A., Bender, D., Maller, J., Sklar, P., de Bakker, P.I., Daly, M.J., Sham, P.C., 2007.PLINK: a tool set for whole-genome as-sociation and population-based linkage analyses. Am. J. Hum. Genet. 81 (3), 559–575.
Raichle, M.E., MacLeod, A.M., Snyder, A.Z., Powers, W.J., Gusnard, D.A., Shulman, G.L., 2001.A default mode of brain function. Proc. Natl. Acad. Sci. U. S. A. 98 (2), 676–682.
Smoller, J.W., Finn, C.T., 2003.Family, twin, and adoption studies of bipolar disorder. Am. J. Med. Genet. C Semin. Med. Genet. 123C (1), 48–58.
Soeiro-de-Souza, M.G., Otaduy, M.C., Dias, C.Z., Bio, D.S., Machado-Vieira, R., Moreno, R.A., 2012.The impact of the CACNA1C risk allele on limbic structures and facial emotions recognition in bipolar disorder subjects and healthy controls. J. Affect. Disord. 141 (1), 94–101.
Tesli, M., Kauppi, K., Bettella, F., Brandt, C.L., Kaufmann, T., Espeseth, T., Mattingsdal, M., Agartz, I., Melle, I., Djurovic, S., Westlye, L.T., Andreassen, O.A., 2015.Altered brain ac-tivation during emotional face processing in relation to both diagnosis and polygenic risk of bipolar disorder. PLoS One 10 (7), e0134202.
Tesli, M., Skatun, K.C., Ousdal, O.T., Brown, A.A., Thoresen, C., Agartz, I., Melle, I., Djurovic, S., Jensen, J., Andreassen, O.A., 2013.CACNA1C risk variant and amygdala activity in bipolar disorder, schizophrenia and healthy controls. PLoS One 8 (2), e56970.
Thermenos, H.W., Goldstein, J.M., Milanovic, S.M., Whitfield-Gabrieli, S., Makris, N., Laviolette, P., Koch, J.K., Faraone, S.V., Tsuang, M.T., Buka, S.L., Seidman, L.J., 2010.
An fMRI study of working memory in persons with bipolar disorder or at genetic risk for bipolar disorder. Am. J. Med. Genet. B Neuropsychiatr. Genet. 153B (1), 120–131.
van der Voort, T.Y., Seldenrijk, A., van Meijel, B., Goossens, P.J., Beekman, A.T., Penninx, B.W., Kupka, R.W., 2015.Functional versus syndromal recovery in patients with major depressive disorder and bipolar disorder. J. Clin. Psychiatry 76 (6), e809–e814.
Visscher, P.M., Goddard, M.E., Derks, E.M., Wray, N.R., 2012.Evidence-based psychiatric genetics, AKA the false dichotomy between common and rare variant hypotheses. Mol. Psychiatry 17 (5), 474–485.
Vuilleumier, P., Pourtois, G., 2007.Distributed and interactive brain mechanisms during emotion face perception: evidence from functional neuroimaging. Neuropsychologia 45 (1), 174–194.
Wechsler, D., 1997.Wechsler Adult Intelligence Scale - Third Edition. The Psychological Corporation, San Antonio, USA.
Wessa, M., Linke, J., Witt, S.H., Nieratschker, V., Esslinger, C., Kirsch, P., Grimm, O., Hennerici, M.G., Gass, A., King, A.V., Rietschel, M., 2010.The CACNA1C risk variant for bipolar disorder influences limbic activity. Mol. Psychiatry 15 (12), 1126–1127.
Whalley, H.C., Papmeyer, M., Sprooten, E., Romaniuk, L., Blackwood, D.H., Glahn, D.C., Hall, J., Lawrie, S.M., Sussmann, J., McIntosh, A.M., 2012.The influence of polygenic risk for bipolar disorder on neural activation assessed using fMRI. Transl. Psychiatry 2, e130.
Yang, E., Tadin, D., Glasser, D.M., Wook Hong, S., Blake, R., Park, S., 2013.Visual context processing in bipolar disorder: a comparison with schizophrenia. Front. Psychol. 4, 569.
Yeap, S., Kelly, S.P., Reilly, R.B., Thakore, J.H., Foxe, J.J., 2009.Visual sensory processing def-icits in patients with bipolar disorder revealed through high-density electrical map-ping. J. Psychiatry Neurosci. 34 (6), 459–464.