City, University of London Institutional Repository
Citation
:
Turkay, C., Jeanquartier, F., Holzinger, A. and Hauser, H. (2014). On
Computationally-Enhanced Visual Analysis of Heterogeneous Data and Its Application in
Biomedical Informatics. In: Holzinger, A. and Jurisica, I. (Eds.), Interactive Knowledge
Discovery and Data Mining in Biomedical Informatics. Lecture Notes in Computer Science,
8401. (pp. 117-140). Springer Berlin Heidelberg. ISBN 9783662439678
This is the unspecified version of the paper.
This version of the publication may differ from the final published
version.
Permanent repository link: http://openaccess.city.ac.uk/3742/
Link to published version
:
http://dx.doi.org/10.1007/978-3-662-43968-5_7
Copyright and reuse:
City Research Online aims to make research
outputs of City, University of London available to a wider audience.
Copyright and Moral Rights remain with the author(s) and/or copyright
holders. URLs from City Research Online may be freely distributed and
linked to.
City Research Online:
http://openaccess.city.ac.uk/
[email protected]
of Heterogeneous Data and its
Application in Biomedical Informatics
Cagatay Turkay1, Fleur Jeanquartier2 Andreas Holzinger2, and Helwig Hauser3
1
giCentre, Department of Computer Science, City University, London, UK
2
Research Unit HCI, Institute for Medical Informatics, Statistics and Documentation Medical University Graz, Austria
{f.jeanquartier,a.holzinger}@hci4all.at
3 Visualization Group, Department of Informatics, University of Bergen, Norway
Abstract. With the advance of new data acquisition and generation technologies, the biomedical domain is becoming increasingly data-driven. Thus, understanding the information in large and complex data sets has been in the focus of several research fields such as statistics, data mining, machine learning, and visualization. While the first three fields predomi-nantly rely on computational power, visualization relies mainly on human perceptual and cognitive capabilities for extracting information. Data vi-sualization, similar to Human–Computer Interaction, attempts an appro-priate interaction between human and data to interactively exploit data sets. Specifically within the analysis of complex data sets, visualization researchers have integrated computational methods to enhance the in-teractive processes. In this state-of-the-art report, we investigate how such an integration is carried out. We study the related literature with respect to the underlying analytical tasks and methods of integration. In addition, we focus on how such methods are applied to the biomedical domain and present a concise overview within our taxonomy. Finally, we discuss some open problems and future challenges.
Keywords: Visualization, Visual Analytics, Heterogenous Data, Com-plex Data, Future Challenges, Open Problems
1
Introduction and Motivation
e.g., from molecular interactions to how biological systems in the human body, and the inherent characteristics they carry, e.g., images from different medical devices. Such structures are both a challenge and a opportunity for scientists and significant efforts are put in several domains to understand these data. In this paper, we focus on how visualization, in particular those that incorporate computational analysis, approaches and enhances the analysis of structured in-formation sources. We start with a section that discusses our goals and move on to more specific discussions on understanding information in data.
1.1 Goals
The best way of beginning such a paper, would be to start with the definition of Visualization and discuss thegoal of visualization: A classical goal of visu-alization is, in an interactive, visual representation of abstract data, to amplify the acquisition or use of knowledge [1] and to enable humans to gain insight
into complex data sets, either for the purpose of data exploration and analysis, or for data presentation [2], [3] (see section Glossary and Key Terms for more discussions). Visualization is a form of computing that provides new scientific insight through visual methods and therefore of enormous importance within the entire knowledge discovery process [4].
Thegoal of this paperis to provide a concise introduction into the
visual-ization of large and heterogeneous data sets, in particular from the biomedical domain. For this purpose we provide a glossary to foster a common understand-ing, give a short nutshell-like overview about the current state-of-the-art and finally focus on open problems and future challenges. We base our taxonomy on a 2D structure on the different analytical tasks and on how computational methods can be integrated in visualizations. All the relevant works are then grouped under these categories. In addition to studies that do not have a spe-cific application domain, we categorize visualization methods that spespe-cifically aimed at solving biomedical problems. Such subsets of work are presented under each category.
The goal of this dual focus strategy is to identify areas where
visual-ization methods have shown to be successful but have not yet been applied to problems in the biomedical domain.
1.2 Understanding Information in Data
in integrating visualization and statistics with his work on exploratory data
analysis. Earlier research on integrating statistics [13] and data mining [9] with
information visualization have taken Tukey’s ideas further.
This vision of integrating the best of both worlds has been a highly praised goal in visualization research [14–16] and parallels the emergence ofvisual an-alytics as a field on its own, which brings together research from visualization, data mining, data management, and human computer interaction [15]. In vi-sual analytics research, the integration of automated and interactive methods is considered to be the main mechanism to foster the construction of knowl-edge in data analysis. In that respect, Keim [17] describes the details of a visual analysis process, where the data, the visualization, hypotheses, and interactive methods are integrated to extract relevant information. In their sense-making loop, based on the model introduced by van Wijk [18], the analytical process is carried out iteratively where the computational results are investigated through interactive visualizations. Such a loop aims to provide a better understanding of the data that will ultimately help the analyst to build new hypotheses. However, previously presented approaches still lack considering certain research issues to support a truly cross-disciplinary, seamless and holistic approach for the process chain ofdata>information>knowledge. Research needs to deal with data inte-gration, fusion, preprocessing and data mapping as well as issues of privacy and data protection. These issues are being addressed in the HCI-KDD approach by Holzinger [19], [20] and is supported by the international expert network HCI-KDD (see hci4all.at).
1.3 Understanding Information in Biomedical Data
Interactive visual methods have been utilized within a wide spectrum of domains. In biomedicine, visualization is specifically required to support data analysts in tackling with problems inherent in this domain [20–22]. These can be summarized in three specific and general challenges:
Challenge 1: Due to the trend towards a data-centric medicine, data analysts have to deal with increasingly growing volumes and a diversity of highly com-plex, multi-dimensional and often weakly-structured and noisy data sets and increasing amounts of unstructured information.
Challenge 3: The growing need for integrative solutions for interactive visual-ization of the data mentioned in challenge 1 and 2. Note that, although there are many sophisticated results and paradigms from the visualization community, integrated solutions, e.g. within business hospital information systems, are rare today.
An example from the biological domain can emphasize the aforementioned challenges: Biologists deal with data of different scale and resolution, ranging from tissues at the molecular and cellular scale (”the microscopic”) up to or-gan scale (”the macroscopic”), as well as data from a diversity of databases of genomes and expression profiles, protein-protein interaction and pathways [23]. As understood bysystems biology, the biological parts do not act alone, but in a strongly interwoven fashion, therefore biologists need to bridge and map dif-ferent data types and analyze interactions [24]. Biomedicine has reached a point where the task of analyzing data is replacing the task of generating data [25]. At this point, visual analysis methods that support knowledge discovery in complex data become extremely important.
2
Glossary and Key Terms
In this section, we try to capture visualization and data analysis related terms that are only referenced explicitly within this paper. We do not cover the whole spectrum of visualization and analysis terms.
Visualization:is a visual representation of datasets intended to help people carry out some task more effectively according to Tamara Munzner [26]. Ward de-scribes visualization as the graphical presentation of information, with the goal of providing the viewer with a qualitative understanding of the information con-tents [3].
Space: A set of points a∈S which satisfy some geometric postulate.
Topological Visualization: a prominent trend in current visualization research, driven by the data deluge. A topological abstraction provides a common math-ematical language to identify structures and contexts [27], [28].
Visual Analytics:is an integrated approach combining visualization, human fac-tors and data analysis to achieve a deep understanding of the data [14, 15].
Heterogeneous data: composed of data objects carrying different characteris-tics and coming from different sources. The heterogeneity can manifest itself in several forms such as differentscales of measure, i.e., being categorical, discrete or continuous, or challenging to relate representations, e.g., genomic activity through gene expression vs. molecular pathways; a recent example of such data sets is described by Emmert-Streib et al. [29].
Classification: Methods that identify which subpopulation a new observation belongs on the basis of a training set of observations with known categories.
Factor Analysis & Dimension Reduction: is a statistical method that aims to describe the information in the data by preserving most of the variety. This pro-cess often leads to derived, unobserved variables called the factors [5]. Similarly, there exist dimension reduction methods, such as Principal Component Analysis (PCA) and Multi-Dimensional Scaling (MDS) that project higher dimensional data onto lower dimensional spaces by preserving the variance in the data [5].
Decision tree:is a predictive statical model that enhances classification tasks [30]. It is often represented visually as a tree to support decision making tasks.
Regression analysis: is a statistical method that aims to estimate the relations between data variables. In other words, it tries to model how dependent certain factors are on others in the data [31].
3
State of the Art
There are a number of surveys that characterize how the integration of auto-mated methods and interactive visualizations are accomplished. Crouser and Chang [32] characterize the human computer collaboration by identifying what contributions are made to the process by the two sides. In their survey, sev-eral papers are grouped according to these types of contributions. According to the authors, humans contribute to the analytical processes mainly by visual perception,visuospatial thinking,creativity anddomain knowledge. On the other side, the computer contributes bydata manipulation, collection and storing, and
bias-free analysis routines. Bertini and Lalanne [16] categorize methods involving data mining and visualization into three:computationally enhanced visualization,
visually enhanced mining, and integrated visualization and mining. Their cate-gorization depends on whether it is the visualization or the automated method that plays the major role in the analysis.
classification, and investigating relations & prediction. We discuss these tasks briefly under each subsection in the following. Our second perspective relates to how the integration of computational tools in visual analysis is achieved. We identify three different categories to characterize the level of integration of com-putational tools in visualization, namely,visualization as a presentation medium,
semi-interactive use of computational methods and the tight integration of in-teractive visual and computational tools. These levels are discussed in detail in Section 3.1.
In the following, we firstly organize the literature under the three analytical task categories and then group the related works further in sub-categories re-lating to the levels of integration. Before we move on to the literature review, we describe the three levels of integration introduced above. Even though we describe each analysis task separately, the categorization into the three common analysis tasks can be seen as a series of steps within a single analysis flow. Start-ing with summarizStart-ing information, proceedStart-ing with findStart-ing groups and last but not least finding relations and trends. One aspect that we do not cover explicitly is the consideration of outliers. Outlier analysis focuses on finding elements that do not follow the common properties of the data and needs to be part of a com-prehensive data analysis process [35]. In this paper, we consider outlier analysis as an inherent part of summarizing information although there are works that are targeted at treating outliers explicitly [36].
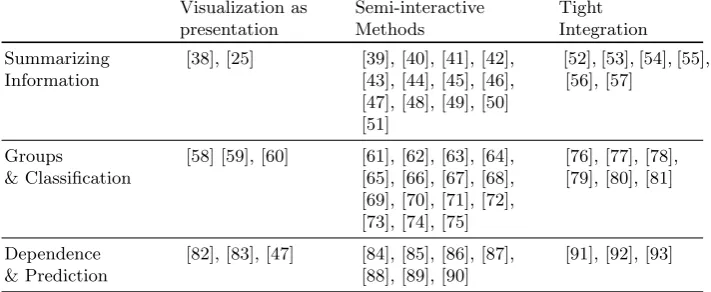
Table 1 groups the investigated literature under the categories listed here. One important point to make with respect to the allocations to sub-groups in this table is that the borders within the categories are not always clear and there is rather a smooth transition between the categories. There are methods that try to address more than one analytical question. For such works, we try to identify the core questions tackled to place them in the right locations in this table. Similar smooth transitions also existent for the levels of integration, and our decision criteria is discussed in the following section.
3.1 Levels of Integration
On the first level of integration of computational tools within visual data anal-ysis, visualization is used as a presentation medium to communicate the results of computational tools. These visualizations are either static representations, or only allow limited interaction possibilities such as zooming, panning, or making selections to highlight interesting parts of the data. A typical example for this category is the use of graphical plotting capabilities of statistical analysis soft-ware such as R [37]. In this system, users often refer to static visualizations to observe the results from computational procedures, such as clustering or fitting a regression line.
The second level of integration involves the use of the computational tool as a separate entity within the analysis where the tool’s inner working is not transparent to the user. In this setting, the user interacts with the computational mechanism either through modifying parameters or altering the data domain
Visualization as presentation
Semi-interactive Methods
Tight Integration
Summarizing Information
[38], [25] [39], [40], [41], [42], [43], [44], [45], [46], [47], [48], [49], [50] [51]
[52], [53], [54], [55], [56], [57]
Groups
& Classification
[58] [59], [60] [61], [62], [63], [64], [65], [66], [67], [68], [69], [70], [71], [72], [73], [74], [75]
[76], [77], [78], [79], [80], [81]
Dependence & Prediction
[82], [83], [47] [84], [85], [86], [87], [88], [89], [90]
[image:8.595.134.490.118.264.2][91], [92], [93]
Table 1. Analytical Tasks vs. Levels of Integration. This 2D structure is used to categorize the reviewed literature in this paper.
visual encodings that are often accompanied by interaction. One potential benefit here is that if problems are just too large so that a comprehensive computational approach is totally unfeasible, for ex., exhaustively searching a high-dimensional parameter space, then some directed steering by the intelligent expert user can help.
The third level constitutes mechanisms where a tight integration of inter-active methods and computational tools is achieved. In these approaches, the automated methods are used seamlessly within interactive visual analysis. So-phisticated interaction mechanisms make the automated tools an integral part of the visualization. Methods in this category also interfere with the inner working of the algorithms and the results of automated tools are communicated imme-diately to the user.
When the second and the third levels are considered, we observe that cate-gorizing a paper is not straightforward since the boundaries between these levels are smooth rather than discrete. In that respect, our classification criteria for level three is whether the integration allows for flexibility and done in a seamless way. If the integration is done at a manner where the automated method exists explicitly as a black-box that allows interaction to a certain level, we categorize the method under level two.
3.2 Summarizing Information
category involve the integration of descriptive statistics, dimension reduction, and factor analysis methods in general.
Visualization as presentation
For this category, we focus only on visualization tools in the biomedical context where there are many examples for visualization as presentation. As databases have become an integral part of dissemination and mining in biomedicine, the consolidation of such experiments data already brought up comprehensive tools for managing and sharing data. To name one, the Cell Centered Database [38] is a public image repository for managing and sharing (3D) imaging data. Next to image databases there is also a wide variety of different visualization tools, including interaction networks, pathway visualizations, multivariate omics data visualizations and multiple sequence alignments that have been reviewed recently by others [24, 25, 95]. In this context, visualization is most commonly used for exploration (hypothesis generation). Common visualization methods in addition to network visualization include scatter plots, profile plots/parallel coordinates and heatmaps with dendograms, while many tools provide combinations of those as linked views. Comprehensive summaries of visualization tools exist for cer-tain areas. Nielsen et al. [25] present a review on tools for visualizing genomes, in particular tools for visualizing sequencing data, genome browsers and com-parative genomics. Gehlenborg et al. [24] present a table of visualization tools in the area of systems biology, categorized by the different focusses of omics data. While most tools still lack in usability and integration, some of the listed tools already provide sophisticated interactive possibilities like annotating, comparing and showing confidence measures and prediction results next to view manipu-lations such as navigating, zooming and filtering. There is also a trend towards implementing web-based solutions to facilitate collaboration.
Semi-interactive Methods
Fig. 1.Data can be visually analyzed on interactively created 2D spaces. (Image by J¨anicke et al. [39])
is a strategy utilized in a number of studies. Kehrer et al. [50] integrate statisti-cal moments and aggregates to interactively analyze collections of multivariate data sets. In the VAR display by Yang et al. [49], the authors represent the dimensions as glyphs on a 2D projection of the dimensions. A multidimensional scaling operation is performed on the glyphs where the distances between the dimensions are optimally preserved in the projection.
In Biomedicine there are only a few visualization tools that are being used to construct integrated web applications for interactive data analysis. Next to the UCSC Genome Browser [47], the IGV [48] is another common genome browser that integrates many different and large data sets and supports a wide variety of data types to be explored interactively. A few similar tools that are tightly integrated with public databases for systems biology are listed by Gehlenborg et al. [24].
In MulteeSum, Meyer et al. [51] used visual summaries to investigate the relations between linked multiple data sets relating to gene expression data. Artemis [44] supports the annotation and visual inspection, comparison and anal-ysis of high-throughput sequencing experimental data sets. The String-DB [45] is a commonly used public comprehensive database for protein-protein interaction that supports visual data analysis by providing interactive network visualiza-tions.
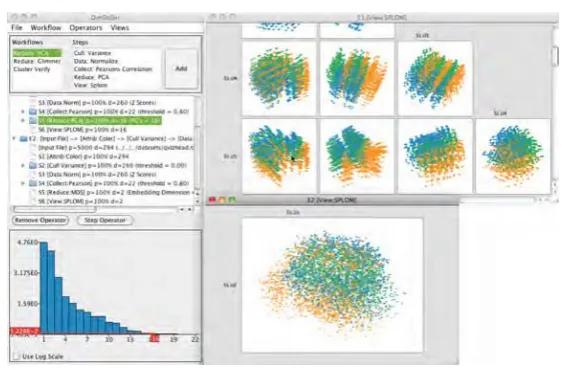
Fig. 2.A selection of data transformations are chained together interactively to achieve dimension reduction. (Image by Ingram et al. [55])
et al. emphasize that knowledge discovery within complex data sets involves many workflows, including accurately representing many formats of source data, merging heterogeneous and distributed data sources, complex database search-ing, integrating results from multiple computational and mathematical analyses, and effectively visualizing properties and results.
Mueller et al. report in a recent work [97] on the successful application of data Glyphs in a disease analyser for the analysis of big medical data sets with auto-matic validation of the data mapping, selection of subgroups within histograms and a visual comparison of the value distributions.
Tight Integration
3.3 Finding groups & Classification
One of the most common analytical tasks in data analysis is to determine the different groups and classifications [5]. Analysts often employ cluster analysis methods that divide data into clusters where data items are assigned to groups that are similar with respect to certain criteria [98]. One aspect of cluster analysis is that it is an unsupervised method, i.e., the number of groups or their labels are not known a priori. However, when the analyst has information on class labels beforehand, often referred to asthe training set, classification algorithms can be utilized instead. Below, we list interactive visualization methods where cluster analysis tools and/or classification algorithms are utilized.
Visualization as presentation
Parallel Sets by Kosara et al. [59] is a successful example where the overlaps between groups is presented with a limited amount of interaction. In the soft-ware visualization domain, Telea and Auber [60] represent the changes in code structures using a flow layout where they identify steady code blocks and when splits occur in the code of a software. Demvsar et al. [58] present a visualization approach for exploratory data analysis of multidimensional data sets and show it’s utility for classification on several biomedical data sets.
Semi-interactive Methods
May and Kohlhammer [65] present a conceptual framework that improves the classification of data using decision trees in an interactive manner. The authors later proposed a technique called SmartStripes [66] where they investigate the relations between different subsets of features and entities. Interactive systems have also been used to help create decision trees [99]. Guo et al. [71] enable the interactive exploration of multivariate model parameters. They visualize the model space together with the data to reveal the trends in the data. Kando-gan [72] discusses how clusters can be found and annotated through an image-based technique. Rinzivillo et al. [73] use a visual technique called progressive clustering where the clustering is done using different distance functions in con-secutive steps. Schreck et al. [74] propose a framework to interactively monitor and control Kohonen maps to cluster trajectory data. The authors state the importance of integrating the expert within the clustering process in achieving good results. gCluto [75] is an interactive clustering and visualization system where the authors incorporate a wide range of clustering algorithms.
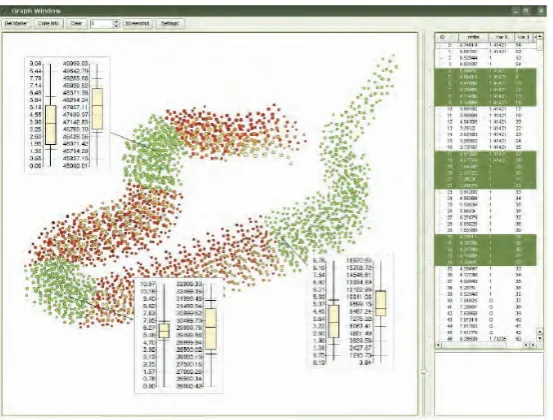
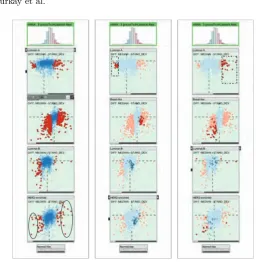
Fig. 3.Results of statistical test computations are communicated through visual en-codings to support the identification of discriminative elements in subgroups. (Image by Turkay et al. [64])
the groupings in the data [64]. Gehlenborg et al. [24] identified that scatter plots, profile plots and heat maps are the most common visualization techniques used in interactive visualization tools for tasks like gene expression analysis. Younesy et al. [67] presents a framework where users have the ability to steer cluster-ing algorithms and visually compare the results. Dynamically evolvcluster-ing clusters, in the domain of molecular dynamics, are analyzed through interactive visual tools by Grottel et al. [68]. The authors describe flow groups and a schematic view that display cluster evolution over time. Mayday is one framework example where a visual analytics framework supports clustering of gene expression data sets [69].
Tight Integration
Fig. 4.Interactive systems have been used to help create and evaluate decision trees (Image by van den Elzen and van Wijk [99])
et al. [77], who present a framework for clustering and visually exploring (3D) expression data. In the domain of molecular dynamics simulation, there are some examples of tight integrations of interactive visualizations, clustering algorithms, and statistics to support the validity of the resulting structures [78], [79].
3.4 Investigating dependence
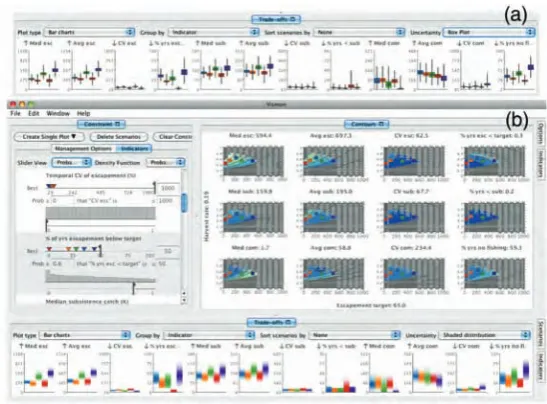
Fig. 5.Visualization helps analysts in making predictions and investigating uncertain-ties in relations within simulation parameters (Image by Booshehrian et al. [87])
Visualization as presentation
In this category, we focus mainly on works from biomedical domain. Krzywinski et al. [82] presents a tool for comparative genomics by visualizing variation in genome structure. Karr et al. [83] present a promising topic, namely computing comprehensive whole-cell model and presenting model predictions for cellular and molecular properties.
Nielsen et al. [25] reviews tools for the visual comparison of genomes. The list of referenced tools includes Circos [82], a visualization presentation method for visualizing synteny in a circular layout. One example referenced is the al-ready mentioned UCSC genome browser [47] that also provides simple phylo-genetic tree graphs. The list also includes tools that integrate computational methods and support the visual analysis of comparative genomics more interac-tively, which are discussed in the next level of integration.
Semi-interactive Methods
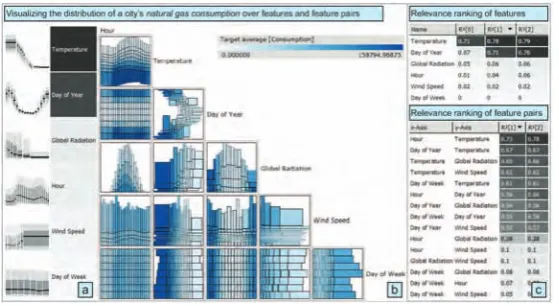
Fig. 6.The process of building regression models can benefit from integrating domain knowledge through interactive visualizations. (Image by M¨uhlbacher and Piringer [86])
relations in multi-variate data sets [89]. Yang et al. [90] analyze the relations between the dimensions of a data set to create a hierarchy that they later use to create lower-dimensional spaces.
Within biomedical applications, Meyer et al. [84] present a synteny browser called MizBee, that provides circular views for the interactive exploration and analysis of conserved synteny relationships at multiple scales. In a later paper, they investigate the dependencies within signals coming from related data sets and present a comparative framework [88].
Tight Integration
Berger et al. [91] introduce an interactive approach that enables the investi-gation of the parameter space with respect to multiple target values. Malik et al. [92] describe a framework for interactive auto-correlation. This is an example where the correlation analysis is tightly coupled with the interactive elements in the visualization solution. Correlation analysis have been integrated as an internal mechanism to investigate how well lower-dimensioal projections relate to the data that they represent [93].
4
Open Problems
as nice add-on and not yet an integrated part in the software development pro-cess [104]. Here we list a number of open problems in relation to the literature we cover in this report.
Problem 1. A topic that needs further attention is to address the uncertainty within the analysis process. The explorative nature of interactive visual analysis creates a vast amount of analysis possibilities and often leads to several plausible results. It is thus of great importance to reduce this space of possibilities and inform the user about the certainty of the results.
Problem 2. Although we have seen several works that involve a tight integration between computational methods and visualization, examples of seamless inte-grations are rare. With this term, we refer to interaction mechanisms where the support from appropriate sophisticated computational tools are provided to the user without the analyst noticing the complexities of the underlying mechanisms. One example to clarify this term could be: applying regression analysis locally on a selection within a 2D scatterplot and presenting the result immediately with a regression line.
Problem 3. One aspect that needs to be investigated further in the integra-tion of interactive and automated methods is theissue of usability. Most of the solutions introduced here require significant literacy in statistics and skills in us-ing different computational methods – which can lead to a demandus-ing learnus-ing curve.
Problem 4. We have seen that most of the visual analysis methods are focussed at particular data types. However, given the current state of data collection and data recording facilities, there are often several data sets related to a phe-nomenon. There is the need for advanced mechanisms that can harness these various sources of information and help experts to run analysis that stretches over several data sets. This issue relates to the goal of developing an integrated visualization environment spanning several biological dimensions, from micro to macro towards an integrated approach. The recent survey by Kehrer and Hauser [105], which illustrates the many different axes along which data com-plexity evolves and how visualization can address these complexities, is a starting point to identify suitable approaches.
5
Future Outlook
As stated within the open problems above, there is a certain need for mecha-nisms to improve the interpretability and usability of interactive visual analysis techniques. Possible methods could be to employsmart labeling and annotation, creatingtemplates that analysts can followfor easier progress, and computation-ally guided interaction mechanisms where automated methods are integrated seamlessly. Such methods need to utilize computational tools as underlying sup-port mechanism for users, one aspect that needs attention in this respect is to maintain the interactivity of the systems. Appropriate computation and sam-pling mechanisms needs to be developed to achieve such systems.
In order to address the uncertainties in visual data analysis, mechanisms that communicate the reliability of the observations made through interactive visualizations need to be developed, e.g., what happens to the observation if the selection is moved slightly along the x-axis of a scatter plot? If such questions are addressed, interactive and visual methods could easily place themselves in the everyday routine of analysts that require precise results.
The ability to define features interactively and refine feature definitions based on insights gained during visual exploration and analysis provides an extremely powerful and versatile tool for knowledge discovery. Future challenges lie in the integration of alternate feature detection methods and their utilization in intel-ligent brushes. Furthermore, integrating IVA and simulations, thus supporting computational steering, offers a wide range of new possibilities for knowledge discovery [106].
An interesting direction for future research relates to improving the usability of analysis processes. Current usability studies often focus on specific parts of a technique. However in order to evaluate the effectiveness of the whole anal-ysis process, there is the need to perform comprehensive investigations on the interpretability of each step of the analysis and study the effects of using compu-tational tools interactively. Such studies can be carried out in forms of controlled experiments where the analysts are given well-determined tasks and are asked to employ particular types of analysis routes. These routes can then be evaluated and compared against non-interactive processes where possible.
A challenging future research avenue for effective HCI is to find answers to the question “What is interesting?” as Interest is an essentially human con-struct [107], a perspective on relationships between data that is influenced by context, tasks, personal preferences, previous knowledge (=expectations) and past experience [108]. For a correct semantic interpretation, a computer would need to understand the context in which a visualization is presented; however, comprehension of a complex context is still beyond computation. In order for a data mining system to be generically useful, it must therefore have some way in which one can indicate what is interesting, and for that to be dynamic and changeable [109].
of objects in the visual world [111]. Attention routing is a promising approach to overcome one very critical problem in visual analytics, particularly of large and heterogeneous data sets: to help users locate good starting points for their analysis. Based onanomaly detection [112], attention routing methods channel the end-users to interesting data subsets which do not conform to standard be-haviour. This is a very promising and important research direction for Knowledge Discovery and Data Mining [?].
Top end research routes encompassing uncountable research challenges are in the application of computational topology [27], [113], [114] approaches for data visualization. Topology-based methods for visualization and visual analysis of data are becoming increasingly popular, having their major advantages in the capability to provide a concise description of the overallstructureof a scientific data set, because subtle features can easily be missed when using traditional visualization methods (e.g. volume rendering or isocontouring), unless correct transfer functions and isovalues are chosen. By visualizing a topology directly, one can guarantee that no feature is missed and most of all solid mathemati-cal principles can be applied to simplify a topologimathemati-cal structure. The topology of functions is also often used for feature detection and segmentation (e.g., in surface segmentation based on curvature) [115].
In this state-of-the-art report, we investigated the literature on how visual-ization and computation support each other to help analysts in understanding complex, heterogeneous data sets. We also focused on to what degree these meth-ods have been applied to biomedical domain. When the three different levels of integration are considered, we have observed that there are not yet many works falling under the third integration level. We have seen that existing applications in this category have significant potential to address the challenges discussed earlier in the paper. However, there exist several open problems, as discussed above, which can motivate the visualization and knowledge discovery commu-nity to carry out research on achieving a tight integration of computational power and capabilities of human experts.
References
1. Card, S.K., Mackinlay, J.D., Shneiderman, B.: Information Visualization: Using Vision to Think. Morgan Kaufmann, San Francisco (1999)
2. Moeller, T., Hamann, B., Russell, R.D.: Mathematical foundations of scientific visualization, computer graphics, and massive data exploration. Springer (2009) 3. Ward, M., Grinstein, G., Keim, D.: Interactive data visualization: foundations,
techniques, and applications. AK Peters, Ltd. (2010)
4. Holzinger, A., Dehmer, M., Jurisica, I.: Knowledge discovery and interactive data mining in bioinformatics - state-of-the-art, future challenges and research directions. BMC Bioinformatics15(Suppl 6) (2014) I1
5. Johnson, R., Wichern, D.: Applied multivariate statistical analysis. Volume 6. Prentice Hall Upper Saddle River, NJ: (2007)
7. Alpaydin, E.: Introduction to machine learning. MIT press (2004)
8. Shneiderman, B.: The eyes have it: A task by data type taxonomy for information visualizations. In: Visual Languages, 1996. Proceedings., IEEE Symposium on, IEEE (1996) 336–343
9. Keim, D.: Information visualization and visual data mining. IEEE transactions on Visualization and Computer Graphics8(1) (2002) 1–8
10. Shneiderman, B.: Inventing discovery tools: combining information visualization with data mining1. Information Visualization1(1) (2002) 5–12
11. Ma, K.L.: Machine learning to boost the next generation of visualization tech-nology. Computer Graphics and Applications, IEEE27(5) (2007) 6–9
12. Tukey, J.W.: Exploratory Data Analysis. Addison-Wesley (1977)
13. Cleveland, W.S., Mac Gill, M.E.: Dynamic graphics for statistics. CRC Press (1988)
14. Thomas, J.J., Cook, K.A.: Illuminating the Path: The Research and Development Agenda for Visual Analytics. National Visualization and Analytics Ctr (2005) 15. Keim, D.A., Kohlhammer, J., Ellis, G., Mansmann, F.: Mastering The
Informa-tion Age-Solving Problems with Visual Analytics. Florian Mansmann (2010) 16. Bertini, E., Lalanne, D.: Investigating and reflecting on the integration of
auto-matic data analysis and visualization in knowledge discovery. SIGKDD Explor. Newsl.11(2) (2010) 9–18
17. Keim, D., Andrienko, G., Fekete, J., G¨org, C., Kohlhammer, J., Melan¸con, G.: Visual analytics: Definition, process, and challenges. Information Visualization (2008) 154–175
18. van Wijk, J.J.: The value of visualization. In: Visualization, 2005. VIS 05. IEEE, IEEE (2005) 79–86
19. Holzinger, A.: Human-computer interaction and knowledge discovery (hci-kdd): What is the benefit of bringing those two fields to work together? In Cuzzocrea, A., Kittl, C., Simos, D., Weippl, E., Xu, L., eds.: Availability, Reliability, and Security in Information Systems and HCI. Volume 8127 of Lecture Notes in Computer Science. Springer Berlin Heidelberg (2013) 319–328
20. Holzinger, A., Jurisica, I. In: Knowledge Discovery and Data Mining in Biomedical Informatics: The future is in Integrative, Interactive Machine Learning Solutions. Springer, Heidelberg, Berlin (2014) in print
21. Holzinger, A.: On knowledge discovery and interactive intelligent visualization of biomedical data - challenges in humancomputer interaction and biomedical informatics. In: DATA 2012, INSTICC (2012) 9–20
22. Fernald, G.H., Capriotti, E., Daneshjou, R., Karczewski, K.J., Altman, R.B.: Bioinformatics challenges for personalized medicine. Bioinformatics27(13) (2011) 1741–1748
23. O’Donoghue, S.I., Gavin, A.C., Gehlenborg, N., Goodsell, D.S., H´erich´e, J.K., Nielsen, C.B., North, C., Olson, A.J., Procter, J.B., Shattuck, D.W., et al.: Vi-sualizing biological datanow and in the future. Nature methods7(2010) S2–S4 24. Gehlenborg, N., O’Donoghue, S., Baliga, N., Goesmann, A., Hibbs, M., Kitano,
H., Kohlbacher, O., Neuweger, H., Schneider, R., Tenenbaum, D., et al.: Visual-ization of omics data for systems biology. Nature methods7(2010) S56–S68 25. Nielsen, C.B., Cantor, M., Dubchak, I., Gordon, D., Wang, T.: Visualizing
genomes: techniques and challenges. Nature methods7(2010) S5–S15
26. Munzner, T.: Visualization principles, Presented at VIZBI 2011: Workshop on Visualizing Biological Data (2011)
28. Pascucci, V., Tricoche, X., Hagen, H., Tierny, J.: Topological Methods in Data Analysis and Visualization: Theory, Algorithms, and Applications (Mathemat-ics+Visualization). Springer, Berlin, Heidelberg (2011)
29. Emmert-Streib, F., de Matos Simoes, R., Glazko, G., McDade, S., Haibe-Kains, B., Holzinger, A., Dehmer, M., Campbell, F.: Functional and genetic analysis of the colon cancer network. BMC Bioinformatics15(Suppl 6) (2014) S6
30. Olshen, L.B.J.F.R., Stone, C.J.: Classification and regression trees. Wadsworth International Group (1984)
31. Cohen, J., Cohen, P., West, S.G., Aiken, L.S.: Applied multiple regres-sion/correlation analysis for the behavioral sciences. Lawrence Erlbaum (2003) 32. Crouser, R.J., Chang, R.: An affordance-based framework for human computation
and human-computer collaboration. Visualization and Computer Graphics, IEEE Transactions on18(12) (2012) 2859–2868
33. Brehmer, M., Munzner, T.: A multi-level typology of abstract visualization tasks. Visualization and Computer Graphics, IEEE Transactions on19(12) (2013) 2376– 2385
34. Kerren, A., Ebert, A., Meyer, J.: Human-centered visualization environments. Springer-Verlag (2006)
35. Filzmoser, P., Hron, K., Reimann, C.: Principal component analysis for compo-sitional data with outliers. Environmetrics20(6) (2009) 621–632
36. Novotn´y, M., Hauser, H.: Outlier-preserving focus+context visualization in par-allel coordinates. Visualization and Computer Graphics, IEEE Transactions on
12(5) (2006) 893–900
37. R Core Team: R: A Language and Environment for Statistical Computing. R Foundation for Statistical Computing, Vienna, Austria. (2013)
38. Martone, M.E., Tran, J., Wong, W.W., Sargis, J., Fong, L., Larson, S., Lamont, S.P., Gupta, A., Ellisman, M.H.: The cell centered database project: an update on building community resources for managing and sharing 3d imaging data. Journal of structural biology161(3) (2008) 220–231
39. J¨anicke, H., B¨ottinger, M., Scheuermann, G.: Brushing of attribute clouds for the visualization of multivariate data. IEEE Transactions on Visualization and Computer Graphics (2008) 1459–1466
40. Johansson, S., Johansson, J.: Interactive dimensionality reduction through user-defined combinations of quality metrics. Visualization and Computer Graphics, IEEE Transactions on15(6) (2009) 993–1000
41. Fernstad, S., Johansson, J., Adams, S., Shaw, J., Taylor, D.: Visual exploration of microbial populations. In: Biological Data Visualization (BioVis), 2011 IEEE Symposium on. (2011) 127 –134
42. Fuchs, R., Waser, J., Gr¨oller, M.E.: Visual human+machine learning. IEEE TVCG15(6) (2009) 1327–1334
43. Oeltze, S., Doleisch, H., Hauser, H., Muigg, P., Preim, B.: Interactive visual anal-ysis of perfusion data. Visualization and Computer Graphics, IEEE Transactions on13(6) (2007) 1392 –1399
44. Carver, T., Harris, S.R., Berriman, M., Parkhill, J., McQuillan, J.A.: Artemis: an integrated platform for visualization and analysis of high-throughput sequence-based experimental data. Bioinformatics28(4) (2012) 464–469
46. Perer, A., Shneiderman, B.: Integrating statistics and visualization for exploratory power: From long-term case studies to design guidelines. Computer Graphics and Applications, IEEE29(3) (2009) 39 –51
47. Kuhn, R.M., Haussler, D., Kent, W.J.: The ucsc genome browser and associated tools. Briefings in bioinformatics14(2) (2013) 144–161
48. Thorvaldsd´ottir, H., Robinson, J.T., Mesirov, J.P.: Integrative genomics viewer (igv): high-performance genomics data visualization and exploration. Briefings in bioinformatics14(2) (2013) 178–192
49. Yang, J., Hubball, D., Ward, M., Rundensteiner, E., Ribarsky, W.: Value and relation display: Interactive visual exploration of large data sets with hundreds of dimensions. Visualization and Computer Graphics, IEEE Transactions on13(3) (2007) 494 –507
50. Kehrer, J., Filzmoser, P., Hauser, H.: Brushing moments in interactive visual analysis. Computer Graphics Forum29(3) (2010) 813–822
51. Meyer, M., Munzner, T., DePace, A., Pfister, H.: Multeesum: A tool for com-parative spatial and temporal gene expression data. Visualization and Computer Graphics, IEEE Transactions on16(6) (2010) 908–917
52. Nam, J., Mueller, K.: Tripadvisorn-d: A tourism-inspired high-dimensional space exploration framework with overview and detail. Visualization and Computer Graphics, IEEE Transactions on19(2) (2013) 291–305
53. Williams, M., Munzner, T.: Steerable, progressive multidimensional scaling. In: Proceedings of the IEEE Symposium on Information Visualization, Washington, DC, USA, IEEE Computer Society (2004) 57–64
54. Endert, A., Han, C., Maiti, D., House, L., North, C.: Observation-level interaction with statistical models for visual analytics. In: Visual Analytics Science and Technology (VAST), 2011 IEEE Conference on, IEEE (2011) 121–130
55. Ingram, S., Munzner, T., Irvine, V., Tory, M., Bergner, S., M¨oller, T.: Dimstiller: Workflows for dimensional analysis and reduction. In: Visual Analytics Science and Technology (VAST), 2010 IEEE Symposium on. (2010) 3 –10
56. Endert, A., Bradel, L., North, C.: Beyond control panels: Direct manipulation for visual analytics. Computer Graphics and Applications, IEEE33(4) (2013) 6–13 57. Turkay, C., Filzmoser, P., Hauser, H.: Brushing dimensions – a dual visual analysis model for high-dimensional data. Visualization and Computer Graphics, IEEE Transactions on17(12) (2011) 2591 –2599
58. Demˇsar, J., Leban, G., Zupan, B.: Freeviz - an intelligent multivariate visualiza-tion approach to explorative analysis of biomedical data. Journal of biomedical informatics40(6) (2007) 661–671
59. Kosara, R., Bendix, F., Hauser, H.: Parallel sets: interactive exploration and visual analysis of categorical data. Visualization and Computer Graphics, IEEE Transactions on12(4) (2006) 558 –568
60. Telea, A., Auber, D.: Code flows: Visualizing structural evolution of source code. Computer Graphics Forum27(3) (2008) 831–838
61. Lex, A., Streit, M., Schulz, H.J., Partl, C., Schmalstieg, D., Park, P.J., Gehlen-borg, N.: StratomeX: visual analysis of large-scale heterogeneous genomics data for cancer subtype characterization. Computer Graphics Forum (EuroVis ’12)
31(3) (2012) 1175?1184
62. Lex, A., Streit, M., Partl, C., Kashofer, K., Schmalstieg, D.: Comparative analysis of multidimensional, quantitative data. IEEE Transactions on Visualization and Computer Graphics (Proceedings Visualization / Information Visualization 2010)
63. Partl, C., Kalkofen, D., Lex, A., Kashofer, K., Streit, M., Schmalstieg, D.: enroute: Dynamic path extraction from biological pathway maps for in-depth experimental data analysis. In: Biological Data Visualization (BioVis), 2012 IEEE Symposium on, IEEE (2012) 107–114
64. Turkay, C., Lex, A., Streit, M., Pfister, H., Hauser, H.: Characterizing cancer subtypes using dual analysis in caleydo stratomex. IEEE Computer Graphics and Applications34(2) (2014) 38–47
65. May, T., Kohlhammer, J.: Towards closing the analysis gap: Visual generation of decision supporting schemes from raw data. In: Computer Graphics Forum. Volume 27., Wiley Online Library (2008) 911–918
66. May, T., Bannach, A., Davey, J., Ruppert, T., Kohlhammer, J.: Guiding feature subset selection with an interactive visualization. In: Visual Analytics Science and Technology (VAST), 2011 IEEE Conference on, IEEE (2011) 111–120 67. Younesy, H., Nielsen, C.B., M¨oller, T., Alder, O., Cullum, R., Lorincz, M.C.,
Karimi, M.M., Jones, S.J.: An interactive analysis and exploration tool for epige-nomic data. In: Computer Graphics Forum. Volume 32., Wiley Online Library (2013) 91–100
68. Grottel, S., Reina, G., Vrabec, J., Ertl, T.: Visual verification and analysis of cluster detection for molecular dynamics. IEEE Transactions on Visualization and Computer Graphics13(6) (2007) 1624–1631
69. Dietzsch, J., Gehlenborg, N., Nieselt, K.: Mayday-a microarray data analysis workbench. Bioinformatics22(8) (2006) 1010–1012
70. Seo, J., Shneiderman, B.: Interactively exploring hierarchical clustering results. IEEE Computer35(7) (2002) 80–86
71. Guo, Z., Ward, M.O., Rundensteiner, E.A.: Model space visualization for mul-tivariate linear trend discovery. In: Proc. IEEE Symp. Visual Analytics Science and Technology VAST 2009. (2009) 75–82
72. Kandogan, E.: Just-in-time annotation of clusters, outliers, and trends in point-based data visualizations. In: Visual Analytics Science and Technology (VAST), 2012 IEEE Conference on, IEEE (2012) 73–82
73. Rinzivillo, S., Pedreschi, D., Nanni, M., Giannotti, F., Andrienko, N., Andrienko, G.: Visually driven analysis of movement data by progressive clustering. Infor-mation Visualization7(3) (2008) 225–239
74. Schreck, T., Bernard, J., Tekusova, T., Kohlhammer, J.: Visual cluster analysis of trajectory data with interactive Kohonen Maps. In: IEEE Symposium on Visual Analytics Science and Technology, 2008. VAST’08. (2008) 3–10
75. Rasmussen, M., Karypis, G.: gCLUTO–An Interactive Clustering, Visualization, and Analysis System., University of Minnesota, Department of Computer Science and Engineering, CSE. Technical report, UMN Technical Report: TR (2004) 76. Ahmed, Z., Weaver, C.: An Adaptive Parameter Space-Filling Algorithm for
Highly Interactive Cluster Exploration. In: Procedings of IEEE Symposium on Visual Analytics Science and Technology (VAST). (2012)
77. Rubel, O., Weber, G., Huang, M.Y., Bethel, E., Biggin, M., Fowlkes, C., Lu-engo Hendriks, C., Keranen, S., Eisen, M., Knowles, D., Malik, J., Hagen, H., Hamann, B.: Integrating data clustering and visualization for the analysis of 3D gene expression data. Computational Biology and Bioinformatics, IEEE/ACM Transactions on7(1) (2010) 64 –79
78. Turkay, C., Parulek, J., Reuter, N., Hauser, H.: Interactive visual analysis of temporal cluster structures. Computer Graphics Forum30(3) (2011) 711–720 79. Parulek, J., Turkay, C., Reuter, N., Viola, I.: Visual cavity analysis in molecular
80. Turkay, C., Parulek, J., Reuter, N., Hauser, H.: Integrating cluster formation and cluster evaluation in interactive visual analysis. In: Proceedings of the 27th Spring Conference on Computer Graphics, ACM (2011) 77–86
81. Choo, J., Lee, H., Kihm, J., Park, H.: ivisclassifier: An interactive visual analytics system for classification based on supervised dimension reduction. In: Visual Analytics Science and Technology (VAST), 2010 IEEE Symposium on, IEEE (2010) 27–34
82. Krzywinski, M., Schein, J., Birol, ˙I., Connors, J., Gascoyne, R., Horsman, D., Jones, S.J., Marra, M.A.: Circos: an information aesthetic for comparative ge-nomics. Genome research19(9) (2009) 1639–1645
83. Karr, J.R., Sanghvi, J.C., Macklin, D.N., Gutschow, M.V., Jacobs, J.M., Boli-val Jr, B., Assad-Garcia, N., Glass, J.I., Covert, M.W.: A whole-cell computa-tional model predicts phenotype from genotype. Cell150(2) (2012) 389–401 84. Meyer, M., Munzner, T., Pfister, H.: Mizbee: a multiscale synteny browser.
Vi-sualization and Computer Graphics, IEEE Transactions on15(6) (2009) 897–904 85. Piringer, H., Berger, W., Krasser, J.: Hypermoval: Interactive visual validation of regression models for real-time simulation. In: Proceedings of the 12th Euro-graphics / IEEE - VGTC Conference on Visualization. EuroVis’10, Aire-la-Ville, Switzerland, Switzerland, Eurographics Association (2010) 983–992
86. Muhlbacher, T., Piringer, H.: A partition-based framework for building and vali-dating regression models. Visualization and Computer Graphics, IEEE Transac-tions on19(12) (2013) 1962–1971
87. Booshehrian, M., M¨oller, T., Peterman, R.M., Munzner, T.: Vismon: Facilitating analysis of trade-offs, uncertainty, and sensitivity in fisheries management decision making. In: Computer Graphics Forum. Volume 31., Wiley Online Library (2012) 1235–1244
88. Meyer, M., Wong, B., Styczynski, M., Munzner, T., Pfister, H.: Pathline: A tool for comparative functional genomics. In: Computer Graphics Forum. Volume 29., Wiley Online Library (2010) 1043–1052
89. Elmqvist, N., Dragicevic, P., Fekete, J.: Rolling the dice: Multidimensional visual exploration using scatterplot matrix navigation. Visualization and Computer Graphics, IEEE Transactions on14(6) (2008) 1539–1148
90. Yang, J., Ward, M.O., Rundensteiner, E.A., Huang, S.: Visual hierarchical di-mension reduction for exploration of high didi-mensional datasets. In: VISSYM ’03: Proceedings of the symposium on Data visualisation 2003, Eurographics Associ-ation (2003) 19–28
91. Berger, W., Piringer, H., Filzmoser, P., Gr¨oller, E.: Uncertainty-aware exploration of continuous parameter spaces using multivariate prediction. Computer Graphics Forum30(3) (2011) 911–920
92. Malik, A., Maciejewski, R., Elmqvist, N., Jang, Y., Ebert, D.S., Huang, W.: A correlative analysis process in a visual analytics environment. In: Visual Analytics Science and Technology (VAST), 2012 IEEE Conference on, IEEE (2012) 33–42 93. Turkay, C., Lundervold, A., Lundervold, A., Hauser, H.: Representative factor
generation for the interactive visual analysis of high-dimensional data. Visualiza-tion and Computer Graphics, IEEE TransacVisualiza-tions on18(12) (2012) 2621–2630 94. Mirkin, B.: Core Concepts in Data Analysis: Summarization, Correlation and
Visualization: Summarization, Correlation and Visualization. Springer (2011) 95. Procter, J.B., Thompson, J., Letunic, I., Creevey, C., Jossinet, F., Barton, G.J.:
96. Otasek, D., Pastrello, C., Holzinger, A., Jurisica, I. In: Visual Data Mining: Ef-fective Exploration ofthe Biological Universe. Springer, Heidelberg, Berlin (2014) in print
97. Mueller, H., Reihs, R., Zatloukal, K., Holzinger, A.: Analysis of biomedical data with multilevel glyphs. BMC Bioinformatics15(Suppl 6) (2014) S5
98. Tan, P., Steinbach, M., Kumar, V.: Introduction to data mining. Pearson Addison Wesley Boston (2006)
99. van den Elzen, S., van Wijk, J.J.: Baobabview: Interactive construction and analysis of decision trees. In: Visual Analytics Science and Technology (VAST), 2011 IEEE Conference on, IEEE (2011) 151–160
100. Hair, J., Anderson, R.: Multivariate data analysis. Prentice Hall (2010)
101. Secrier, M., Schneider, R.: Visualizing time-related data in biology, a review. Briefings in bioinformatics (2013) bbt021
102. Chen, C.: Top 10 unsolved information visualization problems. Computer Graph-ics and Applications, IEEE25(4) (2005) 12–16
103. Jeanquartier, F., Holzinger, A. In: On Visual Analytics And Evaluation In Cell Physiology: A Case Study. Springer, Heidelberg, Berlin (2013) 495–502
104. Holzinger, A.: Usability engineering methods for software developers. Communi-cations of the ACM48(1) (2005) 71–74
105. Kehrer, J., Hauser, H.: Visualization and visual analysis of multifaceted scientific data: A survey. Visualization and Computer Graphics, IEEE Transactions on
19(3) (2013) 495–513
106. Matkovic, K., Gracanin, D., Jelovic, M., Hauser, H.: Interactive visual steering-rapid visual prototyping of a common rail injection system. Visualization and Computer Graphics, IEEE Transactions on14(6) (2008) 1699–1706
107. Beale, R.: Supporting serendipity: Using ambient intelligence to augment user exploration for data mining and web browsing. International Journal of Human-Computer Studies65(5) (2007) 421–433
108. Holzinger, A., Kickmeier-Rust, M., Albert, D.: Dynamic media in computer sci-ence education; content complexity and learning performance: Is less more? Ed-ucational Technology & Society11(1) (2008) 279–290
109. Ceglar, A., Roddick, J.F., Calder, P.: Guiding knowledge discovery through in-teractive data mining. Managing data mining technologies in organizations: tech-niques and applications (2003) 45–87
110. Chau, D.H., Myers, B., Faulring, A.: What to do when search fails: finding information by association. In: Proceeding of the twenty-sixth annual SIGCHI conference on Human factors in computing systems, ACM (2008) 999–1008 111. Olshausen, B.A., Anderson, C.H., Vanessen, D.C.: A neurobiological model of
visual-attention and invariant pattern-recognition based on dynamic routing of information. Journal of Neuroscience13(11) (1993) 4700–4719
112. Chandola, V., Banerjee, A., Kumar, V.: Anomaly detection: A survey. ACM Computing Surveys (CSUR)41(3) (2009) 15
113. Carlsson, G.: Topology and data. Bulletin of the American Mathematical Society
46(2) (2009) 255–308
114. Edelsbrunner, H., Harer, J.L.: Computational Topology: An Introduction. Amer-ican Mathematical Society, Providence (RI) (2010)
![Fig. 4. Interactive systems have been used to help create and evaluate decision trees(Image by van den Elzen and van Wijk [99])](https://thumb-us.123doks.com/thumbv2/123dok_us/1528097.105399/14.595.187.430.117.377/interactive-systems-create-evaluate-decision-trees-image-elzen.webp)