City, University of London Institutional Repository
Citation
:
Wang, X., Yan, Y., Sun, Z. and Liu, C. (2014). The Vortical Structures in the Rear
Separation and Wake Produced by a Supersonic Micro-Ramp. Flow, Turbulence and
Combustion, 93(1), pp. 25-36. doi: 10.1007/s10494-014-9531-y
This is the accepted version of the paper.
This version of the publication may differ from the final published
version.
Permanent repository link:
http://openaccess.city.ac.uk/7376/
Link to published version
:
http://dx.doi.org/10.1007/s10494-014-9531-y
Copyright and reuse:
City Research Online aims to make research
outputs of City, University of London available to a wider audience.
Copyright and Moral Rights remain with the author(s) and/or copyright
holders. URLs from City Research Online may be freely distributed and
linked to.
The Vortical Structures in the Rear Separation and Wake Produced by a
Supersonic Micro-Ramp
Xiao Wang
1, Zhengzhong Sun
2, Yonghua Yan
1, Chaoqun Liu
11. University of Texas at Arlington, Arlington, Texas 76019, USA
2. Delft University of Technology, Delft, 2629HS, the Netherlands
Abstract
The vortical structures in the rear separation and wake region produced by a micro -ramp that immersed in a
supersonic turbulent boundary layer are investigated. The small scale separation close to the trailing edge was
reveled and this confirms the previous experimental observation. Between the reverse region and surrounding fast
moving flow, a three-dimensional shear layer was formed, and vortices are generated. By using vortex line method,
the spiral points were understood as the cross-sections of the Ω-shaped vortices that follow the shape of the
separation. The vortical structure was analogous to that in the wake region, where similar Ω-shaped vortex can be
observed which follows the deficit region caused by the micro-ramp. Finally, the revealed flow topology was
conceived beneficial to studying the wall bounded turbulence which involves similar vortical structure s but in a
smaller scale, while the vortical pattern in the current micro-ramp wake is larger.
Keywords: Micro-vortex generator; Flow control; Vortex
Nomenclature
a∞ sound speed
c micro ramp chord length
h micro ramp height
H boundary layer shape factor
Ma Mach number
nx, ny ,nz number of grid nodes in streamwise, wall-normal and spanwise direction respectively
Reθ Reynolds number based on boundary layer momentum thickness
u instantaneous streamwise velocity
uτ friction velocity
U∞ free stream velocity
w micro ramp width
x streamwise coordinate
z spanwise coordinate
δ boundary layer thickness
δ* boundary layer displacement thickness
Δt differential time step
θ boundary layer momentum thickness
1. Introduction
The micro-ramp is a type of micro-vortex generator (MVG), which has been demonstrated as an effective tool in
reducing flow separation caused by shock wave/boundary layer interactions (SWBLIs) [1-4]. In order to establish a better design for the micro-ramp, fundamental studies have been carried out to understand the flow physics around
the micro-ramp [5-11]. New observations have been reported recently, such as the ring-shaped vortex and the interaction mechanism between the ring vortex and shock wave[6-8,10,11]. These larger scale structures take place in the wake region, which is relatively downstream of the micro-ramp. However, less focus has been placed on the
smaller scale structures in the flow close to the micro-ramp. A few forgoing studies have investigated the flow that
takes place around the micro-ramp[10,12]. Among those explorations, a common observation is the flow separation at the junction between the micro-ramp trailing edge and the flow floor. This rear separation was first observed by
Babinsky et al.[1] through oil flow visualization as oil accumulation happened there (see Fig. 1(a)). Continued investigations were carried out by Li et al.[10] using implicit large eddy simulation (ILES), through which the detailed flow topology around the micro-ramp has been studied. By plotting the limiting streamlines, spiral points
were observed close to the place where flow separation happened (see Fig. 2(a)), and it was then proposed as an
imprint of an additional secondary vortex. The following experiment carried out by Lu et al.[12] confirmed the separation regions by surface flow visualization using bands of fluorescent mixture (see Fig. 1(b)). By
post-processing the acquired visualization images, the spiral points were clearly revealed (see Fig. 2(b).). In Fig. 2(c), a
vortex filaments were visualized close to the trailing edge.
The current paper is a continued study on the particular flow separation based on the database acquired
from ILES results in the numerical group of University of Texas at Arlington. Instead of explaining the flow through
surface flow topology which poses limitations on the explanation of flow with great three -dimensional effects,
additional analysis, such as velocity distribution and vortex line method, has been used. The predefined flow
happened close to the rear separation region is updated and a vortical structure is formed to relate the spiral points.
By plotting the vortex lines at the rear separation, a similarity between the rear separation and the wake region is
realized. The vortex line method is then applied towards the wake region, where similar vortical structure is
revealed. The analogous vortical structure in different parts of the flow is finally proposed as a beneficial issue for
(a)
(b)
Figure 1. Experimental visualization of the rear separation.
(a) Trailing edge separations in the oil flow visualization by Babinsky et al.[1]. (b) Trailing edge separation in the surface flow visualization by Lu et al.[12].
[image:4.612.128.337.148.318.2]
(a) (b) (c)
Figure 2. The spiral points close to the trailing edge: (a) The spiral points close to the trailing edge (reproduction
according to [10]). (b) The spiral points in the experiment of Lu et al.[12]; (c) The vortex filaments from the experiment of Lu et al.[13].
2.Numerical algorithm and case description
Since the current study is based on the substantial and mature ILES database that have been explained extensively
in the previous publications and conference proceedings, the numerical algorithm and case description are briefly
introduced in this section, for the detailed knowledge of utilized ILES methodology the readers can refer to the
previous publications[6,7,9-11].
2.1 Numerical algorithm
The non-dimensional Navier-Stokes equations in conservation form written in Cartesian coordinates were solved
as the governing equations. A fifth-order WENO scheme was used to discretize the convective terms. A fourth-order
central difference scheme was used to discretize the second-order transport terms. The explicit third-order TVD-type
Runge-Kutta scheme was utilized for temporal discretization. The Courant-Friedrichs-Lewy (CFL) is set to 0.8 in
the current simulation. The physical time marching step can be estimated through Δt=CFL·Δx/(a∞+U∞), where Δx is
the smallest streamwise cell length, a∞ is the sound speed and U∞ is the free stream velocity. The time step is thus
Δt=3×10⁻⁹s. A total of 9,300 time steps were perform after the transient shock wave leave the domain, corresponding
a total duration of 0.028ms.
Adiabatic, zero-pressure gradient and non-slip condition was applied towards the flow floor. Both the upper
boundary and outflow boundary were specified as non-reflection condition thus no flow reflection was assured. The
side boundaries were treated as periodic boundary. In order to guarantee a fully turbulent flow, the inflow condition
of u, v, w, and ρ was treated with two parts, the mean component and the fluctuation component. Both types of
profiles were imported from the direct numerical simulation (DNS) results and scaled into current grid system
through third-order spline interpolation. The pressure at the inflow was set as uniform. The detailed treatment steps
can be referred in [6].
2.2 Case description
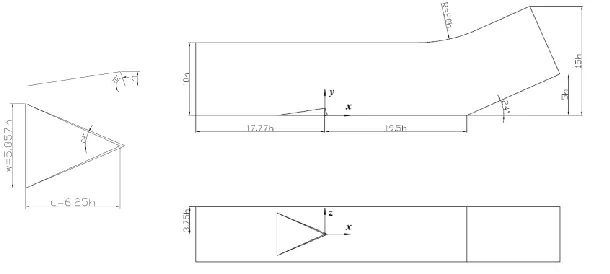
The micro-ramp followed the suggestion of Anderson et al.[14], the width and chord length of the device are
w=5.875h and c=6.25h, respectively. A declining angle of 70 degrees is applied. The geometry of the micro-ramp is
[image:5.612.87.392.397.534.2]plotted in Fig. 3.
Fig. 3. The dimensions of the micro-ramp and the computational domain
Table 1. The flow condition and undisturbed boundary layer parameters.
Parameter Quantity
Ma∞ 2.5
h/δ99 0.431
δ*/h 0.323
θ/h 0.229
H 1.407
uτ/U∞ 0.0552
Reθ 5760
The simulated flow was at Ma=2.5. The inlet portion of simulation domain extends approximately 11.52h, a ratio
of h/δ99=0.431 is hence achieved in the immediate upstream of the micro-ramp, which means the micro-ramp is
deeply immersed inside the boundary layer. The displacement thickness of the undisturbed boundary layer is
δ*=0.323h, and the momentum thickness is θ=0.229h, the incompressible shape factor is then determined to be
H=1.407. The flow information is summarized in Table 1.
The simulation domain has a streamwise extension of 50.07h. The coordinate origin is located at the junction of
the micro-ramp trailing edge and the flow floor. The inlet is place at x/h=-17.77. The floor behind the micro-ramp
remains flat for a length of 19.5h, after which a compression ramp is installed. The half width of the domain is 3.75h
and the height extends from 10h to 15h. The computational domain is sketched in Fig. 3. A grid system of
nx×ny×nz=1600×190×128 nodes is implemented to discretize the flow domain. Both code validation and grid refinement have been performed to make sure the simulation is carried out on a confident groun d9.
3. Results and analysis
3.1 Two-Dimensional Representation of the Rear Separation
According to the previous studies, the separation region is recognized as a common phenomenon. By plotting the
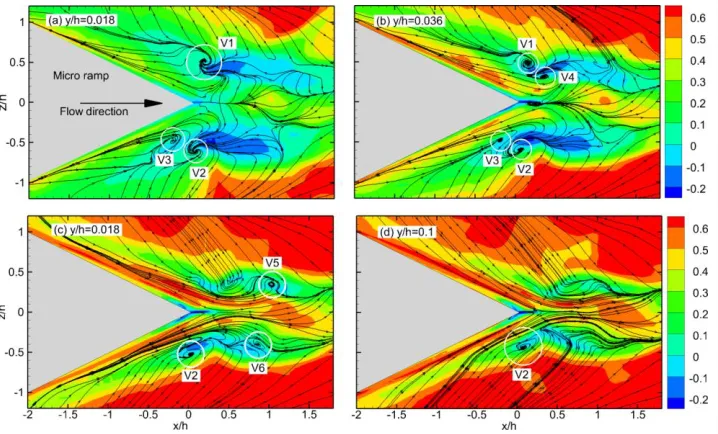
contours of u close to the micro-ramp at different heights, the flow organization is evident. Fig. 4(a) is the contour of
u at y/h=0.018. Two regions with reverse u are clearly observed and their positions are similar to the observations in
oil flow visualization (see Fig. 1(a)). The reverse flow obtains a maximum magnitude of approximately 0.2U∞ at this
height and has a streamwise extension of about 2.0h. Thus a shear is formed at the border of the reverse region and
surrounding downstream moving fluid. According to the overlaid projected streamlines, three vortices (labeled as
V1, V2 and V3 in Fig. 4(a)) are produced at the edge of the reverse regions, among which V2 and V3 appear in pair
and have counter rotation, while V1 stays at the outer edge. Note that the slices in Fig. 4 are extracted from the same
snapshot as that in Fig. 2(a), the revealed vortices can then be taken as the cross -sections of the vortex filament. The
contour in Fig. 4(b) is at y/h=0.036. The reverse regions at this height contract in area and be come slimmer. V2 and
V3 are still visualized at the edge, and both of them shifted slightly in position, which can be compared in table II.
Figure 4(c) and (d) represent the contour at y/h=0.047 and 0.100, respectively, where the reverse flow is weaker and
produced at the downstream edges of the reverse region. The detailed spatial coordinates of the revealed vortices are
[image:7.612.56.415.187.404.2]summarized in Table 2.
Fig. 4. Instantaneous contour of u at four heights with projected streamlines.
Table 2. The coordinates of the revealed vortices in Fig. 4.
Vortex y/h=0.018 y/h=0.036 y/h=0.047 y/h=0.100
V1 (x/h,z/h) (0.192,0.514) (0.154,0.489) - -
V2 (x/h,z/h) (0.085,-0.600) (0.057,-0.600) (0.036,-0.529) (0.075,-0.438)
V3 (x/h,z/h) -0.197,-0.473 (-0.191,-0.471) - -
V4 (x/h,z/h) - (0.351,0.318) - -
V5 (x/h,z/h) - - (1.033,0.349) (0.864,-0.401)
V6 (x/h,z/h) - - - -
3.2 Three-dimensional representation of the rear separation
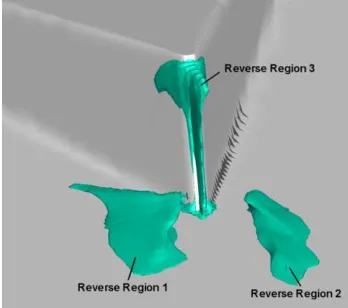
By examining the evolution of the reverse flow along the wall-normal direction, it obtains a larger base portion
and a thinner body at higher elevation. A mountain-shaped reverse flow region can thus be imagined. The
three-dimensional representation of the separation region is illustrated in Fig. 5 through isosurface of u with a value of
[image:7.612.69.393.444.537.2]0.01U∞. All the stronger reverse flow is inside the current isosurface. It should be noted that a third reverse flow
region is present along the trailing edge.
Till this point, questions can be raised regarding the revealed vortices in the Fig. 4: what is their
three-dimensional organization? Are they related in space? These questions can be answered by analyzing the vortex line.
In Fig. 6 five vortex lines are plotted in the vicinity of reverse region 1. Note that the second vortex line from left in
Fig. 6(a) passes through V2 in Fig. 4(a). All the vortex lines originate from the wall surface where significant
vorticity magnitude is present. Once lifted away from the wall, they follow the inclined surface of the separation
region, after passing the summit, it drops in height, but, however, still follow the isosurface slope. The appearance of
the vortex line forms an Ω-like shape. Similar analysis has been carried out on the vortex lines around reverse region
2 and Ω-like vortex lines are also resulted. The vortices as visualized in Fig. 6 can hence be concluded as imprints of
the omega-shaped filaments and they are produced due to the strong shear between the core reverse flow and the
[image:8.612.144.318.309.463.2]surrounding fast-moving flow.
Fig. 5. The three-dimensional representation of the rear separation regions using isosurface of u=-0.01U∞.
(a) (b)
[image:8.612.84.384.484.623.2]3.3 Similar vortical structure in the micro-ramp wake
Recalling the flow organization in the wake of the micro-ramp, a momentum deficit is at the center and a curved
shear layer is then formed between the deficit region and free stream. Due to the instability of the shear layer,
arch-shaped Kelvin-Helmholtz vortices are generated. This turbulent activity that happens in the wake has been
substantially discussed by Sun et al8. Comparing the two flow structures at the rear separation and the wake region,
they are conceived to be similar, as both obtain low speed flow in the center and higher speed in the outer flow and a
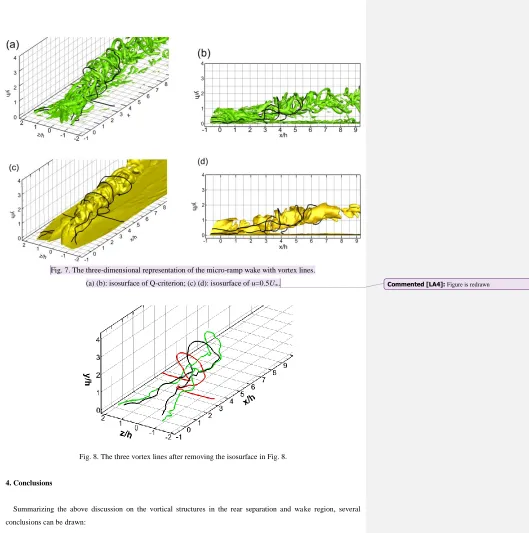
shear layer in between are plotted. Q-criterion is chosen to feature the isosurface in Fig. 7(a) and (b), so that the
arch-shaped K-H vortices together with the streamwise vortices can be visualized simultaneously. The vortex lines
follow the shape of the Q-isosurface, especially the round head portion.
In Fig. 7(c)(d), a streamwise velocity component of u=0.5U∞ is chosen to represent the momentum deficit in the
wake, all the vortex lines curve at the top to wrap the deficit region. These two observations, especially the later on e,
are rather similar as that in Fig. 6 in which the vortex lines also wrap the reverse regions.
By removing the isosurface, the three vortex lines are solely depicted in Fig. 8 with different colors. The most
upstream vortex line (red) exhibits a strict Ω shape, suggesting this larger scale vortex receives withdraws vorticity
from the near wall region. The next two downstream vortex lines (black and green) obtain a round head, however
they both have stretched legs extending upstream, which means streamwis e vortices contribute to these two vortices.
The transformed Ω-shaped vortex line (black and green) resembles the similar vortex line that takes place in the
turbulent boundary layer which shows up as the hairpin vortex. Due to the similarity, studying the micro-ramp flow
can also shed some light into the understanding of wall bounded turbulence. Because of its larger scale, it provides a
Fig. 7. The three-dimensional representation of the micro-ramp wake with vortex lines.
[image:10.612.133.344.418.555.2](a) (b): isosurface of Q-criterion; (c) (d): isosurface of u=0.5U∞.
Fig. 8. The three vortex lines after removing the isosurface in Fig. 8.
4. Conclusions
Summarizing the above discussion on the vortical structures in the rear separation and wa ke region, several
conclusions can be drawn:
1. The flow separation has been clearly revealed and the current numerical result agrees with the
experimental observation through the velocity contours.
2. The spiral points at the rear of the micro-ramp can now be understood as the cross-sections of the small
scale vortices. Through the vortex line method, these vortices take the form of Ω-like shape and wrap the
recirculation region.
3. The micro-ramp wake obtains similar flow structure as the rear separation where high speed flow
wrapping the low speed with shear layer in between. Similar Ω-shaped vortex lines have been a proof. However the
vortex lines in the wake region may exhibit extended leg portions corresponding to the streamwise vortices. A
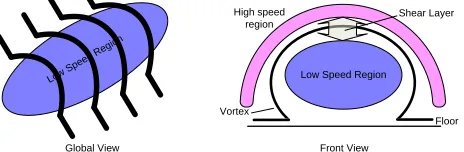
[image:11.612.49.416.136.465.2] [image:11.612.120.352.330.406.2]conceptual model for the common vortical structure for both the rear separation and the wake region is sketched in
Fig. 9.
4. Similarity between the current vortical structure and that in the wall bounded turbulence can be
proposed. As the flow structure has larger scale, further effort to the micro-ramp flow is desired to be mirrored into
the smaller scale wall turbulence.
High speed region
Vortex
Floor Low Speed Region
Shear Layer
Low Spee
d Reg ion
Front View Global View
Fig. 9. The conceptual model of the flow topology.
References
[1] H. Babinsky, Y. Li and C. W. Pitt Ford, Microramp control of supersonic oblique shock-wave/boundary-layer interactions,
AIAA Journal, 47 (2009).
[2] T. Neil and H. Babinsky, Microvortex generators applied to flowfield containing a normal shock wave and diffuser, AIAA
Journal, 49 (2011).
[3] M. Rybalko, H. Babinsky and E. Loth, VGs for a normal SBLI with a downstream diffuser, AIAA paper 2010-4464 (2010).
[4] A. J. Pierce, Q. Li, Y. Shih, F. K. Lu and C. Liu, Interaction of microvortex generator flow with ramp-induced
shock/boundary-layer interactions, AIAA paper 2011-32 (2011).
[5] W. R. Nolan and H. Babinsky, Characterization of micro-vortex generators in supersonic flows, AIAA paper 2011-71
(2011).
[6] Y. Yan, Q. Li, C. Liu, A. Pierce, F. Lu and P. Lu, Numerical discovery and experimental confirmation of vortex ring generation by microramp vortex generator, Applied Mathematical Modelling
[ 7] Q. Li and C. Liu, Implicit LES for supersonic microramp vortex generator: new discoveries and new mechanism, Modelling
and Simulation in Engineering 2012 (2012).
[8] Z. Sun, F. F. J. Schrijer, F. Scarano, B. W. van Oudheusden, The three-dimensional flow organization past a micro-ramp in a
[9] Q. Li and C. Liu, Declining angle effects of the trailing edge of a microramp vortex generator, Journal of Aircraft 47 (2010).
[10] Q. Li, Y. Yan, P. Lu, A. Pierce, C. Liu and F. Lu, Numerical and experimental studies on the separation topology of the
MVG controlled flow at M=2.5, AIAA paper 2011-72 (2011).
[11] Y. Yan, Q. Li, C. Liu and F. Lu, Numerical, experimental and theoretical studies on mechanism of K-H instability and ring generation behind supersonic MVG, AIAA paper 2011-676 (2011).
[12] F. K. Lu, A. J. Pierce, Y. Shih, C. Liu and Q. Li, Experimental and numerical study of flow topology past micro vortex
generators, AIAA paper 2010-4463 (2010).
[13] F. K. Lu, Q. Li, Y. Shih, A. J. Pierce and C. Liu, Review of micro vortex generators in high speed flow, AIAA paper
2011-31 (2011)
![Figure 2. The spiral points close to the trailing edge: (a) The spiral points close to the trailing edge (reproduction according to [10])](https://thumb-us.123doks.com/thumbv2/123dok_us/1529543.105547/4.612.128.337.148.318/figure-spiral-points-trailing-spiral-trailing-reproduction-according.webp)