Continuous Total Spontaneous Resolution
René R. E. Steendam*
and Joop H. ter Horst
University of Strathclyde, EPSRC Centre for Innovative Manufacturing in Continuous Manufacturing and Crystallization (CMAC),
Strathclyde Institute of Pharmacy and Biomedical Sciences,
Technology and Innovation Centre, 99 George Street, Glasgow G1 1RD, United Kingdom
ABSTRACT
pharmaceutical products in an industrial setting. This continuous manufacturing approach provides many benefits including ease of operation, consistent product quality and a high degree of process control.
INTRODUCTION
Separations in complex multicomponent systems are key processes in the chemical industry.1 Chiral separation is particularly essential as the biological activity of a chiral compound often depends on its handedness.2
Such chiral separations are challenging processes since the physical properties of left- and right-handed molecules are the same in isolation. Over the years, methods have been reported with which only one form can be obtained.3
Increasingly more pharmaceutical drugs have to be produced in single enantiomeric form and the development of new approaches is therefore of crucial importance to industry and society.4
Crystallization is an often preferred means to separate chiral molecules as it is cheap, widely applicable, easy to use and highly selective.3
An example of a crystallization-based resolution approach is preferential crystallization with which a supersaturated racemic solution is seeded with solids of the target chiral form.5
As a result of increasing the supersaturation, the chirally-pure seed crystals grow by selectively incorporating molecules of the same handedness. During growth, the solution is depleted from the crystallizing chiral form and this leads to an excess of the unseeded chiral form in solution. The challenge in preferential crystallization is preventing the unseeded chiral form from crystallizing.
the complete conversion of a racemic solution into crystals consisting of one chiral form.5 In addition, without seeding the SOAT approach can be used to produce crystals of single chirality through a process known as total spontaneous resolution.6
During total spontaneous resolution, an initially formed single enantiopure crystal induces secondary nucleation through mechanical breakage7
, shear nucleation8
or breeding9
, to give additional crystals which are of the same chiral form as the initial crystal. Total spontaneous resolution has been applied to both achiral10
and chiral11, 12
molecules in batch processes.
Continuous manufacturing has been adopted by the pharmaceutical industry and the FDA as the way forward with benefits such as consistent high product quality, efficient use of chemicals and improved control over process conditions.13, 14
These benefits are for example reflected by continuous anti-solvent processes15, 16
, continuous oscillatory flow process17, 18
and the combination of the synthesis, crystallization and formulation of active pharmaceutical ingredients in a continuous end-to-end process.19
Extending continuous crystallization processes to the deracemization of chiral compounds integrated with racemization reactions was found to be feasible based on mathematical modelling.20
However, an experimental proof of such a process remains so far unreported. In this contribution we investigate the possibility to continuously crystallize one chiral form in favour over the other for a compound that is achiral in solution. For our experiments we used the ionic compound sodium bromate to represent a chiral pharmaceutical system in which the pharmaceutical racemizes in solution. Sodium bromate resembles a conglomerate-forming chiral molecule as it crystallizes in a non-centrosymmetric space group, making it chiral in the solid state.21
First, we discuss which conditions are expected to lead to enantiopure or a racemic mixture of crystals. Next, boundary conditions were tested in which the production rate would compensate for the crystal removal rate. In the subsequent section start-up and other process conditions were tested on their influence on the steady state. Finally, the effects of the residence time τs and the feed concentration ratio F on the enantiomeric excess E and the suspension density ∆C were investigated and discussed.
EXPERIMENTAL SECTION
Materials and Solubility Determination
Sodium bromate (99.5%, metals basis) was purchased from Alfa Aesar and used as received. The enantiopure seed crystals were prepared through a batch-wise Viedma ripening protocol reported in literature.22
The crystals were isolated from the slurry through vacuum filtration using QL100 Fisherbrand filtration paper. The solids were dried overnight through evaporation of residual water at ambient temperature. The clear and cloud point temperatures of solution samples with a specific overall concentration C were determined using Crystal16 (Technobis) following a protocol published elsewhere.23
Experimental setup
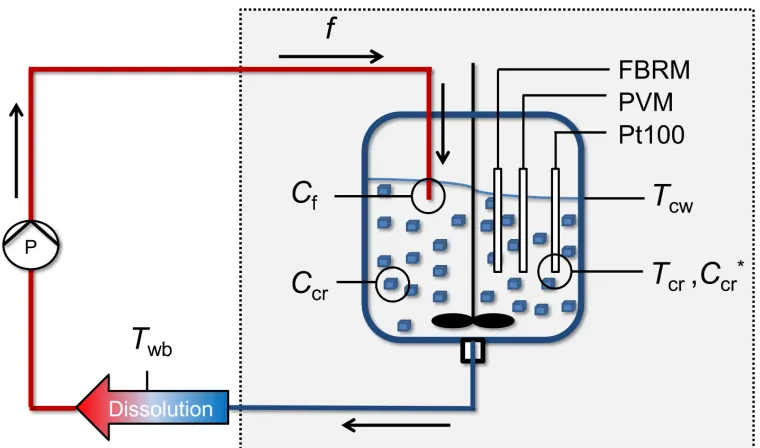
waterbath which was set at a higher temperature than the crystallizer. The crystals in the recycled suspension partially dissolved and remained in the tubing at the bottom of the setup whereas the resulting clear solution was used as the feed solution with high concentration Cf. The feed concentration Cf was mixed with the crystallizer suspension which created supersaturation due to the low crystallizer suspension temperature Tcr. The jacketed crystallizer was cooled using a Lauda ECO Gold thermostat. Circulation of the suspension was carried out using a Watson-Marlow peristaltic pump. The pump was positioned after the waterbath to avoid accumulation of crystals inside the tubing in the pump. Our experimental approach can be compared in some way to the temperature cycle enhanced-deracemization involving coupled mixed suspension vessels as both methods involve a heating and a cooling stage.24
However, in our setup no solids are recycled and a solid-free solution is fed back to the crystallizer instead.
Figure 1. Schematic representation of the experimental setup which consisted of a 1L crystallizer set at low temperature Tcr. The crystallization process is highlighted in the shaded area and this process was monitored using FBRM, PVM and Pt100 probes. A recycling loop continuously transformed the continuously removed suspension into a solid-free solution which was continuously added as an achiral feed to the crystallizer. P = peristaltic pump which controlled both the feed flow rate f and the product removal rate, Cf = concentration of the ingoing solid-free feed solution, Ccr = measured solution concentration in the crystallizer, Tcw = temperature in crystallizer jacket, Tcr = suspension temperature, Ccr*
= the solubility at the crystallizer suspension temperature and Twb = set temperature of the waterbath.
[image:6.612.114.494.96.320.2]A saturated solution with an excess amount of crystals was heated to 31 °C after which it was immediately filtered using vacuum filtration. From the filtrate, 1000 mL was taken into the crystallizer and the temperature Tcw of the crystallizer wall was set high enough to avoid primary nucleation. The waterbath temperature Twb was set and stirring inside the waterbath was set at 500 rpm. The overhead stirrer in the crystallizer was set at 400 rpm. Liquid circ ulation was initiated by switching on the peristaltic pump and the temperature of the crystallizer wall Tcw was changed to a set temperature low enough for crystal growth and secondary nucleation to occur. Seed crystals were added at the time that the set temperature of the crystallizer wall Tcw was reached and before primary nucleation occurred.
Process Input Parameters
The residence time τs of the total amount of water and sodium bromate was determined by
𝜏s= !! (1)
in which w is the total mass of water and sodium bromate inside the crystallizer and f is the feed flow rate in grams of solution per minute.
∆𝐶*= 𝐶
!−𝐶!"∗(𝑇!") (2)
The feed concentration ratio F was determined at the mixing point of feed solution and bulk suspension and calculated through
𝐹 = !!
!!"∗(!cr) (3)
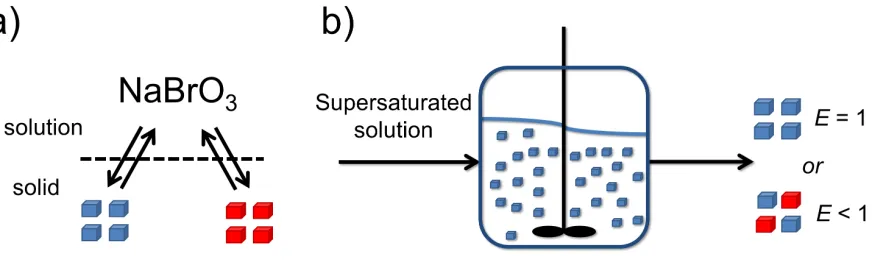
Table 1. Process parameters for the tested continuous experiments.
Exp Tcw [°C]
Twb [°C]
Ccr* [mg/ml] Cf [mg/ml] ∆C* [mg/ml] τs [min] f [g/min] F Seed Crystals [g] Homogenizer
BM1 20.5 20.5 373.5 373.5 0 8.4 123.6 1.00 5 No
BM2 20.5 20.5 373.5 373.5 0 8.4 123.6 1.00 5 Yes
BM3-1 17.0 50.0 384.0 407.2 23.2 7.2 122.4 1.06 5 No
BM3-2 17.0 50.0 384.0 407.2 23.2 7.2 122.4 1.06 10 No
BM3-3 17.0 50.0 384.0 407.2 23.2 7.2 122.4 1.06 0 No
1 17.0 50.0 384.0 409.1 25.1 8.0 126.6 1.06 5 Yes
2 19.2 41.0 379.1 403.7 24.6 15.0 68.2 1.06 5 Yes
3 20.0 37.0 377.9 392.7 14.8 31.0 33.1 1.04 5 Yes
4 20.9 31.0 379.6 386.1 6.5 36.0 25.6 1.02 5 Yes
5 21.2 31.0 380.3 393.2 12.9 56.0 17.0 1.03 5 Yes
6 21.4 31.0 379.1 396.3 17.2 162.0 6.0 1.05 5 Yes
7 21.4 40.0 379.1 406.1 27.0 169.0 6.2 1.07 5 Yes
BM = benchmark experiment, Tcw = temperature of the crystallizer wall, Twb = waterbath temperature, Ccr* = solubility at the crystallizer suspension temperature, Cf = concentration of the ingoing solid-free feed solution, ∆C* = the maximum achievable yield, τs = residence time of the total amount of water and sodium bromate, f = feed flow rate and F = feed concentration ratio.
crystallizer mainly determined the temperature of the recycled solution because the residence time is relatively short for the waterbath to have a significant effect on increasing the temperature of the recycled solution. Therefore, at fast flow rates f, the waterbath was set to higher temperatures to arrive at a sufficiently high feed temperature and thus feed concentration Cf.
For experimental convenience the conditions were chosen such that the crystallizer suspension temperature Tcr was similar to room temperature, which was between 21 °C and 22 °C. At this temperature, dissolution or nucleation in the solution samples taken from the suspension was absent.
Process Analysis
concentration determined by gravimetric analysis was typically slightly higher (up to about 1.2 mg) than the actual concentration of the solution. Although sampling slightly reduced the overall volume in the system, this did not significantly affect the results.
The enantiomeric excess E of the solids was determined using a similar procedure as reported elsewhere.25
A sample of the slurry was taken from the crystallizer using a disposable serological pipette. Three large drops were pipetted on a petri dish which was subsequently covered with filtration paper to prevent contamination of dust particles and to reduce the rate of solvent evaporation. This method was checked on the occurrence of primary nucleation during sample evaporation, by evaporating a suspension containing chirally-pure crystals to complete dryness. Afterwards, the resulting crystals were still enantiopure which suggests that no primary nucleation occurred during sample preparations. Once the particles were sufficiently large, the different chiral forms could be distinguished using a polarization microscope. The polarizer was set at 0° and the analyser was set at 90°. By slightly turning the analyser clockwise as viewed by the observer, crystals that appeared darker were laevorotatory (l). Conversely, turning the analyser counter-clockwise resulted in dextrorotatory (d) crystals to become darker.26
Each sample consisted of three droplets with a total of about 200 crystals. The number nl and nd of respectively laevorotatory and dextrorotatory crystals were counted and the number based crystal enantiomeric excess E was determined with
𝐸 =!!!!!
From the three droplets per sample, the average enantiomeric excess E and standard error ∆E were calculated.
The suspension density ∆C in units of mg crystals/ml solvent was calculated by subtracting the measured feed concentration Cf from the measured sodium bromate solution concentration Ccr in the crystallizer.27
∆𝐶= 𝐶!−𝐶!" (5)
The percentage y* of the theoretical yield crystallized in the experiment at a certain time was calculated with
𝑦∗ =100∆!
∆!* (6)
RESULTS AND DISCUSSION
1. Enantiopure or Racemic Product Crystals
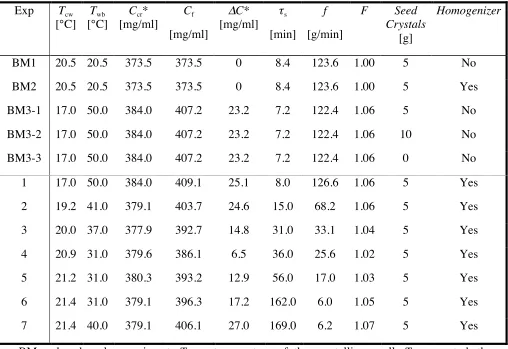
Figure 2. a) NaBrO3 is achiral in solution but forms a racemic conglomerate of left- (blue) and right-handed (red) crystals. b) Schematic representation of the continuous cooling crystallization of sodium bromate and its chiral outcome. Depending on start-up and process conditions the crystalline product is envisaged to be either enantiopure E = 1 or not enantiopure E < 1.
The continuous formation of product crystals in which the chiral form is the same as that of the seed crystals is possible through secondary nucleation. On the contrary, primary nucleation could lead to the formation of the unseeded form and as a result would lead to a crystalline product containing both chiral forms. Therefore, primary nucleation of the unwanted chirality crystals should be avoided and the experiments should be conducted within the metastable zone.
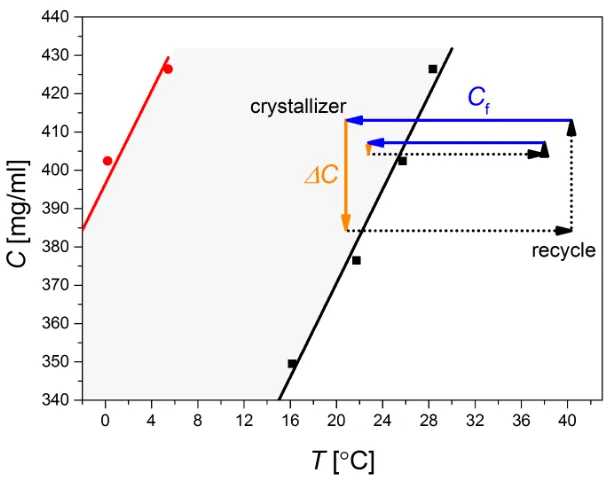
To minimise the chance of primary nucleation, the experiments were conducted using feed concentrations that were sufficiently below the metastable zone limit. Thus, the metastable zone limit defines the upper boundary for the feed concentration. Based on the data in Figure 3, the calculated supersaturation ratio S at which primary nucleation would occur is about S = 1.4. The highest tested feed concentration ratio F = 1.07 (Exp 7, Table 1) used in this study is much lower than the metastable zone limit of S = 1.4 which suggests that no primary nucleation is expected in these experiments.
We assumed that secondary nucleation would occur once local supersaturation exceeds a secondary nucleation threshold.28
This secondary nucleation threshold is a function of the feed concentration ratio F, stirrer speed, the effect of the homogenizer, suspension density and the local supersaturation. Below the secondary nucleation threshold, supersaturation would lead to crystal growth rather than nucleation. Without nucleation, a steady state would not be feasible and eventually a complete washout of crystals would occur. The measured metastable zone does not provide information on the occurrence of enantioselective secondary nucleation needed in our process to maintain crystal chirality. However, even at very low supersaturations, secondary nucleation occurs through nuclei breeding, as was observed for different compounds.8, 9, 29, 30
For example, secondary nucleation of the related compound sodium chlorate still occurs at a very low supersaturation of S = 1.006.31
Figure 3. Measured saturation temperatures (dark squares) and the cloud point temperatures (red circles) of sodium bromate samples in water. The grey area between the clear and cloud points represents the metastable zone. The large box constructed of arrows indicates the conditions used in Exp 7 (Table 1) and form the upper limits tested for the Continuous Total Spontaneous Resolution experiments. The smaller arrowed box represents the conditions used in the BM-3 experiments (Table 1). The suspension was continuously removed, heated, dissolved and returned to the crystallizer through the recycle loop.
Having established the conditions in which secondary nucleation is expected to be favoured, we continue in the next section by validating the recycling setup for the study of Continuous Total Spontaneous Resolution.
Care was taken to avoid the presence of crystals in the recycled feed solution so that the feed represents an achiral solution. Even at a very high flow rate f of 124 g/min it was observed that no crystals return to the feed as a complete washout of crystals suspended in a saturated solution was observed under overall isothermal conditions (inset, Figure 4). These isothermal conditions were achieved by setting temperatures Tcr = Twb = 20.5 °C resulting in Cf = Ccr* = 374 mg/ml and F = 1 (Experiment BM1, Table 1). Under these conditions, all 5 grams of the added enantiopure
seed crystals in the saturated solution were removed from the crystallizer over the course of 40 minutes. Samples were taken from the feed solution and processed in the same way as suspension samples from the crystallizer. An enantiomeric excess of E = 0 was found showing that no enantiopure seed crystals of E = 1 returned to the crystallizer.
In the same experiment the number N of crystals was determined as a function of time t using an FBRM probe. This number N of crystals can be described using the transient form of the MSMPR model32
:
ln 𝑁 = −!!
c+ln (𝑁!) (7)
From the fit of the experimental ln(N) versus time t as shown in Figure 4, the apparent residence time τc of the crystals and the number N0 of crystals at time t = 0 can be determined. This apparent residence time τc = 7.4 min of the crystals was very similar to the residence time τs of 7.2 min determined from the set flow rate and reactor volume. The slightly higher residence time τc of the crystals indicates that some crystal classification or secondary nucleation occurs.
washout of crystals (Experiment BM2, Table 1). The higher number N of crystals detected during the washout experiment as compared to the experiment conducted in the absence of a homogenizer possibly suggests that the homogenizer increased the degree of secondary nucleation (Figure 4). The apparent residence time τc = 8.4 min of the crystals in the presence of a homogenizer was again similar but slightly higher than the residence time τs of 8.0 min of the solution determined from flow rate and crystallizer volume (Exp. 1, Table 1). The higher apparent residence time τc of the crystals would mainly be the result of the homogenizer which causes the generation of new particles.
Figure 4. The natural logarithm of the total number of crystals ln(N) in units of number concentration (#/m3
[image:17.612.133.485.327.618.2], BM1 table 1) and in the presence of a homogenizer (red , BM2 table 1) at a flowrate f of 124 g/min. The data is fitted using equation 7. The inset shows the washout of all the crystals as a function of time for an experiment in the absence of a homogenizer (BM1 table 1).
The recycling setup was validated to show that only a clear solid-free solution was returned to the crystallizer. Also it was shown that only a minimal amount of classification occurred in the set up. In the next section, we describe a typical Continuous Total Spontaneous Resolution process through a benchmark experiment.
3. Benchmark Experiment
Solution Concentration. The solubility measurements show that sodium bromate has a high solubility in water. The temperature dependent solubility Ccr* can be described using a linear fit of the solubility data shown in Figure 3:
Ccr
*(T)= 248.00+6.12𝑇 (8)
in which temperature T is given in °C. At a temperature of T = 21°C, for instance, the solubility is Ccr*(T=21°C) = 377 mg/ml water. As can be seen in Figure 3, the solubility strongly increases (6.12 mg/ml/°C) with increasing temperature T.
Figure 5. a) The feed concentration (Cf, dashed line), the solution concentration in the crystallizer (Ccr, dotted line) and the solubility (Ccr*, solid line) of sodium bromate at the measured crystallizer suspension temperature Tcr as a function of time and number nτ of
residence times in Experiment BM3-1. The suspension density ∆C=Cf-Ccr was 3 mg/ml and the maximum achievable yield ∆C*=Cf-Ccr*was 23 mg/ml. The lines are a guide to the eye. b) Total count N in arbitrary units (a.u.) and mean chord size in µm measured using the FBRM probe as a function of time and the number nτ of residence times in Experiment BM3-1.
Particle Characteristics. Figure 5b shows the total particle count and mean size of the crystals in time recorded by the FBRM probe. Within the first 25 minutes, the solution did not contain crystals but still a count was observed. This was mainly due to air bubbles being present in the solution as a result of stirring. Once crystals were present, the air bubbles disappeared.
The seed crystals typically had an irregular shape as was observed through in-line video monitoring (Figure 6). The newly formed crystals in the crystallizer adopted a tetrahedral crystal form, which is characteristic for sodium bromate under the applied crystallization conditions.6 The newly formed crystals grew to larger sizes, agglomerated to give larger structures and induced secondary nucleation to give more crystals of the same handedness.
Figure 6. Seed crystals (left) at the start of the BM3-1 experiment (table 1) induced secondary nucleation to give tetragonal particles. In steady state the newly formed crystals grew, induced secondary nucleation and agglomerated.
Figure 7. The chord length distribution measured during Experiment BM3-1 at time = 200 min. In combination with visual observations (Figure 6), this chord length distribution indicates that the smallest part of the bimodal distribution consisted of small single particles formed as a result of secondary nucleation. The larger part of the bimodal distribution consisted mainly of large agglomerates.
Enantiomeric Excess. Figure 8 shows the enantiomeric excess E as a function of time for the BM3-1, BM3-2 and BM3-3 experiments involving different amounts of seed crystals (Table 1). In experiment BM3-1, 5 g of enantiopure seed crystals were used during start-up after which an average steady state enantiomeric excess E of more than 0.8 could be maintained. This could also be achieved in experiment BM3-2 using twice the amount of enantiopure seed crystals.
experiment led to an initial crystalline product which had an enantiomeric excess E > 0.7 from the start. This also has been observed before in batch processes.2
However, in our unseeded continuous experiments the enantiomeric excess E gradually decreased over time to reach 0.2 to 0.4 after nτ = 40 residences because both chiral forms were present from the start and secondary nucleation continued to occur for both chiral forms. It is assumed that the enantiomeric excess E eventually would reach a steady state value of 0.
Figure 8. Enantiomeric excess E as a function of time and number of residence times nτ for
[image:23.612.117.484.274.586.2]For the seeded experiments, some crystals with chirality opposite to the seeded form were identified in the samples taken later on in the experiment (Figure 9). Consequently, the enantiomeric excess E remained lower than 1 over the course of the experiments. Interestingly, crystals with chirality opposite to the seed form were large and flat, in contrast to the typical tetrahedral crystals, which were predominantly present as single chiral form. In the benchmark experiments without homogenizer (BM3, Figure 8), the number based enantiomeric excess E was less reliable as large crystals were assigned in the same way as small crystals. Nevertheless, the general trend of the enantiomeric excess E could still be observed.
The uncharacteristic shape of the larger crystals suggests that they have a different formation and growth history as compared to the bulk crystals. Possibly they were the result of a fouling process at the crystallizer wall, probe or baffle after which they were detached and resuspended. Fouling is a common issue in heat exchange crystallization processes and would occur when secondary nucleation is too low and the available crystal surface area in the bulk is too small to accommodate the applied supersaturation.34
Under those conditions, fouling occurs at heterogeneous surfaces. In cooling crystallization it was observed that in addition to the cold reactor wall, fouling also occurred at baffles and at the stirrer despite the presence of a high suspension density of product crystals.27 In our experiments, the applied feed concentration ratios F ranged from 1.02 to 1.07 which correspond to the values used in the study of the continuous
Figure 9. Sodium bromate crystals prepared from a sample taken 150 minutes after seeding during experiment BM3-2 and viewed between crossed polarizers. The smaller dark crystals within the highlighted area were of the same tetragonal shape and chiral form (all are dark) whereas both chiral forms (bright and dark) outside the highlighted area were present as large crystals. The enantiomeric excess E of this sample was determined to be 0.9.
[image:25.612.156.460.81.335.2]4. Enhancing Secondary Nucleation
A large crystal surface area that would efficiently consume the applied supersaturation could be realized by an increased number of crystals. This in turn could be achieved by enhancing secondary nucleation induced by the presence of the single chirality crystals in the suspension. A simple strategy to enhance supersaturation consumption and increase secondary nucleation is to use a homogenizer. It was thought that the use of a homogenizer would stabilize the enantiomeric excess E in steady state by increasing the overall crystal surface area which in turn would lead to a more efficient decrease in applied supersaturation and thus a reduced fouling. The crystal breakage and secondary nucleation as a result of a homogenizer could induce Viedma ripening, as was observed in experiments performed using ultrasound-enhanced grinding.25 In order to check the absence of Viedma Ripening in our experiments using a homogenizer, we continuously subjected a suspension with an initial enantiomeric excess E=0.2 at a flow rate f = 0 to the homogenizer at different homogenizing intensities. Even after a week, no significant increase in enantiomeric excess E was observed. Thus, the localized effect of attrition induced by a homogenizer in a large volume appeared to be insufficient to induce Viedma ripening.
The homogenizer caused the crystals to remain uniform throughout the experiment. Therefore, the number based enantiomeric excess E was a sufficiently reliable measure to assess the chiral purity. The enantiomeric excess E as a function of the number nτ of residence times is
about 1 or slowly decrease towards 0 over time. This binary behaviour reflects the outcome of simulations reported elsewhere by others.20
Figure 10. Enantiomeric excess E as a function of the number nτ of residence times for experiments 1 to 7 having increasing residence times τs. A steady and high enantiomeric excess E can be achieved at a sufficiently long residence time τs and high feed concentration ratio F.
The process parameters of experiment 1 to 7 can be found in Table 1 and the results are summarized in Table 2. The lines are a guide to the eye.
[image:28.612.113.484.107.396.2]residence times. The enantiomeric excess E started to decrease after nτ = 15 residence times in experiment 4 in which the residence time τs was 36 minutes. The enantiomeric excess E decreased over time due to the formation of a few large flat crystals of the chiral form opposite to the seeded form which were formed as a result of fouling (Figure 9). These large crystals were also efficiently broken into many smaller ones by the homogenizer and due to the low suspension density ∆C ≤ 3.3 mg/ml, the crystals of the opposite chiral form would contribute substantially to the measured number-based enantiomeric excess E. Despite any fouling, a low suspension density ∆C of 3.3 mg/ml in experiment 2 did not result in a decrease in enantiomeric excess E.
The enantiomeric excess E as a function of the residence time τs and the feed concentration ratio F is schematically depicted in Figure 11 and the results are summarized in Table 2. At feed concentration ratios F of 1.4 and higher, primary nucleation would occur which would also lead to a decrease in enantiomeric excess E over time. In the top right corner of Figure 11 below F=1.4, primary nucleation is absent but the feed concentration ratio F is sufficiently high and the
Figure 11. A schematic representation of the effect of the residence time τs and feed concentration ratio F on the steady state enantiomeric excess E after nτ = 30 number of residence times. The points represent the outcome of the experiments in which the red squares indicate experiments with decreasing enantiomeric excess E and the blue circles represent a steady enantiomeric excess E close to 1. The numbers next to the data points are the percentages y* of the theoretical yield crystallized in each experiment. The area in which E = 1 can be maintained is expected to become gradually smaller at nτ > 30 as result of fouling, indicated by the arrow.
[image:30.612.143.459.77.398.2]because large crystals got stuck behind baffles, crystallization occurred on the stirrer and some crystals were formed at the crystallizer wall just above the liquid-air interface (crowning). For longer process times the chance of fouling would increase, resulting in the possible introduction of the unseeded chiral form to the bulk suspension leading to a gradual decrease in enantiomeric excess E. Therefore, conditions in which a steady high enantiomeric excess E could be feasible would decrease over time as indicated by the arrow in Figure 11.
Table 2. Overview of the outcome of the experiments.
Experiment Ccr
[mg/ml]
∆C
[mg/ml]
SB y* [%] E
BM3-1 and BM3-2 404.3 2.9 1.053 12.1 >0.80
BM3-3 404.3 2.9 1.053 12.1 DOT
1 406.1 3.3 1.052 12.9 DOT
2 400.4 3.3 1.052 13.2 >0.97
3 390.6 2.6 1.033 17.5 DOT
4 386.0 0.1 1.020 2.3 DOT
5 388.2 5.0 1.018 38.9 >0.95
6 388.2 8.2 1.027 46.0 >0.95
7 384.0 21.5 1.013 81.0 >0.98
Ccr = solution concentration, ∆C = suspension density, SB = relative bulk supersaturation, y* =
Process modelling has shown that Continuous Total Spontaneous Resolution from solution in which racemization is present, as reported herein, was predicted to be an efficient means to reach chirally pure products.20
This is echoed in Experiment 7 in which a steady high yield y* of 81% together with a steady high enantiomeric excess E of > 0.98 was achieved a large number nτ = 30 of residence times or 3.5 days. While our experiments show that continuous Total Spontaneous Resolution is possible, there is still sufficient room to improve yield and productivity.
The achiral sodium bromate used in this work undergoes infinitely fast racemization in solution. As a result, no excess of the counter enantiomer is formed in solution and the chance of its crystallization is therefore relatively small. However, intrinsically chiral compounds typically do not undergo infinitely fast racemization in solution and a small excess of the counter enantiomer is expected to form in solution during Continuous Total Spontaneous Resolution. An excess of the counter enantiomer in solution would result in a smaller operating window for the Continuous Total Spontaneous Resolution process as the unwanted chiral form is more likely to crystallize.
One of the main benefits of our recycling setup is that a large number nτ of residences can be tested with a minimal amount of material. A key issue that emerged after extended periods of continuous cooling crystallization was fouling, as was also shown for the crystallization of adipic acid.27
In their experiments, fouling could be suppressed through the use of ultrasound. The use of ultrasound was furthermore effective in the batch deracemization approach of sodium chlorate through Viedma ripening.25
crystals could be suppressed to some extent. For example, a long residence time τs in combination with a high feed concentration ratio F (Experiment 7, Table 2) resulted in a high suspension density ∆C in which the fraction of counter chirality crystals in the product remained relatively low. In this way, a high yield y* and a steady high enantiomeric excess E could be obtained.
CONCLUSIONS
A novel recycling setup was tested and used to study a continuous cooling crystallization process for many residence times using a relatively small amount of compound. The concentration, particle sizes and enantiomeric excess of the product crystals were continuously monitored. With this setup we showed that it is possible to continuously manufacture enantiopure crystals of a compound that is achiral in solution. A sufficiently high feed concentration ratio in combination with a long residence time led to a high degree of secondary nucleation and a high suspension density which reduced the impact of some counter chirality crystals formed through fouling. Under those conditions, simply seeding the continuous process during start-up with single chirality seeds led to efficient continuous chiral symmetry breaking that created crystals of the preferred chiral form. The herein reported proof of principle enables the possibility to achieve continuous chiral symmetry breaking for chirally pure pharmaceutical products by combining the continuous cooling crystallization with a solute racemization reaction.
AUTHOR INFORMATION
Corresponding Author
Notes
The authors declare no competing financial interest.
ACKNOWLEDGMENT
We thank Maria L. Briuglia for measuring the solubility data for sodium bromate in water. This work is part of the research programme Rubicon with project number 2015/00910/N, which is financed by the Netherlands Organisation for Scientific Research (NWO). The authors thank the EPSRC Centre for Innovative Manufacturing in Continuous Manufacturing and Crystallisation (http://www.cmac.ac.uk) for supporting this work (EPSRC funding under grant reference: EP/I033459/1).
REFERENCES
(1) Henley, E. J.; Seader, J. D.; Roper, D. K., Separation Process Principles. ed.; Wiley: 2011.
(2) Nguyen, L. A.; He, H.; Pham-Huy, C., IJBS 2006, 2, 85-100.
(3) Lorenz, H.; Seidel-Morgenstern, A., Angew. Chem. Int. Ed. 2014, 53, 1218-1250.
(4) Balzani, V.; Meijere, A. d.; Houk, K. N.; Kessler, H.; Lehn, J. M.; Ley, S. V.; Schreiber, S. L.; Thiem, J.; Trost, B. M.; Vögtle, F.; Yamamoto, H., Topp. Curr. Chem. 2007, 269, 1-313. (5) Levilain, G.; Coquerel, G., CrystEngComm 2010, 12, 1983-1992.
(6) Eliel, E. L.; Wilen, S. H., Stereochemistry of organic compounds. ed.; John Wiley & Sons: 2008.
(7) McBride, J. M.; Carter, R. L., Angew. Chem. Int. Ed 1991, 30, 293-295.
(8) Buhse, T.; Durand, D.; Kondepudi, D.; Laudadio, J.; Spilker, S., Phys. Rev. Lett. 2000,
84, 4405-4408.
(9) Anwar, J.; Khan, S.; Lindfors, L., Angew. Chem. Int. Ed 2015, 54, 14681-14684. (10) Kondepudi, D. K.; Kaufman, R. J.; Singh, N., Science 1990, 250, 975-976.
(11) Leeman, M.; de Gooier, J. M.; Boer, K.; Zwaagstra, K.; Kaptein, B.; Kellogg, R. M., Tetrahedron: Asymmetry 2010, 21, 1191-1193.
(13) Allison, G.; Cain, Y. T.; Cooney, C.; Garcia, T.; Bizjak, T. G.; Holte, O.; Jagota, N.; Komas, B.; Korakianiti, E.; Kourti, D.; Madurawe, R.; Morefield, E.; Montgomery, F.; Nasr, M.; Randolph, W.; Robert, J.-L.; Rudd, D.; Zezza, D., J. Pharm. Sci. 2015, 104, 803-812.
(14) Badman, C.; Trout, B. L., J. Pharm. Sci. 2015, 104, 779-780.
(15) MacFhionnghaile, P.; Svoboda, V.; McGinty, J.; Nordon, A.; Sefcik, J., Cryst. Growth Des. 2017, 17, 2611-2621.
(16) Svoboda, V.; MacFhionnghaile, P.; McGinty, J.; Connor, L. E.; Oswald, I. D. H.; Sefcik, J., Cryst. Growth Des. 2017, 17, 1902-1909.
(17) Briggs, N. E. B.; Schacht, U.; Raval, V.; McGlone, T.; Sefcik, J.; Florence, A. J., Org. Process Res. Dev. 2015, 19, 1903-1911.
(18) McGlone, T.; Briggs, N. E. B.; Clark, C. A.; Brown, C. J.; Sefcik, J.; Florence, A. J., Org. Proc. Res. & Dev. 2015, 19, 1186-1202.
(19) Adamo, A.; Beingessner, R. L.; Behnam, M.; Chen, J.; Jamison, T. F.; Jensen, K. F.; Monbaliu, J.-C. M.; Myerson, A. S.; Revalor, E. M.; Snead, D. R.; Stelzer, T.; Weeranoppanant, N.; Wong, S. Y.; Zhang, P., Science 2016, 352, 61-67.
(20) Köllges, T.; Vetter, T., Cryst. Growth Des. 2016, 17, 233-247.
(21) Dickinson, R. G.; Goodhue, E. A., J. Am. Chem. Soc. 1921, 43, 2045-2055. (22) Viedma, C., Cryst. Growth Des. 2007, 7, 553-556.
(23) Jiang, S.; ter Horst, J. H., Cryst. Growth Des. 2011, 11, 256-261.
(24) Suwannasang, K.; Flood, A. E.; Coquerel, G., Cryst. Growth Des. 2016, 16, 6461-6467. (25) Xiouras, C.; Van Aeken, J.; Panis, J.; Ter Horst, J. H.; Van Gerven, T.; Stefanidis, G. D., Cryst. Growth Des. 2015, 15, 5476-5484.
(26) Abrahams, S. C.; Glass, A. M.; Nassau, K., Solid State Commun. 1977, 24, 515-516. (27) Narducci, O.; Jones, A. G.; Kougoulos, E., Chem. Eng. Sci. 2011, 66, 1069-1076. (28) Agrawal, S. G.; Paterson, A. H. J., Chem. Eng. Comm. 2014, 202, 698-706. (29) de Souza, B.; Cogoni, G.; Tyrrell, R.; Frawley, P. J., Cryst. Growth Des. 2016. (30) Qian, R.-Y.; Botsaris, G. D., Chem. Eng. Sci. 1998, 53, 1745-1756.
(31) Callahan, C. J.; Ni, X.-W., Cryst. Growth Des. 2012, 12, 2525-2532.
(32) Berglund, K. A., 4 - Analysis and measurement of crystallization utilizing the population balance A2 - Myerson, Allan S. In Handbook of Industrial Crystallization (Second Edition), Butterworth-Heinemann: Woburn, 2002; pp 101-113.
(33) Kramer, H. J. M., CRYSTALLIZATION | Control of Crystallizers and Dynamic Behaviour A2 - Wilson, Ian D. In Encyclopedia of Separation Science, Academic Press: Oxford, 2000; pp 950-961.
“For Table of Contents Use Only”
Continuous Total Spontaneous Resolution René R. E. Steendam* and Joop H. ter Horst