Transportation Research Procedia 14 ( 2016 ) 1659 – 1668
2352-1465 © 2016 Published by Elsevier B.V. This is an open access article under the CC BY-NC-ND license (http://creativecommons.org/licenses/by-nc-nd/4.0/).
Peer-review under responsibility of Road and Bridge Research Institute (IBDiM) doi: 10.1016/j.trpro.2016.05.131
ScienceDirect
6th Transport Research Arena April 18-21, 2016
Assessing the impact of a slow steaming approach on reducing the
fuel consumption of a containership advancing in head seas
Tahsin Tezdogan
a,*, Atilla Incecik
a, Osman Turan
a, Paula Kellett
aa
Department of Naval Architecture, Ocean and Marine Engineering, University of Strathclyde, 100 Montrose Street, Glasgow, G4 0LZ, United Kingdom
Abstract
The slow steaming approach is increasing in popularity for commercial vessels, as it provides a method of reducing fuel use, and
therefore operating costs, in the current economic climate. It is very important to be able to evaluate a ship’s response to waves, because any added resistance or loss of speed may cause delays or course alterations, leading to financial losses. Potential flow theory based linear strip theory is still a widely used method among naval architects, due to its fast solutions with sufficient engineering accuracy. The key objective of this study is to predict the ship motions and added resistance of the S-175 containership, and to estimate the increase in effective power and fuel consumption due to its operation in regular and irregular head seas. The analyses were performed at design and slow steaming speeds, for a range of wave conditions in regular seas, and for three different sea states in irregular seas. The results obtained at a ship speed corresponding to Froude number 0.25 were compared to available experimental data and were found to be in good agreement with the experiments. The numerical analyses were carried out using VERES, which is based on potential flow theory.
© 2016The Authors. Published by Elsevier B.V..
Peer-review under responsibility of Road and Bridge Research Institute (IBDiM).
Keywords: seakeeping; added resistance; slow steaming
* Corresponding author. Tel.: +44 (0)141 5484532; fax: +44 (0)141 5522879. E-mail address: tahsin.tezdogan@strath.ac.uk
© 2016 Published by Elsevier B.V. This is an open access article under the CC BY-NC-ND license (http://creativecommons.org/licenses/by-nc-nd/4.0/).
1.Introduction
Understanding the behavior of a vessel in a real seaway is critical for determining its performance. Rough sea conditions induce significant ship motions, which affect a ship’s resistance. The resulting increase in resistance can
compromise propulsive efficiency and can increase fuel consumption. Ship motions and seakeeping behavior are also very important with regards to crew, vessel and cargo safety. An awareness of the impacts of ship motions on resistance is particularly important in the current economic climate, which has seen a significant increase in fuel costs in comparison to charter rates. Slow steaming has recently become a popular approach for commercial vessels, as a way of reducing fuel consumption, and therefore operating costs, in the current economic and regulatory climate. Little research has been carried out into the effect that these lower speeds may have on the behavior of the vessel, and whether further fuel savings may be an additional benefit.
The current economic climate is very different from the “boom years” in which modern vessels were designed. In
response to recent fuel price increases, ship operators have begun to apply the slow steaming approach, which was initially proposed by Maersk technical experts post-2007 (Tezdogan et al., 2015). In this approach, a vessel is operated at a speed significantly below its original design speed in order to reduce the amount of fuel that is required. Banks et al. (2013) showed how the operating speeds for container vessels have decreased over recent years, comparing the period from 2006–2008 with 2009–2012. In particular, it can be observed from their collection of data that the most typical slow steaming speed is around 19 knots. This speed will therefore be used as a representative slow steaming speed in this study. The service speed used will be 24 knots.
This paper seeks to contribute to current knowledge by comparing pitch and heave motions, as well as added resistance, of a vessel at both design and slow steaming speeds. The main aim of this study is to directly predict the increase in the required effective power of a vessel operating in head seas. This leads to a rough estimation of the fuel penalty to counter the additional CO2 emissions from the vessel. The potential benefits of slow steaming were
probed by invoking added resistance and ship motion predictions.
The ITTC S-175 Containership has been used in a wide range of research studies. There is consequently a wide range of experimental and numerical data available for comparison, and for validation purposes. The S-175 Containership was therefore investigated in this study due to the availability of this data and research in the public domain.
The majority of seakeeping computations at forward speeds are still performed using strip theory, because its fast, reliable solutions have sufficient accuracy for engineering purposes. For these reasons, in order to calculate the resistance and motion responses of the containership, VERES, which is based on a linear, potential, strip theory software package, was used in this study (Fathi and Hoff, 2013). The numerical results obtained from the analyses were then compared to available experimental data. The analyses were carried out in both regular and irregular seas under design and slow steaming conditions.
2.Background
In this work, the ship motions in waves are quantitatively analysed with Response Amplitude Operators (RAOs), or, in other words, transfer functions. The definition of heave and pitch RAOs, respectively, can be given by:
Heave I
y
RAO
]
(1)Pitch I
RAO
k
T
]
(2)where y, θ and ζ are heave, pitch and wave amplitudes, respectively, and k=2π/λ is the wave number in which λ
stands for wave length. It must be stated that in this study, the heave and pitch motions were calculated at the ship’s
The transfer functions of a ship can be computed either experimentally or numerically. Experimental methods are generally used for the validation of numerical results, since conducting experiments for each ship speed and heading would be very expensive and time consuming. There is therefore a wide range of commercial software available, which can calculate the RAOs of a desired vessel within a few minutes.
Viscosity is neglected in most seakeeping analyses, meaning that potential theory is still a very popular technique. However, some empirical viscous corrections are employed in the potential theory-based methods in an attempt to incorporate viscous effects into the formulation (Tezdogan et al., 2014). In the potential theory, the fluid is assumed to be homogeneous, non-viscous, irrotational and incompressible.
The resistance of a ship operating in a seaway is greater than its resistance in calm water. The difference between these two resistances arises from ship motions and wave drift forces in waves and has been termed the added resistance due to waves. Added resistance can account for up to 15–30% of the total resistance in calm water (Arribas, 2007). It is therefore critical to be able to accurately predict the added resistance of a ship in waves, and this should be included in ship performance assessments (Tezdogan et al., 2015). For the added resistance calculations, VERES uses the method of Gerritsma and Beukelman (1972), which is based on the determination of the energy of the radiating waves and a strip-theory approximation (Fathi and Hoff, 2013). The method used to calculate ship motions in VERES is based on the two-dimensional, linear, strip theory formulation by Salvesen, Tuck and Faltinsen (1970). For more information about this seakeeping code, reference can be made to the theory manual of the software (Fathi and Hoff, 2013).
The added resistance results are typically presented in their non-dimensional form as given in the following equation:
2 2
/
AW awI BP
R
g
B
L
V
U ]
(3)σaw, given in the above equation, has been termed the added resistance coefficient and RAW is called the added
resistance due to waves. In Eq. 3 g denotes gravitational acceleration, which was taken to be 9.81 m/s2 in all
calculations, and ζI is the amplitude of incident regular waves.
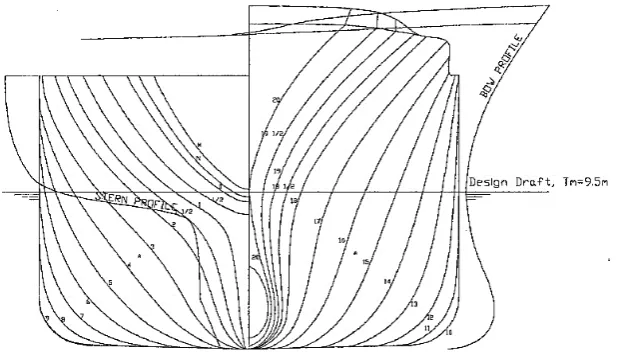
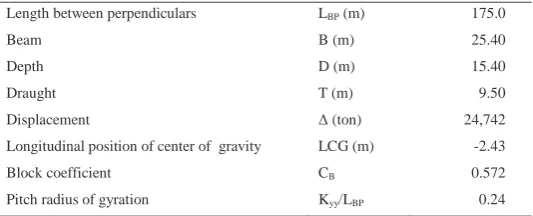
[image:3.544.130.439.428.606.2]A full-scale model of the S-175 bare hull was used within this study. The main properties of the ship model in question are presented in Table 1 and its body lines are shown in Fig. 1.
Table 1. Main particulars of the S-175, taken from Fonseca and Soares (2004a).
Length between perpendiculars LBP (m) 175.0
Beam B (m) 25.40
Depth
Draught
D (m)
T (m)
15.40
9.50
Displacement Δ (ton) 24,742
Longitudinal position of center of gravity LCG (m) -2.43
Block coefficient CB 0.572
Pitch radius of gyration Kyy/LBP 0.24
3.Validation
Due to the large body of data available for the S-175 containership, it is possible to use available experimental data for comparison with the results obtained using VERES. This can be used to validate the software package adopted in this study before starting the real computations.
3.1.Motion responses and added resistance of the S-175 in regular head seas
Fig. 2 displays the transfer functions of heave and pitch obtained for the ship in question at a Froude number (Fn) of 0.25, which corresponds to a ship forward speed of 20.14 knots. The obtained results were compared to the experimental results of Fonseca and Soares (2004a), who conducted seakeeping experiments with a 1:40 scale model of the S-175 in regular head seas. The graphs, demonstrated in Fig. 2, are plotted against non-dimensional wave frequency, ω'=ωඥܮȀ݃(ω is the wave frequency in rad/s).
Fig. 2. (a) Heave; (b) pitch transfer functions (Fn=0.25).
As can be seen from Fig. 2, the heave and pitch results obtained using VERES are compatible with the experimental data. The discrepancies between the numerical and experimental data are much more pronounced in the heave motion, whereas in the pitch motion the numerical results are in fairly good agreement with the experimental findings. Fig. 2 also appears to demonstrate that for the heave motion, the non-dimensional resonance frequency is 2.3, whereas for the pitch motion the resonance occurs at a slightly smaller frequency. The differences between the numerical and experimental pitch RAOs are in fact most pronounced around this resonance frequency.
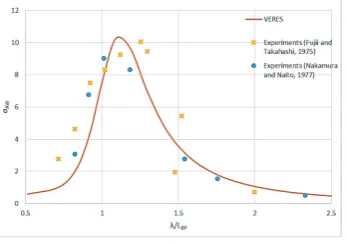
[image:4.544.62.477.357.482.2]Fig. 3. Comparison of the added resistance due to waves (Fn=0.25).
Fig. 3 shows that the added resistance of the vessel reaches its maximum value at λ/L=1.09 and then gradually decreases as wave length increases. As can be seen from the figure, the calculated added resistance coefficients using VERES are in sufficiently good agreement with the experimental data. The comparison also demonstrates that the discrepancies between the two methods diminish for larger wave lengths. This result is as expected because very large wave lengths exhibit a very linear behaviour where VERES produces results which are closer to experiments. Without any doubt, for the cases where nonlinearities and viscous effects become predominant, VERES gives less accurate results.
3.2.Motion responses of the S-175 in irregular head seas
The real seaways can only be modelled by virtue of a statistical model. Ship responses to natural irregular seas (Sz) are calculated by the linear superposition principle, using the seaway spectrum (Sζ) and the transfer functions in
the frequency domain as given below.
2
( )
( )
( )
z
S
Z
S
]Z
RAO
Z
(4)Several spectral formulations are available in the literature. One of the most frequently used spectrums is the Pierson-Moskowitz spectrum (Pierson and Moskowitz, 1964). The formulation of this spectrum is given in Eq. 5.
4
2 4
0 0
5
5
5
( )
exp
16
4
s
H f
f
S
f
f
f
]
ª
§
·
º
«
¨
¸
»
«
©
¹
»
¬
¼
(5)
where f and f0 denote, respectively, the frequency and peak frequency in hertz and Hs is significant wave height in metres.
Fonseca and Soares (2004b) conducted a series of experiments with a model in long crested head waves at Fn=0.25 for three different sea states. In order to validate VERES’s results in irregular seas, their experimental results were utilised. Fonseca and Soares (2004b) used the Pierson-Moskowitz spectrum to produce irregular waves in their towing tank. For this reason, in this present study the same spectrum was used for our numerical analyses in irregular seas.
[image:5.544.86.235.434.474.2]Table 2. Heave and pitch motions in irregular seas with a comparison with the experimental results of Fonseca and Soares (2004b).
Sea State 6
Sea State 7
Sea State 8
Hs= 4.20 m, T0= 11.5 s Hs= 6.13 m, T0= 11.5 s Hs= 9.89 m, T0= 16.5 s
Experiment Calculation Experiment Calculation Experiment Calculation
RMS Heave (m) 0.808 0.855 1.216 1.248 2.420 2.235
RMS Pitch (deg) 1.216 1.227 1.822 1.791 2.832 2.859
4.Results and discussion
Having successfully validated the ship motion and added resistance values of the vessel in both regular and irregular seas against available experimental data, the reminder of this section addresses the main findings of this study. As explained earlier, in order to reveal potential benefits of applying a slow steaming approach, the calculations were carried out at two speeds: 24 knots and a lower ship speed (19 knots).
4.1.Calm water resistance results
The total resistance (drag) of the vessel (RT) can be expressed in its more common non-dimensional form, as given in Eq. 6.
2
1
2
T T
R
C
U S
U
(6)where ρ is the water density, which is taken as 1.025 t/m3 for sea water, and S is the wetted area of the vessel in an undisturbed sea surface, which is calculated to be 5,371.564 m2 for the S-175 containership.
VERES calculated the total resistance coefficient (CT) of the ship to be 2.227×10⁻³ and 3.099×10⁻³ at ship forward speeds of 19 and 24 knots, respectively.
4.2.Ship motion responses and added resistance in regular head seas
[image:6.544.101.450.507.612.2]Heave and pitch transfer functions predicted by VERES at the two different speeds are graphically illustrated in Fig. 4. This gives a clearer depiction of the responses of the ship to regular head waves, enabling a more facile comparison between the different ship speeds. As depicted in the figure, the heave and pitch peak amplitudes of the vessel tend to increase at 24 knots, compared to those at 19 knots. Additionally, given that the encounter frequency is also a function of ship speed, the peak frequencies in both motions change slightly as the vessel forward speed varies.
The resultant added resistance coefficients of the S-175 containership due to its operation in regular waves at two operational speeds are shown for a range of wave conditions in Fig. 5. As the figure explains, the added resistances of the vessel are higher at 19 knots than those at 24 knots until a certain peak point, and from that point onwards the added resistance at 24 knots tends to become higher than that at 19 knots.
Fig. 5. Comparison of the added resistance coefficients of the vessel at 19 and 24 knots.
4.3.Ship motion responses and added resistance in irregular head seas
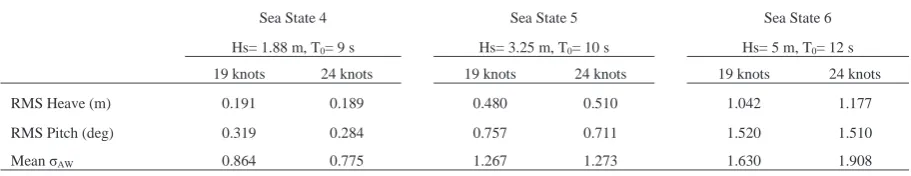
Investigation of the behaviour and performance of the vessel in an irregular seaway was performed in three different sea states (sea states: 4, 5 and 6). As mentioned before, the Pierson-Moskowitz spectrum was used to model an irregular seaway. Table 3, below, presents the added resistance and motion responses of the S-175 containership at ship speeds of 19 and 24 knots in irregular head seas. The significant wave height and peak periods were selected from the table given in (Bales, 1982) for the open ocean Northern Hemisphere.
Table 3. Comparison of the motion responses and added resistance of the vessel at ship speeds of 19 and 24 knots in an irregular seaway.
Sea State 4 Sea State 5 Sea State 6
Hs= 1.88 m, T0= 9 s Hs= 3.25 m, T0= 10 s Hs= 5 m, T0= 12 s
19 knots 24 knots 19 knots 24 knots 19 knots 24 knots
RMS Heave (m) 0.191 0.189 0.480 0.510 1.042 1.177
RMS Pitch (deg) 0.319 0.284 0.757 0.711 1.520 1.510
Mean σAW 0.864 0.775 1.267 1.273 1.630 1.908
As can be seen from the comparison given in Table 3, in Sea State 4, although the vessel increases her speed from 19 knots to 24 knots, the RMS heave and pitch amplitudes, as well as the mean added resistance values, decrease. Another interesting result that can be drawn from the table is that for all sea conditions, the pitch response of the vessel in irregular seas tends to decrease as the ship forward speed increases to 24 knots.
4.4.Increases in the effective power of the ship due to added resistance in head seas
[image:7.544.48.504.390.478.2]not be calculated directly. Instead, the percentage increase in effective power due to the added resistance in waves will be calculated as given by Eq. 7. This can be taken as an indication of the implications for fuel consumption, and hence CO2 emissions, of the vessel in question operating in a seaway, assuming that efficiencies and SFOC remain constant (Tezdogan et al., 2015).
, ,
, ,
% Increase in P due to added resistance =
T100
T wave T calm100
E
T calm T calm
C
C
C
x
x
C
C
'
[image:8.544.105.433.124.309.2](7)
Fig. 6. Estimation of the percentage increase in the effective power, fuel consumption and CO2 emissions of the S-175 containership due to
operation in regular head seas at ship forward speeds of 19 and 24 knots.
Fig. 6 compares the predictions of the percentage increase in the effective power, fuel consumption, and hence CO2 emissions of the S-175 containership due to induced added resistance at ship speeds of 19 and 24 knots. The calculations were performed based on the formula given in Eq. 7. It should be emphasised that when calculating the increase in PE, the difference in CT between the wave and calm conditions should be considered at the same speed.
The data contained in Fig. 6 show that the highest increases in the effective power are observed around the ratio λ/LBP=1.16. This increase is found to be 61% at 19 knots, and 34% at 24 knots.
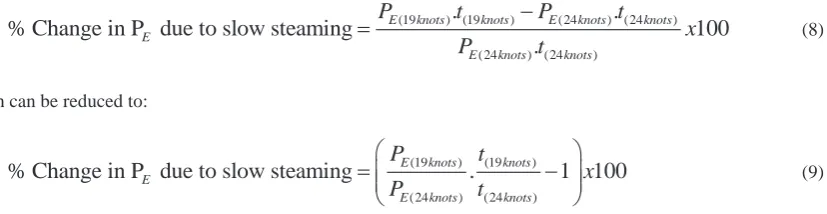
In order to reveal the potential benefits of applying the slow steaming approach, for each case the difference in the energy consumed during a voyage under the same wave conditions was calculated between 19 and 24 knots. The metric shown in Eq. 9 was used to estimate the change in PE due to slow steaming, which can be taken as an indication of the fuel consumption, and hence CO2 emissions, of the ship in question (Tezdogan et al., 2015).
(19 ) (19 ) (24 ) (24 )
(24 ) (24 )
.
.
% Change in P due to slow steaming
100
.
E knots knots E knots knots
E
E knots knots
P
t
P
t
x
P
t
(8)
which can be reduced to:
(19 ) (19 )
(24 ) (24 )
% Change in P due to slow steaming
E E knots.
knots1
100
E knots knots
P
t
x
P
t
§
·
¨
¸
¨
¸
©
¹
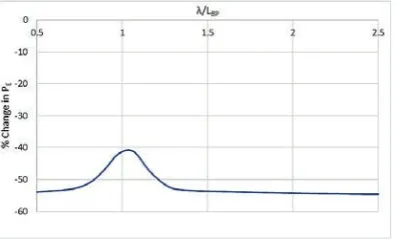
(9)where ‘t(19knots)/t(24knots)’ can be termed the “transit time ratio” between the durations of the voyages for 19 and 24 knots, respectively, as initially defined by Tezdogan et al. (2015).
[image:8.544.68.482.471.578.2]graph can help to interpret the power reduction or increase for any given case using the potential theory approach. For example, when the vessel keeps her course in a head sea condition at a speed of 24 knots, if she were to reduce her speed down to 19 knots in the same wave conditions, it is estimated that the required effective power will decrease by 53.7% on average. Fig. 7 distinctly shows the advantages of slow steaming operational conditions in terms of fuel consumption and CO2 emissions.
Fig. 7. Estimation of the percentage change in the effective power, fuel consumption and CO2 emissions of the S-175 containership due to
operation in regular head seas at a slow steaming speed (19 knots), compared to a speed of 24 knots.
[image:9.544.51.505.435.520.2]Table 4 shows estimation of the percentage increases in the effective power, fuel consumption, and CO2 emissions of the S-175 containership due to operation in irregular head seas at speeds of 19 and 24 knots. The table also reveals estimations of the percentage changes in the same parameters due to operation in irregular head seas at a slow steaming speed, compared to a more typical service speed. According to Table 4, when the vessel advances in irregular seas at 19 knots, the mean increase in its fuel consumption, and hence CO2 emissions, compared to operation in a calm water condition, becomes 5.47%, 8.02% and 10.32% for sea states 4, 5 and 6, respectively. These values, respectively, alter to 2.21%, 3.53% and 5.44% when she advances at 24 knots. The table also implies that if the vessel speed was reduced to 19 knots, the fuel consumption and hence CO2 emissions would reduce by up to 53% for all three sea states.
Table 4. Estimation of the percentage increases in the effective power, fuel consumption, and CO2 emissions of the S-175 containership due to
operation in irregular head seas at speeds of 19 and 24 knots, and estimation of the percentage changes in the same parameters due to operation in irregular head seas at a slow steaming speed.
Sea State 4 Sea State 5 Sea State 6
19 knots 24 knots 19 knots 24 knots 19 knots 24 knots
% Mean increase in the effective power due to
operation in irregular head seas (Eq. 7) 5.47 2.21 8.02 3.63 10.32 5.44
% Mean change in the effective power due to operation in irregular head seas at a slow
steaming speed (Eq. 9) -53.53 -53.05 -52.88
5.Concluding remarks
Typical seakeeping and resistance calculations have been carried out for a well-known S-175 containership at two speeds, corresponding to service and slow steaming speeds. The analyses have been carried out by utilising a commercial potential theory based software package, VERES.
The increase in effective power and hence fuel consumption due to added resistance were predicted for a variety of wave conditions in regular seas and for three different short term sea conditions in irregular seas. All calculations were performed for head seas. However, the same procedure demonstrated in this study could be easily applied to any heading angle.
With the current trend towards operation according to the slow steaming principle, vessels are operating in conditions that are significantly different to those for which they were designed and optimised. It is therefore critical that the impacts of slow steaming upon ship behaviour and performance are well understood. This paper has shown that slow steaming has beneficial effects on reducing ship motions, power requirements, fuel consumption and hence CO2 emissions. It has been estimated using the linear potential flow method described in this paper that
application of the slow steaming principle can lead to a decrease of up to 53% in a vessel’s effective power and CO2
emissions, compared to a vessel operating in the same wave conditions at 24 knots. It should be borne in mind that slow steaming can only be considered as a short-term strategy to reduce carbon footprint of a vessel. To maintain the longer term impact, policies should be established with inputs from academia, national governments, industry and all other stakeholders.
This paper has provided a very useful starting point for investigations into ship behaviour at off-design speeds, specifically at a representative slow steaming speed for container vessels. However, it is believed that this approach can be employed to any vessel type.
Although slow steaming produces obvious benefits in terms of reduced fuel consumption, little is known about any potential safety issues relating to such slow steaming speeds. In extreme seas and adverse weather conditions, ships operating at design speeds have sufficient power to comfortably navigate their way through such conditions towards calmer areas. It is not known whether ships operating under slow steaming conditions would also have sufficient power to deal with such a situation; they may experience stability problems, such as parametric rolling, without enough power to easily sail away from the adverse conditions. This is left as a piece of future research. Additionally, taking into account the current fuel prices this study will be extended by providing an estimated fuel savings from applying a slow steaming approach.
Acknowledgements
The corresponding author would like to thank Miss Holly Yu for her help with the final proofreading.
References
Arribas, F.P., 2007. Some Methods to Obtain the Added Resistance of a Ship Advancing in Waves. Ocean Engineering 34(7), 946–955, doi: 10.1016/j.oceaneng.2006.06.002.
Banks, C., Turan, O., Incecik, A., Theotokatos, G., Izkan, S., Shewell, C., Tian, X., 2013. Understanding Ship Operating Profiles with an aim to Improve Energy Efficient Ship Operations. In: Proceedings of the Low Carbon Shipping Conference, London, pp. 1–11.
Bales, S.L., 1982. Designing Ships to the Natural Environment. David W. Taylor Naval Ship Research and Development Center. Fathi, D., Hoff, J.R., 2013. ShipX Vessel Responses (VERES) Theory Manual. Marintek Report, Norway.
Fonseca, N., Soares C.G., 2004a. Experimental Investigation of the Nonlinear Effects on the Vertical Motions and Loads of a Containership in Regular Waves. Journal of Ship Research 48(2), 118–147.
Fonseca, N., Soares C.G., 2004b. Experimental Investigation of the Nonlinear Effects on the Statistics of Vertical Motions and Loads of a Containership in Irregular Waves. Journal of Ship Research 48(2), 148–167.
Fujii, H., Takahashi, T., 1975. Experimental Study on the Resistance Increase of a Ship in Regular Oblique Waves. In: Proceedings of the 14th International Towing Tank Conference (ITTC), Ottawa, Vol. 4, pp. 351–360.
Gerritsma, J., Beukelman, W., 1972. Analysis of the Resistance Increase in Waves of a Fast Cargo Ship. International Shipbuilding Progress 19(217), 285–293.
Nakamura, S., Naito, S., 1977. Propulsive Performance of a Container Ship in Waves. Journal of the Society of Naval Architects of Japan 15(1), 24–48.
Pierson, W.J., Moskowitz, L., 1964. A Proposed Spectral Form for Fully Developed Wind Seas based on the Similarity Theory of S.A. Kitaigorodskii. Journal of Geophysical Research 69, 5181–5190.
Salvesen, N., Tuck, E.O., Faltinsen, O., 1970. Ship Motions and Sea Loads. Transactions of the Society of Naval Architects and Marine Engineers 78, 250–287.
Tezdogan, T., Demirel, Y. K., Kellett, P., Khorasanchi, M., Incecik, A., Turan, O., 2015. Full-scale Unsteady RANS CFD Simulations of Ship Behaviour and Performance in Head Seas due to Slow Steaming. Ocean Engineering 97, 186–206.