City, University of London Institutional Repository
Citation
:
Cartwright, M., Traviss, G. & Blance, A. (2012). Murder, muddled thinking and
multilevel modelling. Psychologist, 25(9), pp. 690-693.
This is the accepted version of the paper.
This version of the publication may differ from the final published
version.
Permanent repository link:
http://openaccess.city.ac.uk/14840/
Link to published version
:
Copyright and reuse:
City Research Online aims to make research
outputs of City, University of London available to a wider audience.
Copyright and Moral Rights remain with the author(s) and/or copyright
holders. URLs from City Research Online may be freely distributed and
linked to.
City Research Online:
http://openaccess.city.ac.uk/
[email protected]
Murder, Muddled Thinking and Multilevel Modelling
Authors: Martin Cartwright a, Gemma Traviss b, Andrew Blance c
a
Health Services Research, City University, London, UK
b
Leeds Institute of Health Sciences, University of Leeds, UK
c
Leeds Institute of Genetics, Health and Therapeutics, University of Leeds, UK
On 15th July 2005 Sir Roy Meadow, eminent paediatrician, was struck off by the General Medical Council (GMC) for the “misleading” evidence he gave as an expert witness in the Sally Clark baby death case in 1999 (BBC, 2006)†. Mrs Clark was wrongly convicted of killing her two baby sons and jailed for life. Meadow told the jury the chance of two natural unexplained cot deaths in the same family was 1-in-73 million and would only occur once every 100 years in a population the size of England, Wales and Scotland (Hill, 2005). The implication of Meadow’s testimony was that the two deaths were not natural events thereby supporting the prosecution’s contention that the babies were killed at the hands of their mother.
Non-Independence of Observations
The statistical errors in Meadow’s testimony conspicuously reflect flaws in statistical thinking across much contemporary research in Medicine and Psychology. The most fundamental error in Meadow’s testimony was that he treated the two deaths as occurring independently and squared the probability of a single event occurring to reach the figure of 1-in-73 million for the co-occurrence of two events (RSS, 2001). This calculation fails to recognise that the events occurred in the same context, in this case family, and the babies therefore shared many influences that could account for their deaths (e.g. genetics, parenting practices). Such shared influences mean that the probability of a second cot death occurring in a family that has already experienced one is higher than a first cot death in a family that has not (Watkins, 2000; Hill, 2004). The true probability of a second cot death occurring in the same family has been estimated to be between 1-in-60 and 1-in-400 but could be as high as 1-in-4 where the genetic influence is strong (Hill, 2002).
Most commonly encountered statistical tests can be seen as special cases of a statistical family known as the Generalised Linear Model (GLM). Analysis of variance (t-test, F-test, ANOVA, ANCOVA, MANOVA, MANCOVA) and regression techniques (linear, logistic, Poisson) can all be derived from the GLM. The underlying statistical similarity implied by the GLM explains why these various tests make similar assumptions about data. One key assumption shared by all these tests is that the observations or data are independent. In psychology research, data often take the form of observed behaviour or self-report questionnaires. Researchers typically assume the condition of independence has been met if the responses or behaviour of one participant are not observed to directly influence those of another. While this criterion may seem reasonable, it is too narrow for many sampling frames that are encountered in human research and fails to recognise contextual influences on multiple participants that contravene the assumption of independence.
Example: Health anxiety and medical help seeking
Consider a study where researchers examine the link between health anxiety and medical help-seeking. Figure 1a presents a scatterplot of self-reported health anxiety against the frequency of GP visits over the previous year. The graph reveals a positive relationship between the variables (i.e. greater anxiety is associated with more visits). The line of best fit is described by a linear regression equation shown on the graph.
Figure 1b shows the same graph but now links data points contributed by four randomly selected participants on four occasions. The fit lines and regression equations for these four participants demonstrate that there are different relationships between health anxiety and GP visits and that the pattern of data points is more similar within participants than between participants. Thus, by
examining observations collected from each participant on different occasions, we begin to see
structure within the data that was previously erroneously ignored when the data were assumed to be independent.
Furthermore, participants were recruited from five family groups, with three participants per family (5 families x 3 members = 15 participants). Data contributed by participants belonging to the same family are likely to be non-independent to the extent that concerns about health and medical help-seeking are affected by social influence. Figure 1c shows highlights all data points contributed by members of each family. This shows that patterns of data are more similar for participants within families than
between families.
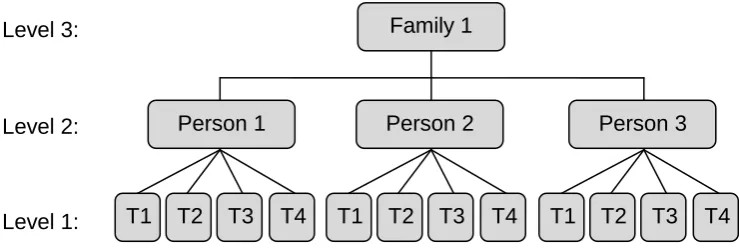
Dealing with Data Hierarchies
We have already identified hierarchical data structures in Figure 1, observations (i.e. measurement occasions) nested within individuals and individuals nested within families. This is a 3-level hierarchical structure (Figure 2) but it could have been truncated to 2-levels if the research was cross-sectional, individuals (nested within) families, or extended to 4-levels if the longitudinal study had also collected data about the GPs consulted, observations individuals families GPs. Once you learn to recognise hierarchies, you start to see them everywhere. In the education system, for example, we see pupils classes schools, in psychotherapy we see clients therapists and in experimental psychology we commonly see time series hierarchies such as
repeated measures (e.g. reaction times) individuals.
There is no limit to the number of levels a hierarchy can have but in all hierarchies a higher level unit represents a potential contextual influence on all lower level units. Pupils in the same class, for example, will be exposed to similar influences since they all share the same teacher(s), classroom(s) and social environment. It is these contextual or class-specific influences that lead pupils in the same class to be, on average, more similar than pupils in different classes. Contextual influences may exert influence at all levels of a hierarchy.
It is not only observations between individuals that can be represented as hierarchies but also observations nested within individuals. Unlike traditional methods MLM approaches are appropriate for designs that require individuals to be assessed on more than one occasion. Time series designs
are particularly common in psychology and range from experimental repeated measures laboratory studies (with repeat assessments taken over a period of a few seconds or minutes) through to longitudinal studies (with repeated measures taken over a period of many months or years). Much experimental psychology employs repeated measures designs in which participants complete multiple trials under different conditions using measures such as reaction times, neural activity (ERP, EEG, fMRI), skin conductance, cardiovascular reactivity (e.g. heart rate, heart rate variability), muscle activity (electromyography), eye movements, changes in pupil diameter and other
psychophysiological outcomes. In all time series designs the individual is not at the bottom of the hierarchy, but higher up with observations (i.e. repeated assessments) nested within the individual.
Given that hierarchies are so pervasive, and assert non-independence of data, researchers to need carefully consider how to deal with such circumstances. Several approaches are available:
Aggregated approach: A somewhat different approach is to aggregate data from lower level units to higher level units. Accordingly, classes are attributed variables based on aggregated data that was measured at the pupil level. This reduces the units of analysis from 600 (pupils) to 20 (schools). The aggregated approach acknowledges the hierarchical nature of the data but deals with this by dropping the lower level(s) from the analysis altogether. Although this leads to the loss of all lower level data, the aggregated method is statistically valid provided the data are balanced and inferences are limited to the level of aggregation (class). In psychology a common example of the aggregated approach occurs when researchers aggregate reaction times (or other psychophysiological measures) over a series of trials and then analyse the data using ANOVA with each person contributing a mean or median reaction time rather than a series of data. However, whenever the aggregated approach is employed there is always a temptation to draw inferences about lower levels units leading to
ecological fallacy (Robinson, 1950). In addition using the aggregated approach inflates the anticipated rate of Type II errors (failing to reject the null hypothesis when it is false, or setting a guilty man free).
Multi-level modelling: A more sophisticated approach is an extension of standard regression known as multilevel modelling (MLM). MLM exploits the full data structure; therefore no information on the lower level is lost. Furthermore, as MLM explicitly models the hierarchy it yields correctly specified estimates of the SEs and both Type I and II error rates. MLM also allows considerations of the degree to which lower levels are dependent on higher levels.
The costs of failing to apply appropriate multilevel analysis to data with hierarchical structure can result in highly spurious results. Twisk (2006) compared disaggregated, aggregated and MLM approaches to evaluate a health intervention delivered to patients nested within GPs. For a balanced
dataset the three approaches produced identical estimates of the treatment effect but with very different SEs and p-values. When the analyses were repeated with an unbalanced dataset (which is much more likely for real world research) the estimates of the treatment effect, associated SEs and p-values were substantially different for disaggregated (β = 0.27; SE = 0.14; p < 0.05), aggregated (β = 0.18; SE = 0.23; p = 0.43) and MLM (β = 0.19; SE = 0.22; p = 0.39) approaches.
Why is MLM important?
The most powerful argument in favour of the MLM approach is simply that it is the correct analysis for hierarchical data because it avoids the distortions of GLM methods. While the concepts underlying MLM are far from simple, the approach offers a great deal of flexibility and overcomes weaknesses of standard single-level techniques. For example, the assumption of homogeneity (that residuals have a constant variance across all values of each covariate) can be relaxed as MLM can explicitly model this variance which leads to more accurate estimates of fixed effects and their SEs. As outlined above, multilevel approaches do not require balanced datasets and are particularly good at handling missing values in time series data where, in some circumstances, they perform better than alternative imputation methods. MLM is especially well suited to psychological research where many outcomes of interest (e.g. mental health, lifestyle behaviours) are a result of both individual (lower level) and socio-cultural (higher level) factors. The partitioning of variance between levels of the hierarchy, the accuracy of estimates of fixed effects and the modelling of random variation affords MLM the potential to open doors to new insights into the effects of context on individual phenomena (e.g. development, cognition, emotional, behaviour).
The commonplace failure of researchers to apply appropriate analyses to their data represents the same muddled thinking as evidenced by Roy Meadow in his expert witness testimony. While the immediate consequences of such statistical illiteracy for most psychology researchers may seem more remote than for expert witnesses, the cumulative costs for the discipline are profound.
Psychological research not only influences practice and policy in a multitude of areas, but also directs allocation of resources. It is therefore incumbent on all psychologists, whether consumers or
producers of research evidence, to become familiar with multilevel approaches and ensure that these methods are applied where appropriate in our own research and recognise where others have failed to do this.
MLM can be difficult to implement and interpret, especially when analysing random factors. Despite these barriers, MLM is becoming more easily accessible. Commercial (SPSS, STATA, SAS) and free (MLwiN, R) software capable of implementing MLM is now widely available, and there are an
increasing number of introductory texts and online resources that describe how to implement MLM (see References and Further Reading & Resources). For those who prefer more formal learning there are also a growing number of short courses available around the UK (e.g.
http://www.leeds.ac.uk/statistical_thinking/ ; http://www.bristol.ac.uk/cmm/learning/course.html). With more opportunities to learn about MLM than ever before the time has come for psychology researchers to embrace this flexible approach for exploiting data structure. We should no longer convict the innocent but, instead, ensure we do our research justice!
Footnote
† In 2006 Sir Roy Meadow successfully challenged the GMC decision in the High Court. Mr Justine Collins ruled in Meadow’s favour on the basis that his testimony did not constitute “serious professional misconduct” (Roberts, 2006).This controversial ruling fully accepted the criticisms of Meadow’s statistical evidence. Meadow also gave evidence in the cases of Angela Canning and Donna Anthony who served 18 months and six years respectively after being wrongfully convicted of killing their own children. These cases continue to influence rules governing prosecutions for shaken baby syndrome and eye witness testimony.
References
BBC News (2006). Sally Clark doctor wins GMC case. http://news.bbc.co.uk/1/hi/health/4720334.stm
(accessed 16 July 2011).
Hill, R. (2004). Multiple sudden infant deaths – coincidence or beyond coincidence? Paediatric and Perinatal Epidemiology 2004,18, 320–326
Hill, R. (2005). Reflections on the cot death cases. Significance, 2, 13-15.
Roberts, G. (2006). Disgraced Meadow reinstated by judge. The Independent, 18 February,
http://www.independent.co.uk/news/uk/crime/disgraced-meadow-reinstated-by-judge-466929.html
(accessed 16 July 2011).
Robinson, W.S. (1950). Ecological correlations and the behavior of individuals. American Sociological Review, 15 (3): 351–357.
Royal Statistical Society (2001). Royal Statistical Society concerned by issues raised in Sally Clark case. http://www.sallyclark.org.uk/RSS.html (accessed 16 July 2011)
Twisk, J.W.R. (2006). Applied Multi-level Analysis: Practical guides to biostatistics and epidemiology. Cambridge: Cambridge University Press.
Watkins, S.J. (2000). Conviction by mathematical error? Doctors and lawyers should get probability theory right. BMJ 2000;320:2–3
Further Reading & Resources
Batt, J. (2005). Stolen Innocence: The Sally Clark Story - A Mother's Fight for Justice. London: Ebury Press.
Centre for Multi-level Modelling
http://www.bristol.ac.uk/cmm/
Gilthorpe, M.S., Maddick, I.H. & Petrie, A. (2007). Introduction to multilevel modelling in dental research. Community Dental Health, 17(4), 222-6.
Field, A. P., & Miles, J. M. V. (2010). Discovering statistics using SAS. London: Sage.
Field, A. P., & Wright, D. B. (2011). A Primer on Using Multilevel Models in Clinical and Experimental Psychopathology Research. Journal of Experimental Psychopathology, 2(2), 271–293.
Field, A. P., Miles, J. M. V., & Field, Z. C. (in press). Discovering statistics using R. London: Sage.
Kreft, I.G.G. & de Leeuw, J. (1998). Introducing Multilevel Modeling. London: Sage Publications.
Wright, D. B. (1998). Modelling clustered data in autobiographical memory research: The multilevel approach. Applied Cognitive Psychology, 12, 339-357.
[image:6.595.85.511.382.646.2]Wright, D.B. & London, K. (2009). Multilevel modelling: Beyond the basic applications. British Journal of Mathematical and Statistical Psychology, 62, 439–456
Figure 1 Health anxiety and GP visits
(a.) Relationship between health anxiety and GP visits with independence assumed
(b.) Relationships between health anxiety and GP visits based on repeated observations
from five participants (
red
,
green
,
pink
,
blue
,
orange
) on four occasions
0 1 2 3 4 5 6
0 1 2 3 4 5 6 7 8 9 10
V
is
its
to
G
P
o
ve
r
p
re
vi
o
u
s
ye
ar
(c.) Relationships between health anxiety and GP visits based on repeated observations
from five families (
red
,
green
,
pink
,
blue
,
orange
) on four occasions
0 1 2 3 4 5 6
0 1 2 3 4 5 6 7 8 9 10
V
isi
ts
to
G
P
o
ve
r
p
rev
io
u
s
ye
ar
Health Anxiety
y = -0.6 + 0.9x
y = 1.1 + 0.4x
y = 3
y = -21.9 + 3.8x
y = 0.6x
0 1 2 3 4 5 6
0 1 2 3 4 5 6 7 8 9 10
V
is
its
to
G
P
o
ve
r
p
re
vi
o
u
s
ye
ar
Health Anxiety
y = -0.3 + 0.7x
y = 0.1 + 0.6x
y = 2.0 + 0.2x
y = 1.4 + 0.4x
Figure 2 An example of a three-level hierarchy
Note: T1 - T4 represent different measurement occasions which may take place over a period of minutes (as in repeated measures laboratory studies) or over a period of months or years (as in observational longitudinal studies or randomised controlled trials with multiple long-term follow-ups).