Research article
Multiobjective evolutionary optimization of water distribution
systems: Exploiting diversity with infeasible solutions
Tiku T. Tanyimboh
*, Alemtsehay G. Seyoum
Department of Civil and Environmental Engineering, University of Strathclyde, James Weir Building, 75 Montrose Street, Glasgow G1 1XJ, UK
a r t i c l e i n f o
Article history: Received 3 April 2016 Received in revised form 17 August 2016 Accepted 19 August 2016 Available online 30 August 2016
Keywords: Water supply Dynamic simulation Constraint handling Minimum solution vector Maximum solution vector Infrastructure planning
a b s t r a c t
This article investigates the computational efficiency of constraint handling in multi-objective evolu-tionary optimization algorithms for water distribution systems. The methodology investigated here encourages the co-existence and simultaneous development including crossbreeding of subpopulations of cost-effective feasible and infeasible solutions based on Pareto dominance. This yields a boundary search approach that also promotes diversity in the gene pool throughout the progress of the optimi-zation by exploiting the full spectrum of non-dominated infeasible solutions. The relative effectiveness of small and moderate population sizes with respect to the number of decision variables is investigated also. The results reveal the optimization algorithm to be efficient, stable and robust. It found optimal and near-optimal solutions reliably and efficiently. The real-world system based optimization problem involved multiple variable head supply nodes, 29fire-fightingflows, extended period simulation and multiple demand categories including water loss. The least cost solutions found satisfied theflow and pressure requirements consistently. The best solutions achieved indicative savings of 48.1% and 48.2% based on the cost of the pipes in the existing network, for populations of 200 and 1000, respectively. The population of 1000 achieved slightly better results overall.
©2016 The Authors. Published by Elsevier Ltd. This is an open access article under the CC BY license (http://creativecommons.org/licenses/by/4.0/).
1. Introduction
An effective solution method that is reliable and easy to use is required for the optimization of water supply systems that provide an essential service in the communities they serve worldwide. Optimization addresses not only the capital and operating costs along with hydraulic performance and reliability but also increas-ingly the efficient management of energy and scarce water re-sources and other environmental concerns (Allam et al., 2016; Cherchi et al., 2015; Kurek and Ostfeld, 2013; Matrosov et al., 2015; Ren et al., 2016; Wang et al., 2016).
Genetic algorithms are used frequently in the optimization of water distribution systems. Generally, genetic algorithms require additional case-specific and/or external procedures to solve opti-mization problems that have constraints and the execution times can be excessive when applied to large optimization problems involving real-world water distribution networks with hundreds of pipes, especially those that require extended period simulation.
This paper investigates the computational efficiency of constraint handling in multi-objective evolutionary optimization algorithms for water distribution systems based on the coexistence and simultaneous development including crossbreeding of sub-populations of cost-effective feasible and infeasible solutions that are non-dominated. This yields a boundary search approach that also promotes diversity in the gene pool throughout the progress of the optimization by exploiting the full spectrum of non-dominated infeasible solutions.
Results for a real-world network with variable-head supply nodes, variable demands, multiple demand categories and operating conditions includingfire-fightingflows are included to illustrate the methodology. The relative merits of small and moderate population sizes compared to the number of decision variables were investi-gated also. The multiobjective genetic algorithm formulation we developed does not require any additional case-specific or external procedures for the minimum node pressure constraints. Embedded in the genetic algorithm, the hydraulic analysis model can simulate realistically both feasible and infeasible solutions, with fitness directly related to the hydraulic properties.
Many optimization models have been proposed previously including mathematical programming approaches such as linear
*Corresponding author.
E-mail addresses:[email protected] (T.T. Tanyimboh), alemtsehay. [email protected](A.G. Seyoum).
Contents lists available atScienceDirect
Journal of Environmental Management
j o u r n a l h o m e p a g e : w w w . e l s e v ie r . c o m / l o c a t e / j e n v m a n
http://dx.doi.org/10.1016/j.jenvman.2016.08.048
and non-linear programming with the design variables assumed to be continuous (Alperovits and Shamir, 1977). Evolutionary algo-rithms have gained widespread acceptance in recent years. Some examples include genetic algorithms (Dandy et al., 1996), ant col-ony optimization (Ostfeld and Tubaltzev, 2008), particle swarm optimization (Montalvo et al., 2008), simulated annealing (Marques et al., 2015), shuffled frog leaping (Eusuff and Lansey, 2003), dif-ferential evolution (Zheng et al., 2015), harmony search (Geem, 2006) and tabu search (Cunha and Ribeiro, 2004). Genetic algo-rithms are used extensively in the optimization of water distribu-tion systems in areas such as pump operadistribu-tion scheduling (Rao and Salomons, 2007), leakage minimization (Creaco and Pezzinga, 2015) design and rehabilitation (Bi et al., 2015), water quality optimization (Farmani et al., 2006) and service reservoir location, design and operation (Prasad, 2010; Siew et al., 2016).
Inspired by Darwin's theory of evolution, genetic algorithms use natural selection as the driving force. A genetic algorithm involves a population of individuals that are represented as chromosomes, each consisting of a set of genes that describe a solution. Individuals are selected from the population to create a mating pool based on their respectivefitness levels. Individuals with a higherfitness level have a higher probability of being selected to produce offspring that represent new solutions. A very small proportion of the offspring will mutate after reproduction. Genetic operators consist of selec-tion, crossover and mutation. Crossover involves the creation of new offspring by transforming two or more individuals. Mutation randomly changes an individual to help increase genetic diversity. Selection drives the search towards the regions with the fittest individuals i.e. the best solutions. Roulette wheel and tournament selection (Goldberg and Deb, 1991) are examples of selection op-erators. Tournaments are often preferred as the roulette wheel operator is characterised by rapid loss of genetic diversity that may cause premature convergence (Goldberg and Deb, 1991). An assessment of the operators applied in evolutionary algorithms is available inMcClymont et al. (2015).
There have been many attempts to enhance genetic algorithms. Examples include Gray coding (Dandy et al., 1996), real coding (Vairavamoorthy and Ali, 2000), integer coding (Barlow and Tanyimboh, 2014), creeping or adjacency mutation (Barlow and Tanyimboh, 2014; Dandy et al., 1996), variable mutation rate (Kadu et al., 2008) and the mapping of redundant binary codes to closed pipes (Saleh and Tanyimboh, 2014). Referring to the above-mentioned schemes, the candidate solutions in a genetic algo-rithm may be represented in different ways. Binary coding is a common scheme where problem variables are represented by bit combinations of 0s and 1s. Gray coding is similar to binary coding, but differs in that only a single bit changes in the representation of adjacent values of the decision variables. In real and integer coding, genes are represented as real numbers and integers, respectively.
A simulation model helps ascertain thefitness of every indi-vidual in the population of solutions. Vairavamoorthy and Ali (2000)used a regression model that approximates the hydraulic properties.Vairavamoorthy and Ali (2005)andKadu et al. (2008) used solution space reduction methods that limit the scope of the search, to reduce the execution times of the algorithms. Also, par-allel algorithms have been used to improve the execution times in examples such asBalla and Lingireddy (2000)for model calibration, Ewald et al. (2008)for the location of booster chlorination stations andBarlow and Tanyimboh (2014)for pipe sizing.
Constraints in the optimization problems are often addressed using penalty functions based on the severity of constraint viola-tion, as inKougias and Theodossiou (2013), for example. Many re-searchers have attempted to address the difficulties associated with penalty functions (Dridi et al., 2008). For example, Khu and Keedwell (2005) considered node pressure constraints as
additional objectives.Prasad (2010)used a constraint dominance tournament (Deb et al., 2002).Wu and Simpson (2002)developed a self-adaptive penalty method.Farmani et al. (2005)proposed a self-adaptivefitness procedure that does not require parameter cali-bration.Saleh and Tanyimboh (2013, 2014)developed a penalty-free approach for joint topology and pipe size optimization.
The optimization of real-world water distribution systems in-volves multiple objectives that tend to be in conflict, e.g. mini-mizing capital and operating costs whilst simultaneously maximizing hydraulic performance and reliability. A multi-objective optimization approach is suitable for such problems as it produces a set of non-dominated solutions that are equal in rank. Such solutions are said to be Pareto-optimal as it is not possible to improve the solutions in any objective without making at least one of the other objectives worse. Pareto-optimal solutions are practical as they offerflexibility, since thefinal choice of the decision maker is a trade-off.
Evolutionary optimization approaches such as genetic algo-rithms are suited to multiobjective optimization problems (Konak et al., 2006). Strength Pareto Evolutionary Algorithm (Zitzler and Thiele, 1998), Nondominated Sorting Genetic Algorithm II (Deb et al., 2002) and Pareto Archived Evolution Strategy (Knowles and Corne, 2000) are some of the common multiobjective evolu-tionary algorithms. Elitism is one of the key factors for successful application of multiobjective evolutionary algorithms that helps to prevent the loss of good solutions and achieve better convergence (Bekele and Nicklow, 2005; Kollat and Reed, 2006; Zitzler et al., 2000). The Nondominated Sorting Genetic Algorithm NSGA II is popular due to its efficient nondominated sorting procedure and strong global elitism that preserves all elites from both the parent and child populations.
An additional advantage of NSGA II is that it requires few user-specified parameters (Dridi et al., 2008). Its use in the optimiza-tion of water distribuoptimiza-tion systems is widespread. For example, Farmani et al. (2006) optimised the design and operation of a network that included pump scheduling and tank location and design. Jayaram and Srinivasan (2008) optimised design and rehabilitation based on whole-life costing. Jeong and Abraham (2006) optimised operational response strategy to mitigate the consequences of deliberate attacks.Preis and Ostfeld (2008)and Weickgenannt et al. (2010) optimised sensor placement for contamination detection.Nicolini et al. (2011)optimised leakage management. Additional applications of NSGA II in water distri-bution systems includeSaleh and Tanyimboh (2013, 2014) who optimised topology and pipe sizing andZheng and Zecchin (2014) who investigated a two-stage optimization approach.
Furthermore, evolutionary algorithms can potentially locate the neighbourhood that has the global optimum in the solution space while local search methods canfind local optima more rapidly. For example,Haghighi et al. (2011) incorporated integer linear pro-gramming while Barlow and Tanyimboh (2014) included local search and cultural improvement operators. Wang et al. (2015) have compared the performance of two hybrid search procedures to NSGA II while other algorithms investigated previously include ParEGO, LEMMO and PESA-II (di Pierro et al., 2009).
compared to the number of decision variables also.
2. Optimization approach
Evolutionary algorithms typically start with a randomly gener-ated set of potential solutions that may include both feasible and infeasible solutions. To address violations of the node pressure constraints in water distribution systems, penalty methods have been applied widely (Kougias and Theodossiou, 2013; Ostfeld and Tubaltzev, 2008). The major drawback of the penalty methods is that in general additional case-specific parameters are required whose calibration is generally challenging (Dridi et al., 2008; Saleh and Tanyimboh, 2013; Siew et al., 2014).
2.1. Fitness assessment with particular reference to infeasible solutions
In an attempt to alleviate the difficulties that the minimum node pressure constraints pose,Siew and Tanyimboh (2012b)developed an approach in which violations of the minimum node pressures are addressed in the hydraulic simulation model through pressure-driven analysis. Pressure-pressure-driven analysis takes proper account of the relationship between theflow and pressure at a demand node (Gupta and Bhave, 1996; Tanyimboh et al., 1997). Solutions with insufficient pressure do not satisfy the demands in full and the resulting shortfall is a real measure of the deficiency in hydraulic performance (Kalungi and Tanyimboh, 2003). Hence, pressure-driven analysis addresses the minimum node pressure con-straints seamlessly.
The genetic algorithm used herein to design the water distri-bution system employs a pressure-driven extension of EPANET 2 (Rossman, 2000) known as EPANET-PDX (pressure-dependent extension) (Seyoum and Tanyimboh, 2014a; Siew and Tanyimboh, 2012a). EPANET-PDX incorporates the pressure-dependent node flow function thatTanyimboh and Templeman (2010)introduced, in the hydraulic analysis model in EPANET 2.Siew and Tanyimboh (2012a)developed EPANET-PDX by upgrading the source code of EPANET 2 in the C/Cþþ programming language. Seyoum and Tanyimboh (2014b)improved EPANET-PDX further for better per-formance under conditions of extremely low pressure (Seyoum, 2015). Moreover, with increasing emphasis on water loss man-agement due partly to more stringent regulations and greater environmental awareness, leakage management based on pressure-dependent modelling is known to be effective (Wu et al., 2011). The network investigated subsequently in this article (Sec-tions3 and 4) includes water loss as a separate demand category.
Previous successful applications of the genetic algorithm (abbreviated as PF-MOEA, i.e. penalty-free multi-objective evolu-tionary algorithm) include design, rehabilitation and capacity expansion applied to multiple benchmark networks in the litera-ture including the Hanoi network, New York Tunnels and the town of Wobulenzi, Uganda, network (Siew and Tanyimboh, 2012b; Siew et al., 2014). Whole-life costing, water demand growth, temporal variations in the structural integrity and roughness of pipes and other factors were addressed. Overall, the algorithm achieved su-perior results for all the optimization problems considered in terms of cost, hydraulic performance and/or computational efficiency compared to all other algorithms in the literature.
PF-MOEA is practical and requires no prior network simplifi ca-tion or addica-tional parameters. Moreover the algorithm has per-formed well to date with the most basic operators i.e. single-point crossover and single-bit mutation. By contrast the differential evolution algorithm inZheng et al. (2011)required complex and extensive problem simplification and pre-processing based on a combination of graph theory, non-linear programming with
commercial software and solution space reduction. Furthermore, the methodology is limited in scope in that it is not readily appli-cable to the more realistic real-world problems that involve reha-bilitation, networks with pumps, multiple operating conditions and/or continuously varying demands.
Similarly, Barlow and Tanyimboh's (2014) multiobjective memetic algorithm utilised many operators (e.g. random mutation, creeping mutation, local and cultural improvement operators) and additional user-specified parameters (e.g. frequency of applying local and cultural improvement operators, number of individuals selected for cultural improvement, percentage of the non-dominated front available for local improvement, etc.) that infl u-ence the effectiveness of the algorithm. In addition, Barlow and Tanyimboh (2014)generated only the least-cost feasible solutions as the algorithm searches only in the infeasible portion of the so-lution space. PF-MOEA on the other hand provides a range of effi -cient feasible and infeasible solutions that allow considerable flexibility in choosing a particular solution.
Barlow and Tanyimboh (2014) compared the results of their memetic algorithm to NSGA II using the Kadu et al. (2008)
benchmark network. The memetic algorithm sampled
1.01244109solutions in total. For the same problem, PF-MOEA achieved comparable results by sampling only 15106solutions (Siew et al., 2014). Furthermore, PF-MOEA achieved over 4000 feasible solutions that are cheaper than the previous best solution inKadu et al. (2008). It is worth noting also that the two previous best solutions inKadu et al. (2008)andHaghighi et al. (2011)were infeasible.
For the benchmark network inAlperovits and Shamir (1977), PF-MOEA achieved the least cost solution of $420,000 within 2600 function evaluations whereas Savic and Walters (1997) needed 250,000 function evaluations. To the best of our knowledge PF-MOEA is the only algorithm that has consistently achieved good results on the established benchmark problems, compared to all other algorithms collectively. The preceding characterization notwithstanding, its performance on complex problems with large solution spaces remains entirely unknown. The aim of this paper is to investigate whether the constraint handling approach intro-duced in PF-MOEA is viable for serious computationally intensive optimization problems in the real world.
2.2. Formulation of the multiobjective optimization model
The total capital and operating cost of the network and its hy-draulic performance are the two conflicting objectives considered. The two objectives produce a set of non-dominated solutions that are equal in rank, based on the trade-off between cost and hy-draulic performance. Thefirst objective function is
f1ðiÞ¼
c
2i ; i¼1; :::; Np (1)
Npis the population size;iand (i) refer to theith solution;
c
iis the ratio of the cost of solutionito the cost of the most expensive solution in the same generation.c
i¼Ci
MaxðCi; i¼1; :::; NpÞ ; i¼1; :::; Np (2)
Ciis the cost of solutioni. The second objective function is
f2ðiÞ¼ 1TXT t¼1
s
t;i!4
; i¼1; :::; Np (3)
ratio of the total availableflow of the network to the requiredflow, for time steptof the extended period simulation.Tis the number of hydraulic time steps.
In the function f2, the expression in parentheses is the mean value of the demand satisfaction ratio (DSR) for the network as a whole, for the entire operating cycle (Ackley et al., 2001; Siew and Tanyimboh, 2012b; Siew et al., 2014). Both objective functions take values from zero to one; f1 is minimised while f2 is maximized (Ackley et al., 2001). A solution that has a demand satisfaction ratio that is less than unity is infeasible and cannot satisfy all the nodal demands in full. The demands are satisfied in full if the distribution network has sufficient capacity and pressure (Tanyimboh et al., 1997).
2.3. Features of the proposed multiobjective evolutionary optimization approach
The decision variables are represented using binary coding. The genetic operators used are single-point crossover, single-bit mu-tation per solution and binary tournament selection for crossover. The crossover point is selected randomly. The probability of crossover is always 1.0 by default. Bit mutation reverses the selected bit from 0 to 1, or vice versa. The solutions that mutate are selected randomly to fulfil the user-specified mutation rate. The two extremes of the solution space are always included in the initial population by default. The solution vector at the lower end consists entirely of the smallest values of the decision variables. Conversely, the solution vector at the upper end consists entirely of the largest values of the decision variables. The remainingðNp2Þsolutions are generated randomly;Np,defined previously, is the population size. A key feature of the algorithm is that it exploits the response i.e. properties of all feasible and infeasible solutions generated in full. For water distribution systems, an efficient and reliable pressure-driven analysis procedure (e.g. EPANET-PDX) is thus a pre-requisite.
PF-MOEA does not use constraint dominance (Deb et al., 2002). Instead, the algorithm assesses and rates all feasible and infeasible solutions in every generation strictly according to their costs and hydraulic performances usingf1andf2, respectively. Moreover, if the number of solutions in the best non-dominated front exceeds the population sizeNp, an additional level of elitism formulated in PF-MOEA ensures that the cheapest feasible solutions make up 30% of the population in the next generation. Selection of the remaining 70% of the population considers the crowding distance. The crowding distance (Deb et al., 2002) is a measure of the spatial density of the solutions in the objective space that facilitates the achievement of a relatively uniform distribution of solutions in the Pareto-optimal front.
3. Network design example
The example provided to illustrate the properties of the opti-mization algorithm is a water supply zone of a network in the UK. The problem involves multiple loadings, multiple variable-head supply sources plus temporal and spatial variations in the nodal demands. The typical execution time of the algorithm for a single optimization run with one million function evaluations is approx-imately 30 days on a workstation with two quad-core 2.4 GHz CPUs and 16 GB RAM. The system was optimised as a new network design that was compared to the existing network, to reveal the amount of spare capacity available for the purposes of long term investment planning. Thus, for example, some of the savings un-covered could be invested to improve water loss management.
3.1. Optimization problem specifications
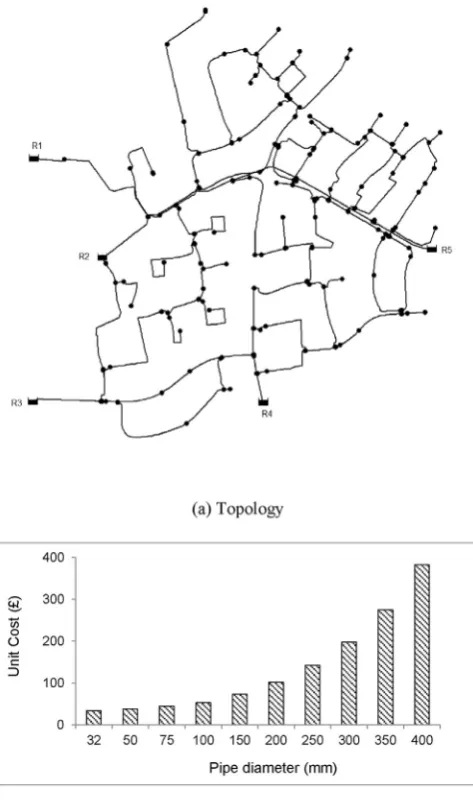
The network consists of 251 pipes of various lengths, 228 de-mand nodes of which 29 arefire hydrants at various locations,five variable-head supply nodes and three demand categories. The de-mand categories comprise domestic and 10-h commercial dede-mands, and unaccounted for water (i.e. water losses). The network also has a fire demand of 1 h at each of the 29fire hydrants located at different positions in the network (Seyoum and Tanyimboh, 2014a). Water loss in distribution networks is a serious problem for both devel-oping and industrialised countries (Farley and Trow, 2003; Thornton et al., 2008; Wu et al., 2011) and consequently water loss manage-ment is a priority for water utilities. Some of the advantages of water loss control include lower energy consumption and delaying the development of new sources along with other associated socio-economic and environmental benefits (Wu et al., 2011). Water los-ses are thus a separate demand category in this network.
[image:4.595.308.545.314.715.2]The minimum residual pressure required was 20 m at the de-mand nodes, and 3 m at thefire hydrants based on afire-flow demand of 8 L per second at the hydrant. The water utility that operates the network provided the system and operational data. Ten commercially available pipe diameters were selected, based on
the pipe diameters in the network that range from 32 mm to 400 mm. The 10 pipe diameters for 251 pipes provide 10251feasible and infeasible solutions in total.Fig. 1a shows the topology of the network whileFig. 1b shows the candidate pipe diameters and their respective costs per metre. The respective average heads at the supply nodes were (HR1, HR2, HR3, HR4, HR5)T ¼(130.33, 129.94, 129.85, 129.88, 130.32 m)T.
Additional details on the pipes and nodes are available as sup-plementary data inFig. A1. The Darcy-Weisbach formula for the headloss due to friction was used in the hydraulic analysis (Rossman, 2000). The pipe roughness heights range from 0.01 mm to 3.0 mm. To ensure consistent comparisons with the existing network, both the network and dynamic operational data, taken from a calibrated EPANET 2 model, were used in the optimization without modification. Pipe roughness values for new pipes that are smoother would likely yield cheaper solutions; however, the cali-brated model inherently includes some built-in assumptions and uncertainty. The extended period simulation was for a period of 31 h with a hydraulic time step of one hour.
There was afire demand at a different hydrant in each hour of the 31-h operating cycle except for thefirst and last hour. Flow velocity constraints were not considered in the optimization pro-cedure but were included in the results for completeness and enhanced understanding of the system. Based on the British Stan-dard for Water Supply Requirements for Systems and Components Outside Buildings (BS EN 805:2000) velocities in the range 0.5e2.0 m/s may be appropriate and, in special circumstances, e.g. fire-fightingflows, velocities up to 3.5 m/s can be acceptable.
3.2. Computational solution
The optimization problem has an enormous solution space of 10251 solutions, with spatial and temporal variations in the de-mands that are significant. The problem is computationally inten-sive, and was solved using high performance computing. The high performance computing facility has 276 compute nodes. Each node has dual Intel Xeon 2.66 GHz CPU of six cores each and 48 GB RAM with the Linux operating system. The typical execution time of the
algorithm for a single optimization run with one million function evaluations is approximately 30 days on a workstation with two quad-core 2.4 GHz CPUs and 16 GB RAM.
[image:5.595.50.557.85.306.2]A four-bit binary string with 16 i.e. 24 codes was used to represent the pipe diameters. A one-to-one mapping of the 10 pipe diameters to the 16 codes leaves six unallocated codes that are thus redundant. The redundant codes were allocated one each to the two smallest and two largest diameters and one each to the two Table 1
Results and performance characteristics of the optimization algorithm.
Properties and criteria Number of simulations permitted
500,000 1,000,000 500,000
Number of optimization runs 20 10 10
Population size 200 1000 1000
aConstruction Cost (£)
Minimum 419,900 (0.09%) 419,514 (0.00%) 432,566 (3.11%)
Maximum 478,356 (14.03%) 432,643 (3.13%) 478,359 (14.03%)
Mean 439,311 (4.72%) 421,938 (0.58%) 446,297 (6.38%)
Median 436,129 (3.96%) 420,408 (0.21%) 441,545 (5.25%)
Standard deviation 15,074 4038 15,000
bNumber of Function Evaluations
to Achieve Convergence
Minimum 476,209 951,000 437,000
Maximum 500,000 998,000 499,000
Mean 493,190 973,700 488,200
Median 497,000 972,000 496,500
Standard deviation 7544 13,849 19,188
bCPU Time to Achieve
Convergence (hours)
Minimum 5.18 11.20 5.45
Maximum 7.16 13.43 6.81
Mean 6.65 12.81 6.43
Median 6.72 13.13 6.72
Standard deviation 0.39 0.82 0.52
aThe values in parentheses are the percentage differences in cost relative to the minimum cost achieved of£419,514.
b Convergence here relates to the best feasible solution achieved in each optimization run. The respective means and medians of the numbers of function evaluation are close to the respective maximum values permitted. This suggests that in theory further reductions in the construction cost may be possible with additional function evaluations.
[image:5.595.335.526.457.684.2]diameters in the middle. When arranged in ascending order, the allocation of the redundant codes is symmetrical and corresponds to the 1st, 2nd, 5th, 6th, 9th and 10th diameters. Other approaches for allocating redundant codes are available in the literature, e.g. Saleh and Tanyimboh (2014). The crossover and mutation proba-bilities werepc¼1.0 andpm¼0.005, respectively. Trial runs to optimizepmandpcwere not carried out.
In total, 30 optimization runs were performed. Two different pollution sizes were investigated: (a) 20 runs with a population of 200; and (b) 10 runs with a population of 1000. For the smaller population of 200 there were 2500 generations, i.e. 500,000 func-tion evaluafunc-tions per run. For the larger populafunc-tion of 1000 there were 1000 generations, i.e. one million function evaluations per run. The total number of function evaluations for each population size was thus 10 million, i.e. 101,000,000 for the population of 1000 and 20 500,000 for the population of 200. The initial populations were generated randomly, except for the cheapest and most expensive solutions available that were included automati-cally by default as explained previously in Subsection 2.3. The cheapest solution has the smallest values of the decision variables while the most expensive has the largest values, i.e. all the pipe diameters were 32 mm or 400 mm, respectively.
Due to the complexity and size of the network, we considered the performance of the entire network forfitness assessment inf2 in Eq.(3).Siew and Tanyimboh (2012b)used the performance of the critical node to achieve much faster convergence. The critical node is time dependent i.e. it changes continually based on the spatial and temporal variations in the nodal demands and is the node with the smallest residual pressure.
4. Results and discussion
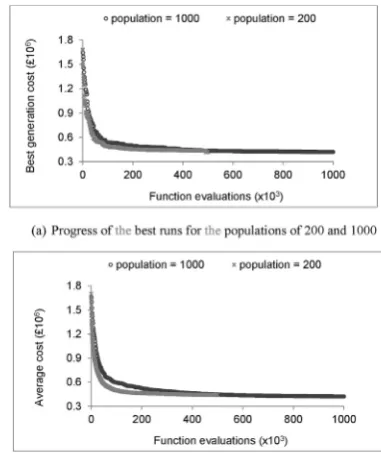
[image:6.595.315.547.278.713.2]The results achieved are summarised inTable 1, with additional details provided assupplementary data. The minimum cost ach-ieved was £419,514 within 985,000 function evaluations for the population of 1,000, and£419,900 within 499,000 function evalu-ations for the population of 200. The average, median and maximum values of the minimum cost for the population of 200 were£439,311,£436,129 and£478,356 respectively. Corresponding values for the population of 1000 were £421,938,£420,408 and £432,643 respectively. The cost of the existing network is£809,700. On average, savings of 45.7% and 47.9% were achieved, for populations of 200 and 1000, respectively. The cheapest feasible solutions achieved represent savings of 48.1% and 48.2%, for pop-ulations of 200 and 1000 respectively. The standard deviation of the minimum cost for the smaller population of 200 was£15,074. For the larger population of 1000 the standard deviation was£4038. These results suggest that the reliability of the algorithm is high considering the complexity of the optimization problem addressed. In each of the measures, the larger population of 1000 out-performed the smaller population of 200. While the population of 1000 provided better results overall, the results would appear to suggest that in a situation where computing resources and/or time are limited, a population of 200 might be preferable. The conver-gence properties of the algorithm and the influence of the popu-lation size are summarised inFig. 2. Convergence was faster with a populationNpof 200 thanNpof 1000. With the smaller population, there would be greater emphasis on exploitation than exploration. The larger population would allow more exploration and diversity in the population, with less selection pressure and slower progress. Table 1reveals that, within 500,000 function evaluations, the smaller population outperformed the larger population. Given the same tournament size of two, the selection pressure in the smaller population is greater than in the larger population due to the increased selection competition frequency in the smaller
population. Whereas the smaller population of 200 requiresfive binary tournament selection cycles to produce 1000 new solutions through crossover, the larger population of 1000 requires only one cycle. Thus, on average, a larger population eliminates inefficient solutions more slowly.
A single optimization run with 1,000,000 function evaluations took approximately 30 days on a workstation with two quad-core 2.4 GHz CPUs and 16 GB RAM. On the other hand, to complete a single optimization run consisting of 500,000 function evaluations, the average CPU time was 6.7 h and the standard deviation was 0.4 h using high performance computing. For 1,000,000 function evaluations the average CPU time was 13.17 h and the standard deviation was 0.94 h using high performance computing. Each optimization run was executed on a single node of the high per-formance computer.
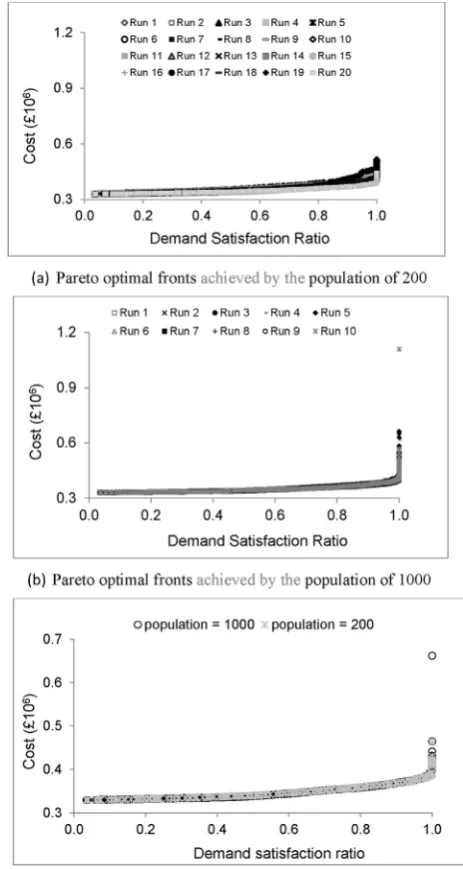
The solutions in the Pareto-optimal fronts of the 20 runs with a population of 200 were combined from which thefinal set of non-dominated solutions (199 solutions in total) was selected. Similarly, for the 10 runs with a population of 1000, thefinal set of
dominated solutions (1083 solutions in total) was obtained after combining the Pareto-optimal fronts. Fig. 3 shows the non-dominated solutions achieved, and the consistent performance of the algorithm.
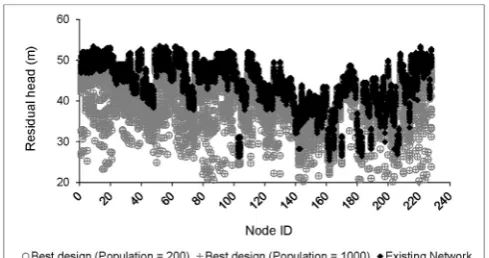
On completing the optimization, the best solutions achieved were re-analysed in EPANET 2 that is a demand-driven analysis model to re-confirm their feasibility.Figs. 4e6show the pipe di-ameters, residual pressures at the nodes and pipe velocities, respectively. The optimised solutions in general have smaller pipe diameters and lower residual pressures than the existing network. It may be noted, however, that the existing network has some pipe diameters that are no longer commercially available. The minimum residual pressure of 20 m at the demand nodes and 3 m atfire hydrants were fulfilled for the entire operating cycle of 31 h. The pressures at thefire hydrants far exceeded the minimum require-ment of 3 m due to the proximity of the demand nodes.
In the optimised designs, 43 velocities in 27 pipes for the pop-ulation of 1000, and 44 velocities in 28 pipes for the poppop-ulation of 200 exceeded the target value of 3.5 m/s. It was observed that high velocities occurred in short sections of pipe that are about 1 m long and located at the pipe junctions. Details of the connections and fittings were not investigated in this research, as the data were not available. The short pipe sections may include various connections andfittings. The velocities that exceeded 3.5 m/s had arithmetic means of 4.6 m/s and 4.7 m/s, respectively, for the populations of 1000 and 200.
While the velocities in the existing network were all less than 3.5 m/s (BS EN 805:2000), a large proportion of the velocities seemed excessively low, based on considerations such as water age and discolouration (Boxall and Saul, 2005; Furnass et al., 2013; Seyoum and Tanyimboh, 2014a). The maximum velocity in the existing network was 1.1 m/s. Based on the maximum velocity of
less than 2.0 m/s (BS EN 805:2000), it appears the network has spare capacity as the optimised solutions indicate very clearly. Although velocity constraints were not included in the optimiza-tion, other feasible solutions in the Pareto-optimal front were available for consideration, and if necessary, minor adjustments could be made in addition. This may be an area for additional research in the future.
5. Conclusions
This article addressed the efficacy of constraint handling in multiobjective evolutionary optimization algorithms for water distribution systems based on the coexistence and simultaneous development of subpopulations of cost-effective feasible and infeasible solutions throughout the execution of the algorithm. The results for both small and moderate population sizes of 200 and 1000 respectively, relative to the number of decision variables, show that the methodology of the search that involves straddling the active constraint boundaries throughout the entire duration of the optimization and promoting diversity in the gene pool based on strict Pareto-dominance is indeed reliable and highly effective. The fraction of the solution space sampled beforefinding optimal and near optimal solutions was consistently less than 10245for the problem investigated here. Consistently good results were achieved without undue reliance on mutation.
The results showed the algorithm to be stable and capable of finding optimal and near-optimal solutions reliably and efficiently. The optimization problem involved multiple supply sources, mul-tiple demand categories and extended period simulation. The al-gorithm provided least-cost solutions that satisfied the flow and pressure requirements consistently. The least-cost solution ob-tained was lower in cost by approximately 48%, compared to the existing network. Considering the relatively low rate of mutation employed, progress towards the solution was consistent, with no stalling or premature convergence. The pressure dependent anal-ysis algorithm EPANET-PDX (Siew and Tanyimboh, 2012a) embedded in the evolutionary optimization algorithm performed reliably well also. It is thus suggested that the methodology be considered for adaptation in other applications along with further sophistication of the genetic operators.
Acknowledgement
[image:7.595.317.561.67.199.2] [image:7.595.48.291.417.542.2]This project was funded in part by the UK Engineering and Physical Sciences Research Council (EPSRC grant reference EP/ G055564/1), the British Government (Overseas Research Students Awards Scheme) and the University of Strathclyde. The authors also Fig. 5.Residual heads for the entire operating cycle.
Fig. 6.Pipeflow velocities for the entire operating cycle.
[image:7.595.46.291.590.719.2]thank Veolia Water UK (now Affinity Water) and the HPC team at the University of Strathclyde for the support they provided. The ARCHIE-WeSt High Performance Computer (www.archie-west.ac. uk), funded by the UK Engineering and Physical Sciences Research Council (EPSRC grant number EP/K000586/1) was used to solve the optimization problem.
Appendix A. Supplementary data
Supplementary data related to this article can be found athttp:// dx.doi.org/10.1016/j.jenvman.2016.08.048.
Conflict of interest
There is no conflict of interest.
References
Ackley, J.R.L., Tanyimboh, T.T., Tahar, B., Templeman, A.B., 2001. Head-driven anal-ysis of water distribution systems. In: Ulanicki, B., Coulbeck, B., Rance, J. (Eds.), Water Software Systems: Theory and Applications. Research Studies Press Ltd, Taunton, England, pp. 183e192.
Allam, A., Tawfik, A., Yoshimura, C., Fleifle, A., 2016. Simulation-based optimization framework for reuse of agricultural drainage water in irrigation. J. Environ. Manage 172, 82e96.
Alperovits, E., Shamir, U., 1977. Design of optimal water distribution systems. Water Resour. Res. 13 (6), 885e900.
Balla, M.C., Lingireddy, S., 2000. Distributed genetic algorithm model on network of personal computers. J. Comput. Civ. Eng. 14 (3), 199e205.
Barlow, E., Tanyimboh, T.T., 2014. Multi-objective memetic algorithm applied to the optimisation of water distribution systems. Water Resour. Manag. 28 (8), 2229e2242.
Bekele, E., Nicklow, J., 2005. Multiobjective management of ecosystem services by integrative watershed modeling and evolutionary algorithms. Water Resour. Res. 41 (10).
Bi, W., Dandy, G.C., Maier, H.R., 2015. Improved genetic algorithm optimization of water distribution system design by incorporating domain knowledge. Environ. Modell. Softw. 69, 370e381.
Boxall, J.B., Saul, A.J., 2005. Modelling discoloration in potable water distribution systems. J. Environ. Eng. 131 (5), 716e725.
British Standards Institution, 2000. Water Supply Requirements for Systems and Components outside Buildings. BS EN 805:2000.
Cherchi, C., Badruzzaman, M., Oppenheimer, J., Bros, C., Jacangelo, J., 2015. Energy and water quality management systems for water utility's operations: a review. J. Environ. Manage 153, 108e120.
Creaco, E., Pezzinga, G., 2015. Embedding linear programming in multi objective genetic algorithms for reducing the size of the search space with application to leakage minimization in water distribution networks. Environ. Modell. Softw. 69, 308e318.
Cunha, M.C., Ribeiro, L., 2004. Tabu search algorithms for water network optimi-zation. Eur. J. Oper. Res. 157 (3), 746e758.
Dandy, G.C., Simpson, A.R., Murphy, L.J., 1996. An improved genetic algorithm for pipe network optimization. Water Resour. Res. 32 (2), 449e458.
Deb, K., Pratap, A., Agarwal, S., Meyarivan, T.A.M.T., 2002. A fast and elitist multi-objective genetic algorithm: NSGA-II. IEEE T. Evol. Comput. 6 (2), 182e197. di Pierro, F., Khu, S.-T., Savic, D., Berardi, L., 2009. Efficient multi-objective optimal
design of water distribution networks on a budget of simulations using hybrid algorithms. Environ. Modell. Softw. 24 (2), 202e213.
Dridi, L., Parizeau, M., Mailhot, A., Villeneuve, J.P., 2008. Using evolutionary opti-mization techniques for scheduling water pipe renewal considering a short planning horizon. Computer-Aided Civ. Infrastructure Eng. 23 (8), 625e635. Eusuff, M.M., Lansey, K.E., 2003. Optimization of water distribution network design
using the shuffled frog leaping algorithm. J. Water Res. Pl.-ASCE 129 (3), 210e225.
Ewald, G., Kurek, W., Brdys, M.A., 2008. Grid implementation of a parallel multi-objective genetic algorithm for optimized allocation of chlorination stations in drinking water distribution systems: chojnice case study. IEEE T. Syst. Man. Cy. C 38 (4), 497e509.
Farley, M., Trow, S., 2003. Losses in Water Distribution Networks. IWA Publishing. Farmani, R., Wright, J.A., Savic, D.A., Walters, G.A., 2005. Self-adaptive fitness formulation for evolutionary constrained optimization of water systems. J. Comput. Civ. Eng. 19 (2), 212e216.
Farmani, R., Walters, G., Savic, D., 2006. Evolutionary multi-objective optimization of the design and operation of water distribution network: total cost vs. reli-ability vs. water quality. J. Hydroinformatics 8 (3), 165e179.
Furnass, W.R., Mounce, S.R., Boxall, J.B., 2013. Linking distribution system water quality issues to possible causes via hydraulic pathways. Environ. Modell. Softw. 40, 78e87.
Geem, Z.W., 2006. Optimal cost design of water distribution networks using
harmony search. Eng. Optim. 38 (3), 259e277.
Goldberg, D.E., Deb, K., 1991. A comparative analysis of selection schemes used in genetic algorithms. Found. Genet. Algorithms 1, 69e93.
Gupta, R., Bhave, P., 1996. Comparison of methods for predicting deficient-network performance. J. Water Res. Pl.-ASCE 122 (3), 214e217.
Haghighi, A., Samani, H.M., Samani, Z.M., 2011. GA-ILP method for optimization of water distribution networks. Water Resour. Manag. 25 (7), 1791e1808. Jayaram, N., Srinivasan, K., 2008. Performance-based optimal design and
rehabili-tation of water distribution networks using life cycle costing. Water Resour. Res. 44 (1).
Jeong, H.S., Abraham, D.M., 2006. Operational response model for physically attacked water networks using NSGA-II. J. Comput. Civ. Eng. 20 (5), 328e338. Kadu, M., Gupta, R., Bhave, P., 2008. Optimal design of water networks using a
modified genetic algorithm with reduction in search space. J. Water Res. Pl. -ASCE 134 (2), 147e160.
Kalungi, P., Tanyimboh, T.T., 2003. Redundancy model for water distribution sys-tems. Reliab. Eng. Syst. Safe 82 (3), 275e286.
Khu, S.T., Keedwell, E., 2005. Introducing more choices (flexibility) in the upgrading of water distribution networks: the New York City tunnel network example. Eng. Optim. 37 (3), 291e305.
Knowles, J.D., Corne, D.W., 2000. Approximating the non-dominated front using the Pareto archived evolution strategy. Evol. Comput. 8 (2), 149e172.
Kollat, J.B., Reed, P.M., 2006. Comparing state-of-the-art evolutionary multi-objective algorithms for long-term groundwater monitoring design. Adv. Wa-ter Resour. 29 (6), 792e807.
Konak, A., Coit, D.W., Smith, A.E., 2006. Multi-objective optimization using genetic algorithms: a tutorial. Reliab. Eng. Syst. Safe. 91 (9), 992e1007.
Kougias, I., Theodossiou, N., 2013. Multiobjective pump scheduling optimization using harmony search algorithm and polyphonic HSA. Water Resour. Manag. 27 (5), 1249e1261.
Kurek, W., Ostfeld, A., 2013. Multi-objective optimization of water quality, pumps operation, and storage sizing of water distribution systems. J. Environ. Manage 115, 189e197.
Marques, J., Cunha, M., Savic, D., 2015. Multi-objective optimization of water dis-tribution systems based on a real options approach. Environ. Modell. Softw. 63, 1e13.
Matrosov, E., Huskova, I., Kasprzyk, J., Harou, J., Lambert, C., Reed, P., 2015. Many-objective optimization and visual analytics reveal key trade-offs for London's water supply. J. Hydrol. 531 (3), 1040e1053.
McClymont, K., Keedwell, E., Savic, D., 2015. An analysis of the interface between evolutionary algorithm operators and problem features for water resources problems. A case study in water distribution network design. Environ. Modell. Softw. 69, 414e424.
Montalvo, I., Izquierdo, J., Perez, R., Tung, M.M., 2008. Particle swarm optimization applied to the design of water supply systems. Comput. Math. Appl. 56 (3), 769e776.
Nicolini, M., Giacomello, C., Deb, K., 2011. Calibration and optimal leakage man-agement for a real water distribution network. J. Water Res. Pl.-ASCE 137 (1), 134e142.
Ostfeld, A., Tubaltzev, A., 2008. Ant colony optimization for least-cost design and operation of pumping water distribution systems. J. Water Res. Pl.-ASCE 134 (2), 107e118.
Prasad, T.D., 2010. Design of pumped water distribution networks with storage. J. Water Res. Pl.-ASCE 136 (1), 129e132.
Preis, A., Ostfeld, A., 2008. Multiobjective contaminant sensor network design for water distribution systems. J. Water Res. Pl. -ASCE 134 (4), 366e377. Rao, Z., Salomons, E., 2007. Development of a real-time, near-optimal control
pro-cess for water-distribution networks. J. Hydroinformatics 9 (1), 25e37. Ren, C., Guo, P., Li, M., Li, R., 2016. An innovative method for water resources
car-rying capacity research: metabolic theory of regional water resources. J. Environ. Manage 167, 139e146.
Rossman, L.A., 2000. EPANET 2 Users Manual. Water Supply and Water Resources Division. National Risk Management Research Laboratory, US EPA, Cincinnati, OH, USA.
Saleh, S.H., Tanyimboh, T.T., 2013. Coupled topology and pipe size optimization of water distribution systems. Water Resour. Manag. 27 (14), 4795e4814. Saleh, S.H., Tanyimboh, T.T., 2014. Optimal design of water distribution systems
based on entropy and topology. Water Resour. Manag. 28 (11), 3555e3575. Savic, D.A., Walters, G.A., 1997. Genetic algorithms for least-cost design of water
distribution networks. J. Water Res. Pl.-ASCE 123 (2), 67e77.
Seyoum, A.G., 2015. Head-dependent Modelling and Optimisation of Water Distri-bution Systems. PhD thesis. University of Strathclyde, Glasgow.
Seyoum, A.G., Tanyimboh, T.T., 2014a. Pressure dependent network water quality modelling. Proc. ICE Water Manag. 167 (6), 342e355.
Seyoum, A.G., Tanyimboh, T.T., 2014b. Application of pressure-dependent EPANET extension. In: Proc. 11th International Conference on Hydroinformatics. ISBN 978-0-692-28129-1, New York, 17-21 August 2014.
Siew, C., Tanyimboh, T.T., 2012a. Pressure-dependent EPANET extension. Water Resour. Manag. 26 (6), 1477e1498.
Siew, C., Tanyimboh, T.T., 2012b. Penalty-free feasibility boundary convergent multi-objective evolutionary algorithm for the optimization of water distribution systems. Water Resour. Manag. 26 (15), 4485e4507.
Siew, C., Tanyimboh, T.T., Seyoum, A.G., 2016. Penalty-free multi-objective approach to optimization of Anytown water distribution network. Water Resour. Manag. 30 (11), 3671e3688.
Tanyimboh, T., Tabesh, M., Gupta, R., Bhave, P., 1997. Discussion and Closure: comparison of methods for predicting deficient-network performance. J. Water Res. Pl.-ASCE 123 (6), 369e370.
Tanyimboh, T.T., Templeman, A.B., 2010. Seamless pressure deficient water distri-bution system model. Proc. ICE Water Manag. 163 (8), 389e396.
Thornton, J., Sturm, R., Kunkel, G., 2008. Water Loss Control. McGraw-Hill. Vairavamoorthy, K., Ali, M., 2000. Optimal design of water distribution systems
using genetic algorithms. Computer-Aided Civ. Infrastructure Eng. 15 (5), 374e382.
Vairavamoorthy, K., Ali, M., 2005. Pipe index vector: a method to improve genetic-algorithm-based pipe optimization. J. Hydraul. Eng.-ASCE 131 (12), 1117e1125. Wang, Q., Creaco, E., Franchini, M., Savic, D., Kapelan, Z., 2015. Comparing low and high-level hybrid algorithms on the two-objective optimal design of water distribution systems. Water Resour. Manag. 29 (1), 1e16.
Wang, S., Huang, G., Zhou, Y., 2016. A fractional-factorial probabilistic-possibilistic optimization framework for planning water resources management systems with multi-level parametric interactions. J. Environ. Manage 172, 97e106. Weickgenannt, M., Kapelan, Z., Blokker, M., Savic, D.A., 2010. Risk-based sensor
placement for contaminant detection in water distribution systems. J. Water
Res. Pl.-ASCE 136 (6), 629e636.
Wu, Z.Y., Farley, M., Turtle, D., Kapelan, Z., Boxall, J., Mounce, S., Dahasahasra, S., Mulay, M., Kleiner, Y., 2011. Water Loss Reduction. Bentley Institute Press, Exton, Pennsylvania, USA.
Wu, Z.Y., Simpson, A.R., 2002. A self-adaptive boundary search genetic algorithm and its application to water distribution systems. J. Hydraul. Res. 40 (2), 191e203.
Zheng, F., Simpson, A.R., Zecchin, A., 2011. A combined NLP-differential evolution algorithm approach for the optimization of looped water distribution systems. Water Resour. Manag. 47 (8).
Zheng, F., Zecchin, A.C., Simpson, A.R., 2015. Investigating the run-time searching behavior of the differential evolution algorithm applied to water distribution system optimization. Environ. Modell. Softw. 69, 292e307.
Zheng, F., Zecchin, A., 2014. An efficient decomposition and dual-stage multi-objective optimization method for water distribution systems with multiple supply sources. Environ. Modell. Softw. 55, 143e155.
Zitzler, E., Thiele, L., 1998. An Evolutionary Algorithm for Multiobjective Optimi-zation: the Strength Pareto Approach. Technical Report 43. Computer Engi-neering and Networks Laboratory (TIK), Swiss Federal Institute of Technology (ETH), Zurich, Switzerland.