1 2 3 4 5 6 7 8 9 10 11 12 13 14 15 16 17 18 19 20 21 22 23 24 25 26 27 28 29 30 31 32 33 34 35 36 37 38 39 40 41 42 43 44 45 46 47 48 49 50 51 52 53 54 55 56 57 58 59 60 61
Cortical pattern separation and item-specific memory encoding
1Laura M. Pidgeona,b,*, Alexa M. Morcoma 2
3
a Centre for Cognitive Ageing and Cognitive Epidemiology, Department of Psychology, University of 4
Edinburgh, UK 5
b
Present address: School of Psychological Sciences and Health, University of Strathclyde, Glasgow, UK 6
7 8
Keywords: pattern separation; pattern completion; episodic memory; false recognition; mnemonic 9
discrimination; encoding; fMRI 10
11
Highlights: 12
We examined cortical pattern separation and completion during episodic encoding 13
Parametric similarity analyses assessed perceptual and conceptual dimensions 14
Mnemonic discrimination of lures was associated with hippocampal encoding activity 15
PFC and occipital pattern separation regions also predicted accurate recognition 16
This is consistent with a role of cortical pattern separation in successful encoding 17
Abstract 18
Pattern separation and pattern completion are fundamental brain processes thought to be critical 19
for episodic memory encoding and retrieval, and for discrimination between similar memories. These 20
processes are best understood in the hippocampus, but are proposed to occur throughout the brain, in 21
particular in sensory regions. Cortical, as well as hippocampal, pattern separation may therefore 22
support formation of event-unique memory traces. Using fMRI, we investigated cortical pattern 23
separation and pattern completion and their relationship to encoding activity predicting subsequent 24
item-specific compared to gist memory. During scanning, participants viewed images of novel 25
objects, repeated objects, and objects which were both perceptually and conceptually similar to 26
previously presented images, while performing a size judgement task. In a later surprise recognition 27
test, they judged whether test items were ‘same’ ‘similar’ or ‘new’ relative to studied items. Activity 28
consistent with pattern separation – responses to similar items as if novel – was observed in bilateral 29
occipito-temporal cortex. Activity consistent with pattern completion – responses to similar items as if 30
repeated – was observed in left prefrontal cortex and hippocampus. Curve fitting analysis further 31
revealed that graded responses to change in image conceptual and perceptual similarity in bilateral 32
prefrontal and right parietal regions met specific computational predictions for pattern separation for 33
one or both of these similarity dimensions. Functional overlap between encoding activity predicting 34
*Correspondence to: Laura M. Pidgeon, School of Psychological Sciences and Health, Graham Hills Building, 40 George Street, University of Strathclyde, Glasgow, UK, G1 1QE. Tel: +44141 5745292; email: [email protected]
*Manuscript
1 2 3 4 5 6 7 8 9 10 11 12 13 14 15 16 17 18 19 20 21 22 23 24 25 26 27 28 29 30 31 32 33 34 35 36 37 38 39 40 41 42 43 44 45 46 47 48 49 50 51 52 53 54 55 56 57 58 59 60 61
subsequent item-specific recognition and pattern separation activity was also observed in left occipital 35
cortex and bilateral inferior frontal cortex. The findings suggest that extrahippocampal regions 36
including sensory and prefrontal cortex contribute to pattern separation and pattern completion of 37
visual input, consistent with the proposal that cortical pattern separation contributes to formation of 38
item-specific memory traces, facilitating accurate recognition memory. 39
40
1. Introduction 41
Sensory information from a changing environment is continuously processed by the brain, often 42
resulting in substantial overlap between incoming representations and traces already stored in long-43
term memory. In order to avoid interference, incoming episodes must therefore be assigned unique 44
neural representations. In the hippocampus, this is thought to be achieved by pattern separation - the 45
orthogonalisation of incoming relative to existing representations. Conversely, overlapping input is 46
used at retrieval as a cue to drive reinstatement of existing traces via pattern completion, increasing 47
overlap between incoming and existing representations (Marr, 1971; McNaughton and Morris, 1987; 48
O’Reilly and McClelland, 1994). Although pattern separation is by definition an encoding process, 49
and pattern completion a retrieval process, either or both can be elicited by a single event, whether 50
novel or previously encountered (Hunsaker and Kesner, 2013). Efficient pattern separation at 51
encoding is thought to contribute to later mnemonic discrimination between events with similar 52
representations, while false recognition of similar events can result from inefficient pattern separation 53
or dominance of pattern completion at encoding (Sahay et al., 2011; Stark et al., 2013; Wilson et al., 54
2006). However the precise mechanisms by which pattern separation and completion at encoding 55
contribute to memory outcomes remain unknown, and it remains to be established whether and how 56
neocortex complements the central role of the hippocampus in these computations. The present study 57
investigated cortical pattern separation and completion, and asked whether regions showing these 58
responses were also engaged during encoding leading to later item-specific memory. 59
Within the hippocampus, computational, electrophysiological and lesion evidence has 60
implicated the dentate gyrus (DG) in pattern separation, and subfields CA3 and CA1 in pattern 61
separation or completion, depending on the degree of overlap between incoming and existing 62
representations (Gilbert et al., 2001; Guzowski et al., 2004; Leutgeb et al., 2007; Rolls, 2007; 63
Vazdarjanova and Guzowski, 2004). High-resolution functional magnetic resonance imaging (fMRI) 64
evidence from humans is consistent with these findings. Typically, these studies have examined 65
responses to novel images of common objects, repetitions of these images, and images of perceptually 66
and conceptually similar objects. By examining neural responses to similar images within regions 67
showing differential activity between novel and repeated images, it is assumed that equivalent activity 68
between similar and novel items is consistent with pattern separation, i.e., similar images are 69
1 2 3 4 5 6 7 8 9 10 11 12 13 14 15 16 17 18 19 20 21 22 23 24 25 26 27 28 29 30 31 32 33 34 35 36 37 38 39 40 41 42 43 44 45 46 47 48 49 50 51 52 53 54 55 56 57 58 59 60 61
pattern completion, i.e., similar items are processed as if repeated. Examining regions showing 71
repetition suppression (Henson and Rugg, 2003), such investigations have reported activity consistent 72
with pattern separation in a region spanning DG/CA3, and pattern completion activity in CA1 and 73
elsewhere in the medial temporal lobe (MTL) (Bakker et al., 2008; Lacy et al., 2011). Although 74
pattern separation and completion investigations have focussed on the role of the hippocampus, 75
networks throughout the brain are thought to perform similar functions, including sensory cortex 76
(Aimone et al., 2011; Gilbert and Kesner, 2003). Rodent electrophysiological recordings have 77
demonstrated pattern separation of odour cues in the olfactory bulb, and pattern completion in 78
piriform cortex (Barnes et al., 2008; Wilson, 2009), but these functions in regions outside the MTL 79
have received little attention in studies in humans. 80
A number of fMR adaptation (fMRA) studies are also relevant to pattern separation and 81
completion processes. These have assessed the information represented in specific regions by 82
measuring stimulus-specific repetition suppression. Repetition suppression to exact repetitions but not 83
perceptually and conceptually similar images has been reported in visual cortical regions including 84
fusiform and lateral occipital cortex (LOC) (Chouinard et al., 2008; Koutstaal et al., 2001). Such 85
responses resemble pattern separation in that similar items elicit a response which is distinct from that 86
of repetitions. Repetition suppression to similar images which differ perceptually from previously 87
viewed items has also been observed in other occipito-temporal regions and in left inferior frontal 88
gyrus (LIFG) (Chouinard et al., 2008; Fairhall et al., 2011; Horner and Henson, 2011), resembling 89
pattern completion. Such findings together suggest that cortical regions contribute to the degree to 90
which visual inputs are coded as perceptually and semantically similar or distinct. However, evidence 91
for pattern separation or completion from these studies is incomplete. Some studies have reported 92
repetition suppression for repeated relative to both novel and similar items within the same anatomical 93
region without showing that these responses actually overlap (Bakker et al., 2008; Kumaran and 94
Maguire, 2009). Similarly, it has not yet been demonstrated that the regions showing repetition 95
suppression to similar items also show attenuated activity to repetitions, as expected for pattern 96
completion. One fMRA study however demonstrated occipito-temporal responses more clearly 97
consistent with pattern separation. Kim et al. (2009) reported release from repetition suppression in 98
bilateral LOC and fusiform in response to images which differed in shape but not basic-level concept 99
relative to previous images. LOC activity also did not differ between conceptually similar and 100
conceptually novel images equated in shape similarity with previously viewed images. Results were 101
interpreted as sensitivity of LOC to change in shape information, but can also be interpreted from a 102
pattern separation perspective, i.e., reduced activity for repetitions relative to both novel and similar 103
images, but activity for novel and similar items did not differ, providing the most direct evidence to 104
date of responses consistent with pattern separation in visual cortex. 105
Although the fMRA findings are suggestive of cortical pattern separation and completion, these 106
1 2 3 4 5 6 7 8 9 10 11 12 13 14 15 16 17 18 19 20 21 22 23 24 25 26 27 28 29 30 31 32 33 34 35 36 37 38 39 40 41 42 43 44 45 46 47 48 49 50 51 52 53 54 55 56 57 58 59 60 61
similarity (e.g., Treves and Rolls, 1992; Vazdarjanova and Guzowski, 2004). Therefore, examination 108
of neural responses to graded change in input, i.e., to stimuli of varying similarity relative to 109
previously presented items, can provide further support for their presence (Hunsaker and Kesner, 110
2013; Kumaran and Maguire, 2009). Pattern separation is defined as reduction in overlap of output 111
representations from a region relative to the degree of overlap of input representations received by the 112
region (Rolls, 1996; Treves and Rolls, 1992). The resulting changes in output in response to 113
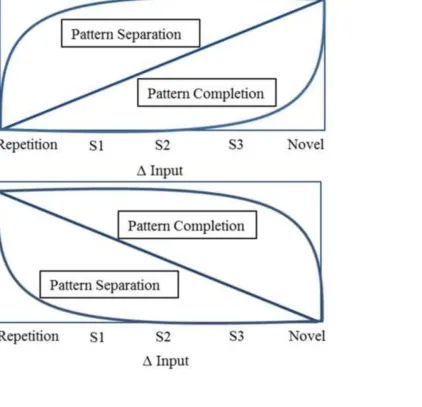
increasing input similarity can therefore be approximated by a power function with decreasing slope, 114
i.e., a large difference in activity occurs between repeated and the most similar items (Fig. 1A; Motley 115
and Kirwan, 2012). In contrast, pattern completion increases the representational overlap at output 116
relative to input representations (O’Reilly and McClelland, 1994), approximated by a power function 117
with increasing slope, i.e., very slight differences in activity occur between repeated and similar items, 118
with only highly dissimilar items processed as if novel (Fig. 1; Vazdarjanova and Guzowski, 2004). In 119
regions showing repetition enhancement, the functions are the same but their direction is inverted 120
(Fig. 1B). A linear function represents the case where overlap is equal between input and output 121
representations, i.e., neither pattern separation nor completion occurs (Guzowski et al., 2004; Yassa 122
and Stark, 2011). ‘Input’ and ‘output’ here refer to neural representations, and in line with other 123
authors we approximate their similarity by that between items (Motley and Kirwan, 2012; Yassa et 124
al., 2011). fMRI responses consistent with these predictions have been demonstrated in hippocampus 125
in response to items of varied ‘mnemonic similarity’ (defining input similarity indirectly as the 126
probability of successful mnemonic discrimination in a separate sample; Lacy et al., 2011), or varied 127
viewing angle relative to previous images (Motley and Kirwan, 2012). 128
There has been little exploration in humans of the proposal that pattern separation at encoding 129
contributes to later mnemonic discrimination (Kirwan and Stark, 2007; Wilson et al., 2006). In 130
memory tasks incorporating similar lures at test as well as novel and studied items, successful 131
mnemonic discrimination entails correct rejection of lures (as ‘similar’ or ‘new’) as well as the ability 132
to recognise studied items, and lure false recognition reflects failed mnemonic discrimination. 133
Consistent with a role of pattern separation in mnemonic discrimination, in rats, lesions to DG, 134
strongly linked to pattern separation (e.g., Leutgeb et al., 2007), result in mnemonic discrimination 135
deficits (Goodrich-Hunsaker et al., 2008); and in humans, associations have been demonstrated 136
between both hyperactivation in CA3/DG and reduced perforant path integrity and poorer lure 137
discrimination performance (Kirwan et al., 2012; Yassa et al., 2010). Kirwan and Stark (2007) 138
reported that hippocampal (CA1, DG/CA3) but not other MTL regions showed encoding-related 139
activity which differentiated between later mnemonic discrimination outcomes (lure correct rejection, 140
lure false recognition, hits). They did not however examine the relation between this encoding activity 141
and pattern separation. Efficient pattern separation at encoding is thought also to facilitate recognition 142
of studied items as ‘old’ (Norman and O’Reilly, 2003; Yassa and Stark, 2011). Conversely, inefficient 143
1 2 3 4 5 6 7 8 9 10 11 12 13 14 15 16 17 18 19 20 21 22 23 24 25 26 27 28 29 30 31 32 33 34 35 36 37 38 39 40 41 42 43 44 45 46 47 48 49 50 51 52 53 54 55 56 57 58 59 60 61
< Figure 1 about here > 145
146
representations via pattern completion is assumed to contribute to later false recognition of similar 147
lures (Norman, 2010; Schacter et al., 1998; Yassa and Reagh, 2013). 148
Other theoretical accounts suggest that true and false recognition differ in terms of encoding 149
and retrieval of item-specific information. According to Fuzzy Trace Theory, gist traces are coarse, 150
acontextual representations of semantic information which are distinct from but encoded in parallel 151
with item-specific representations of precise surface form (Brainerd and Reyna, 1990; 2002). It is 152
suggested that false recognition of items overlapping in gist with studied items can result from 153
emphasis on gist processing at encoding, leading to increased strength of gist relative to item-specific 154
traces, and consequent reliance on gist at retrieval (Brainerd and Reyna, 2002). On this account, true 155
recognition of studied items can be supported by gist information alone, but is often associated with 156
intact item-specific memory in healthy, young adults (Gutchess and Schacter, 2012). In a recognition 157
test with an explicit requirement to respond ‘similar’ to lures, memory for gist in the absence of item-158
specific memory may result in partial recognition, i.e., incorrectly judging studied items as ‘similar’ 159
(Garoff et al., 2005). Successful mnemonic discrimination of a similar lure from its previously studied 160
item is however thought to require intact item-specific memory as well as post-retrieval processing 161
(Brainerd et al., 2003). Several fMRI studies have shown differences in encoding activity according to 162
whether later memory is item-specific or gist-based. Activity in LIFG (Garoff et al., 2005; Kim and 163
Cabeza, 2007; Kubota et al., 2006) and left superior temporal gyrus (Baym and Gonsalves, 2010) has 164
been found to predict subsequent false recognition of images and visually presented words which are 165
semantically similar to studied items, relative to subsequent forgetting. The assumption that this 166
reflects semantic gist processing is consistent with behavioural studies showing that emphasis on 167
semantic processing at encoding contributes to greater likelihood of false memory (Koutstaal and 168
Schacter, 1997; Roediger and McDermott, 1995). However, contrasts of subsequent false recognition 169
with forgetting provide limited information about what is unique to encoding supporting mnemonic 170
discrimination. The same studies have found that encoding predicting true recognition engages visual 171
cortex, e.g. bilateral fusiform gyri, inferior temporal cortex and LOC (Baym and Gonsalves, 2010; 172
Garoff et al., 2005; Kim and Cabeza, 2007), suggesting additional perceptual processing may aid in 173
formation of item-specific memory. These regions associated with encoding predicting true and false 174
recognition are similar to those which in the fMRA studies discussed above were associated with 175
sensitivity and invariance to perceptual change, respectively (Fairhall et al., 2011; Kim et al., 2009; 176
Koutstaal et al., 2001). A small number of studies (Cheng and Rugg, 2010; Geng et al., 2007; Urbach 177
et al., 2005) have also reported differences in electroencephalographic event-related potentials during 178
encoding of words according to whether semantically similar lures are later mnemonically 179
discriminated or falsely recognised, consistent with suggestions that different encoding processes 180
1 2 3 4 5 6 7 8 9 10 11 12 13 14 15 16 17 18 19 20 21 22 23 24 25 26 27 28 29 30 31 32 33 34 35 36 37 38 39 40 41 42 43 44 45 46 47 48 49 50 51 52 53 54 55 56 57 58 59 60 61
The present study had three main aims. First, we sought evidence for cortical activity consistent 182
with pattern separation and/or completion during incidental encoding of images of novel objects, 183
repetitions, and perceptually and conceptually similar objects (Bakker et al., 2008). We also assessed 184
whether neural responses to images of graded perceptual and conceptual similarity relative to 185
previously viewed images, defined by independent subjective ratings, met computational definitions 186
for pattern separation and completion within repetition sensitive regions. Second, we examined the 187
neural bases of encoding predicting recognition outcomes proposed to rely on item-specific memory 188
(mnemonic discrimination of lures), gist-based memory (partial recognition of studied items, false 189
recognition of lures) or both (true recognition). The recognition test employed studied, novel and lure 190
images and participants made ‘same’, ‘similar’ or ‘new’ judgements (Garoff et al., 2005; Koutstaal et 191
al., 1999). This task is thought to place greater demands on pattern separation than dichotomous 192
old/new recognition (Stark et al., 2013), and supports direct comparisons between successful and 193
unsuccessful lure mnemonic discrimination (Yassa et al., 2011). Finally, we assessed whether the 194
same regions engaged in pattern separation or completion were also associated with item-specific or 195
gist encoding. 196
Based on previous fMRA studies, it was predicted that bilateral inferior frontal cortex 197
(Koutstaal et al., 2001) and occipito-temporal regions including bilateral LOC and fusiform would 198
demonstrate pattern separation (Fairhall et al., 2011; Koutstaal et al., 2001), and would also be 199
engaged in item-specific encoding (Kim and Cabeza, 2007). Encoding predicting gist memory was 200
expected to engage left-lateralised regions associated with semantic processing, including fusiform, 201
inferior parietal lobe and LIFG (Badre and Wagner, 2007; Binder et al., 2009). 202
203
2. Methods 204
2.1. Participants 205
Twenty-six right-handed adults aged 18-26 years underwent fMRI scanning. Data from one 206
participant were lost due to data acquisition issues; a further five participants were excluded due to 207
chance performance on the recognition test. Results for pattern separation and pattern completion 208
analyses reflect data from the remaining 20 participants (M= 21.9 years; 10 female). For subsequent 209
memory analyses, seven further participants were excluded due to insufficient false recognition trials 210
(Section 2.7.1.). Subsequent memory analyses were therefore conducted on data from 13 participants 211
(M = 21.8 years; 6 female). Informed consent was obtained, and the protocol received ethical 212
approval. Subjective ratings of within-pair stimulus similarity were collected from a separate sample 213
(Section 2.4.). 214
215
1 2 3 4 5 6 7 8 9 10 11 12 13 14 15 16 17 18 19 20 21 22 23 24 25 26 27 28 29 30 31 32 33 34 35 36 37 38 39 40 41 42 43 44 45 46 47 48 49 50 51 52 53 54 55 56 57 58 59 60 61
Stimuli were pairs of images (photographs or drawings, 300 x 270 pixels) of common objects 217
or animals (Koutstaal, 2006). Pairs comprised perceptually similar exemplars of the same basic-level 218
conceptual category, e.g., cats, telephones. Study phase lists contained 280 images: 200 novel, 40 219
repetitions of previously presented images, and 40 images which were perceptually and conceptually 220
similar to previously presented images. Test lists comprised 240 images: 80 studied (‘same’) items, 80 221
lures of studied items (‘similar’) and 80 novel (‘new’) items. Lures presented at test had not been 222
presented at study. Of the studied items presented at test, 20 had been presented twice at study (as 223
novel then as a repetition), and for 20 of the 80 lures presented at test, corresponding items had been 224
presented twice at study. Allocation of images to conditions was counterbalanced across participants. 225
For study and test phases, a unique pseudo-random order of presentation was generated for each 226
participant, with the constraint that no more than six items from one condition were presented in 227
sequence.At the start of the scanned study phase, four ‘filler’ images were presented, and excluded 228
from analyses. 229
230
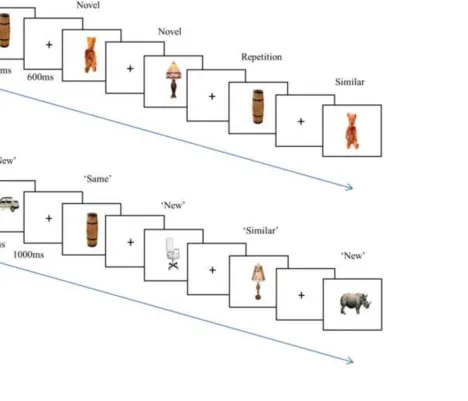
2.3. Task and procedure 231
Stimuli were presented in Cogent2000 v1.29 (www.fil.ion.ucl.ac.uk) in MATLAB v.7.12 (The 232
MathWorks Inc., 2011). The task comprised a scanned study phase and a subsequent recognition test, 233
illustrated in Fig. 2. Stimuli were displayed through MRI-compatible Nordic Neurolab goggles 234
(www.nordicneurolab.com) at an effective viewing distance of 1 m, and vision was corrected to
235
normal if required. Images subtended approximately 10 degrees of visual angle. Earplugs were 236
employed to reduce scanner noise, and head motion was minimised using foam pads. During the study 237
phase, participants judged whether each depicted item would fit in a shoebox, responding ‘yes’ or ‘no’ 238
via button presses on hand-held fibre-optic response pads. Images were presented centrally against a 239
white background for 2200 ms,followed by a black fixation cross for 300 ms, then a red fixation cross 240
for 300 ms (stimulus onset asynchrony (SOA) = 2800 ms). Novel images were separated from 241
corresponding repetitions or similar images by 30 - 60 trials.Participants also viewed 40 fixation-only 242
‘null’ trials, in which the black fixation cross remained onscreen for the duration of one SOA. 243
Twenty-four hours after the study phase, participants completed a recognition test. Participants 244
judged whether images presented were ‘same’, ‘similar’, or ‘new’ relative to studied items, or gave a 245
‘guess’ response. Responses were made via key presses. Images were presented for 3000 ms with a 246
1000 ms inter-trial interval (black fixation cross 700 ms, red fixation cross 300 ms; SOA = 4000 ms). 247
Assignment of keys to responses was counterbalanced across participants. Practice sessions were 248
conducted prior to study and test phases. 249
250
< Figure 2 about here> 251
1 2 3 4 5 6 7 8 9 10 11 12 13 14 15 16 17 18 19 20 21 22 23 24 25 26 27 28 29 30 31 32 33 34 35 36 37 38 39 40 41 42 43 44 45 46 47 48 49 50 51 52 53 54 55 56 57 58 59 60 61
2.4. Similarity ratings 253
Subjective similarity ratings were collected from a separate sample (N = 23; 18 – 25 years). The 254
pairs of images employed in the main experiment were presented in sequence, with a unique 255
pseudorandom order of presentation generated for each participant. Twelve participants rated the 256
perceptual similarity of items within each pair from 1 (highly similar) to 5 (highly distinctive), and 11 257
rated intra-pair conceptual similarity on the same scale. Participants were asked to base perceptual 258
similarity judgements on visual features such as shape or colour, and to base conceptual similarity 259
judgements on how well the images corresponded to the same kind of object, i.e., two mountain bikes 260
would be judged as conceptually similar, whereas a collie and bulldog, although both belonging to the 261
basic-level category ‘dog’ should be rated less conceptually similar (Konkle et al., 2010). Image pairs 262
were presented until 800 ms after a response was made, up to a maximum presentation time of 6000 263
ms. Between trials, a black fixation cross was presented for 1000 ms. 264
265
2.5. fMRI data acquisition 266
Images were acquired with a 1.5T Signa Horizon HDX MRI scanner operating under a research 267
collaboration with GE Medical Systems (Milwaukee, USA). T2*-weighted functional images were 268
acquired in a single session using a BOLD-EPI sequence (TR = 2200 ms, TE = 40 ms). Functional 269
data consisted of 435 volumes, each comprising 30 slices (interleaved acquisition; 64 x 64 matrix; 4 270
mm x 4 mm x 4 mm). The first 4 volumes were discarded to account for T1 equilibration. Following 271
functional scanning, T1-weighted structural images were obtained (fov = 24 cm; flip angle 8°, 256 x 272
256 matrix, 1mm x 1mm x 1.3 mm voxels). 273
274
2.6. Image preprocessing 275
MRI preprocessing and analysis were conducted in SPM8 (Wellcome Department of Cognitive 276
Neurology, London, UK) in MATLAB v.7.5 (The MathWorks Inc., 2007). Scans with slices showing 277
average signal of greater than 7 standard deviations (SD) from the session mean were visually 278
checked, and where artefacts were present scans were replaced with the average of the two adjacent 279
scans (Foo et al., 1994) then modelled as confounds in the first level design matrix (see Section 280
2.7.1.). Functional images were corrected for temporal differences in slice acquisition using sinc 281
interpolation in time, and spatially realigned to the mean EPI image using B-spline interpolation. For 282
whole-brain analyses, spatial normalisation used the 'new segment' protocol in SPM8 (Ashburner and 283
Friston, 2005): participants’ structural scans were coregistered to their mean EPI image, then 284
segmented into 6 tissue classes. Resulting parameters were applied to reslice the EPI images to 3 x 3 x 285
3 mm voxels in Montreal Neurological Institute (MNI) space. Finally, for the principal analyses the 286
1 2 3 4 5 6 7 8 9 10 11 12 13 14 15 16 17 18 19 20 21 22 23 24 25 26 27 28 29 30 31 32 33 34 35 36 37 38 39 40 41 42 43 44 45 46 47 48 49 50 51 52 53 54 55 56 57 58 59 60 61
288
2.7. fMRI data analysis 289
2.7.1. First and second level models and statistical thresholding 290
At the first level, vectors of onset times for each event type of interest for each participant were 291
convolved with the canonical haemodynamic response function (HRF) and temporal derivative basis 292
functions in a general linear model (GLM). Hypothesis testing involved construction of 5 separate 293
first level models. Model i) implemented the overall pattern separation/completion analysis, and ii)-294
iv) the input similarity analyses. For the similarity analyses, model ii) identified repetition sensitive 295
regions, then iii) modelled perceptual similarity and iv) conceptual similarity. Finally, v) modelled 296
subsequent memory effects. 297
For the overall pattern separation and completion model (i), event types of interest were novel, 298
repeated and similar items. Unlike previous fMRI studies, we defined pattern separation and 299
completion within regions showing repetition enhancement as well as suppression. A difference in 300
activity between novel and repeated items is necessary to reveal the relative responses to similar 301
items, but both directions of repetition effect are consistent with computational definitions for pattern 302
separation and completion. In ii), to define repetition sensitive regions the event types of interest were 303
the novel and repeated items presented at study. For each participant, half of the novel items for which 304
repeated or similar items were later presented, and half of the repeated items (40 and 20, respectively) 305
were randomly selected to identify the repetition sensitive regions, and the remaining half were used 306
for the similarity analyses iii) and iv). In ii), the 120 novel non-repeated items were also included to 307
maximise sensitivity. For similarity analyses, stimulus pairs were divided into tertiles based on their 308
average intra-pair perceptual (ii) and conceptual (iii) similarity ratings. Event types of interest were: 309
novel items for which similar or repeated items were later presented; repetitions; similar items of high 310
(S1); medium (S2); and low (S3) similarity; and null events. The novel and repeated items consisted 311
of the half of the novel and repeated items (40 and 20) not included in the mode used to select 312
repetition sensitive regions (ii). For model iii), for each class of similar item (S1, S2, S3), a 313
continuous measure of perceptual similarity was included as a parametric modulator, convolved with 314
the canonical HRF. Similarly, for model iv), continuous measures of conceptual similarity were 315
included as parametric modulators for each of the similar conditions (S1, S2, S3). For models iii) and 316
iv), novel items which were not subsequently repeated (either as similar items or repetitions) served as 317
a non-fixation implicit baseline, following Motley and Kirwan (2012). For the subsequent memory 318
model (v), encoding trials were sorted according to the response condition of corresponding 319
studied/lure items at test. Event types of interest were hits to studied items (‘same’|studied), partial 320
recognition of studied items (‘similar’|studied); lure false recognition (‘same’|lure); lure correct 321
1 2 3 4 5 6 7 8 9 10 11 12 13 14 15 16 17 18 19 20 21 22 23 24 25 26 27 28 29 30 31 32 33 34 35 36 37 38 39 40 41 42 43 44 45 46 47 48 49 50 51 52 53 54 55 56 57 58 59 60 61
lures (‘new’|studied; ‘new’|lure) were collapsed into a single category. Participants with fewer than 10 323
trials in any condition of interest were excluded from analyses. 324
For all models, the first two images presented during scanning and, for the subsequent memory 325
model, trials receiving no response, were modelled as events of no interest. Regressors comprising a 326
‘1’ in a column of zeroes representing removed scans were also included in the GLM as confounds, 327
along with 12 motion parameters comprising the six rigid-body transformation outputs of the 328
realignment stage, and the differences between these six parameters and the corresponding parameters 329
of the previous scan (Friston et al., 1996). The time series was high-pass filtered using a cut-off of 128 330
s, and parameter estimates were computed using the weighted least squares model fitted to the data 331
after prewhitening using an AR(1) plus white noise model (Friston et al., 2002). 332
For models i), ii) and v), fMRI data were analysed using a two stage summary statistic mixed-333
effects procedure (Penny and Holmes, 2006) (for iii and iv, group analyses were conducted on beta 334
values extracted from first level models, Section 3.2.2.1.). T-contrasts for each event type (e.g., for 335
pattern separation: novel, repetition, similar) against the implicit baseline were computed at the 336
individual subject level and entered into one-way within-subjects analyses of variance (ANOVAs) at 337
the group level, which modelled average subject effects and treated participants as random effects. 338
GLMs were estimated using weighted least squares to account for non-sphericity (Friston et al., 339
2002). Main contrasts of interest employed one-tailed t-tests, producing statistical parametric maps of 340
t-statistics at each voxel. Images for exclusive masking were computed using bidirectional F-tests. 341
Correction for multiple comparisons employed AlphaSim's Monte Carlo permutation-based cluster 342
threshold (Analysis for Functional NeuroImaging, afni.nimh.nih.gov; Cox, 1996). For a family-wise 343
error (FWE) rate of p < .05, given a cluster-defining voxel threshold of p < .01, the cluster threshold 344
was 67 contiguous voxels for whole-brain contrasts. Exclusive masks were applied at an uncorrected 345
threshold of p < .05, to discount voxels from the resulting masked contrasts which showed any hint of 346
the relevant masked effect. Results reported are for the canonical HRF. 347
348
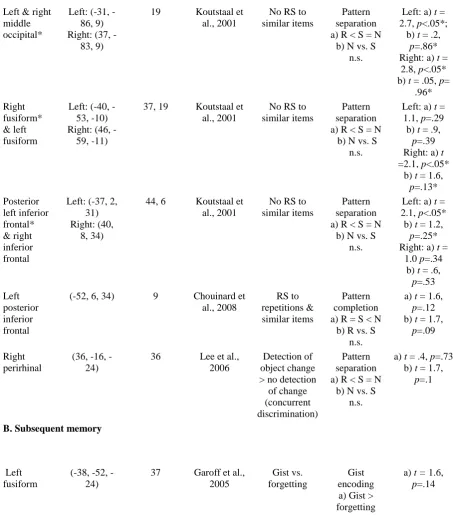
2.7.2. Cortical region of interest (ROI) analyses 349
Pattern separation and subsequent memory effects were also examined in several a priori ROIs, 350
listed in Table 1 along with a summary of the results of the analyses (see Section 3.2.). For each ROI, 351
average beta values from first level models were extracted for event types of interest within spheres of 352
5 mm radius (3 mm in MTL) centred on peak coordinates from previous relevant studies. Differences 353
in extracted beta values between events of interest were analysed using t-tests and ANOVA. 354
355 356 357
< TABLE 1 about here > 358
1 2 3 4 5 6 7 8 9 10 11 12 13 14 15 16 17 18 19 20 21 22 23 24 25 26 27 28 29 30 31 32 33 34 35 36 37 38 39 40 41 42 43 44 45 46 47 48 49 50 51 52 53 54 55 56 57 58 59 60 61
2.7.3. Hippocampal voxel-wise ROI analysis 360
In line with previous fMRI studies of pattern separation and pattern completion, targeted 361
analyses were also conducted within the hippocampus using unsmoothed EPI data. To ensure optimal 362
localisation and signal detection, the ROI-AL method of cross-participant alignment was used (Stark 363
and Okado, 2003). Given the limited spatial resolution, both hippocampi together were treated as a 364
single ROI. T1 structural scans were first normalised to MNI space in SPM8 using affine transforms, 365
before hippocampal manual segmentation in ITK-SNAP (Boccardi et al., 2011; Yushkevich et al., 366
2006). Resulting segmentations were aligned using the Diffeomorphic Demons algorithm 367
(Vercauteren et al., 2007) in MedINRIA (v1.8.0, ASCLEPIOS Research Team, France) to a 368
hippocampal mask derived from manual segmentation of the T1 canonical brain. Segmentations were 369
then realigned to a template derived from the mean of the post-aligned ROIsfrom the previous step. 370
The displacement fields generated were applied to participants’ preprocessed EPI time series, and first 371
and second level models re-estimated (Section 2.7.1.). Voxel-wise analyses were conducted within the 372
group hippocampal mask. For a FWE of p < .05 given a cluster-defining voxel threshold of p < .01, a 373
cluster threshold of 3 voxels was determined using AlphaSim. 374
375
2.7.4. Functional overlap 376
We tested for joint significance of the conjunction of each pattern separation or completion 377
contrast with each item-specific or gist encoding contrast which revealed significant findings. A 378
conjoint voxel threshold was applied following inclusive masking of each encoding contrast with the 379
relevant pattern separation/completion contrast. With the individual contrasts thresholded at the 380
original significance level of p < 0.01, the conjoint uncorrected voxel significance level was p < .001 381
according to Fisher’s formula (Fisher, 1950; Lazar et al., 2002). Using AlphaSim, the cluster 382
threshold for FWE correction at p < .05 given this conjoint voxel significance level was 20 contiguous 383
voxels. 384
385
3. Results 386
3.1. Behavioural results 387
3.1.1. Study phase 388
One-way ANOVA examining mean reaction time (RT) at study showed that responses on the 389
size judgement task were faster to repetitions (830 ms) and similar items (863 ms) compared to novel 390
items (953 ms; F(2,38) = 38.4; t(19) = 8.06; t(19) = 6.52; all p < .001). No differences were observed 391
in RT at study according to memory response at test (F < 1). As the size judgement task contained a 392
1 2 3 4 5 6 7 8 9 10 11 12 13 14 15 16 17 18 19 20 21 22 23 24 25 26 27 28 29 30 31 32 33 34 35 36 37 38 39 40 41 42 43 44 45 46 47 48 49 50 51 52 53 54 55 56 57 58 59 60 61
394
3.1.2. Test phase 395
Analyses of test phase memory accuracy and RTs were conducted on data from the 13 396
participants included in subsequent memory analyses. RT at test differed according to the Condition 397
of items (studied, repetition, lure; F(2,24) = 14.31, p < .001) and the Response given (‘same’, 398
‘similar’, ‘new’; F(2,24) = 7.24, p = .003). A Condition x Response interaction (F(4,48) = 7.15, p < 399
.001) was followed up via t-tests contrasting correct with incorrect responses separately for each 400
Condition. For studied items, correct ‘same’ responses were faster than incorrect responses (‘similar’: 401
t(12) = 4.72, p = .001; ‘new’: t(12) = 2.18, p = .05). Novel items were correctly identified as ‘new’ 402
faster than they were incorrectly judged ‘same’ or ‘similar’ (t(12) = 2.35, p = .037; t(12) = 3.21, p = 403
.007). Participants were slower to correctly reject lures than to falsely recognise lures as ‘same’ (t(12) 404
= 2.25, p = .04), and no difference in RT was observed between correct ‘similar’ and incorrect ‘new’ 405
responses to lures (t(12) = 1.96, p = .07). 406
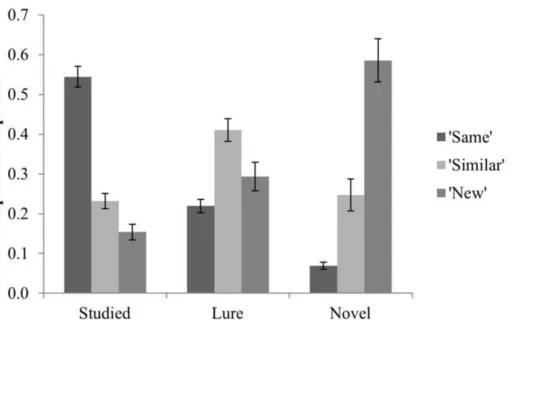
Proportions of responses associated with each Condition (studied, lure, novel) at test were 407
computed for the 13 participants included in subsequent memory analyses (see Fig. 3). Three one-way 408
ANOVAs examined effects of Condition (studied, lure, novel) separately for each Response (‘same’, 409
‘similar’, ‘new’). Effects of Condition were present for each Response (‘same’: F(2,24) = 234.83, p < 410
.001; ‘similar’: F(2,24) = 27.22, p < .001; ‘new’: F(1.2,14.7) = 71.0, p < .001). Post hoc tests for each 411
Response type (adjusted α = .017) revealed that correct ‘same’ responses to studied items were more 412
frequent than false recognition of lures or novel items (t(12) = 15.17; t(12) = 16.82; ps < .001), and 413
lures were falsely recognised more often than novel items (t(12) = 9.48, p < .001). ‘Similar’ responses 414
were assigned to lures more often than studied or novel items (t(12) = 8.13; t(12) = 5.25; ps < .001), 415
but there was no difference in the proportions of studied and novel items judged ‘similar’ (t(12) = .58, 416
p = .58). Novel items were judged ‘new’ more often than studied items or lures (t(12) = 8.85; t(12) = 417
8.02; ps < .001), and studied items received fewer ‘new’ responses than lures (t(12) = 7.02, p < .001). 418
419
< Figure 3 about here > 420
421
3.1.3. Similarity ratings 422
The average perceptual similarity rating of image pairs was 2.89 (SD = .68, range 1.33 - 4.58) 423
and the average intra-pair conceptual rating was 3.01 (SD = .63, range 1.64 - 4.45). Conceptual and 424
perceptual ratings were positively correlated across items (r = .64, n = 280, p < .001). 425
426
3.2. fMRI results 427
1 2 3 4 5 6 7 8 9 10 11 12 13 14 15 16 17 18 19 20 21 22 23 24 25 26 27 28 29 30 31 32 33 34 35 36 37 38 39 40 41 42 43 44 45 46 47 48 49 50 51 52 53 54 55 56 57 58 59 60 61
3.2.1.1. Analysis strategy 429
To assess pattern separation, we searched for regions in which average activity elicited by 430
novel and similar items was greater than activity for repetitions (repetition < similar = novel), using a 431
one-tailed t-contrast at the group-level. To discount regions showing any hint of differential activity 432
between novel and similar items, the resulting SPM was exclusively masked with the bidirectional F -433
contrast of novel vs. similar (Section 2.7.1.). To detect pattern separation activity in regions showing 434
greater activity for repetitions than novel items, a ‘reverse’ pattern separation contrast was computed 435
(repetition > similar = novel), again exclusively masked with the F-contrast of novel vs. similar. For 436
pattern completion, t-contrasts located regions in which activity elicited by novel items was greater 437
than that for both similar items and repetitions (repetition = similar < novel), exclusively masked with 438
the F-contrast of similar vs. repeated items. A 'reverse' pattern completion contrast also examined 439
regions showing increased activity to similar and repeated relative to novel items (repetition = similar 440
> novel). 441
442
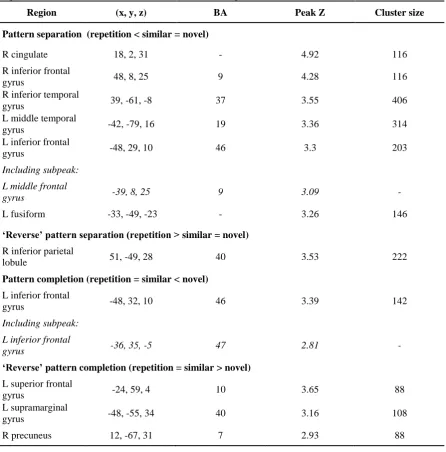
3.2.1.2. Findings 443
Regions showing suprathreshold pattern separation and completion-consistent activity in the 444
whole brain analysis are summarised in Table 2 and selected regions are illustrated in Fig. 4 (pattern 445
separation) and Fig. 5 (pattern completion). Pattern separation (repetition < similar = novel) activity 446
was observed in bilateral PFC and occipito-temporal regions including a lateral prefrontal region 447
encompassing LIFG (BA 46) and left middle frontal gyrus (LMFG; BA 9), and right inferior frontal 448
gyrus (RIFG; BA 9), right inferior temporal cortex and left middle temporal gyrus. Reverse pattern 449
separation activity (repetition > similar = novel) was observed in right inferior parietal cortex. Pattern 450
completion activity (repetition = similar < novel) was revealed in a region of LIFG (BA 46/47) which 451
overlapped but was slightly more anterior to that revealed in pattern separation contrasts. The 452
‘reverse’ pattern completion contrast (repetition = similar > novel) revealed activity in left superior 453
frontal and left supramarginal gyri, and right precuneus. 454
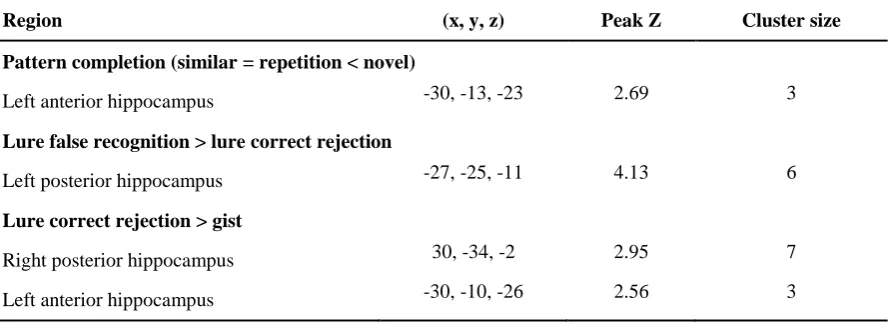
The a priori ROI analyses (Table 1) revealed activity consistent with pattern separation in right 455
fusiform, bilateral middle occipital cortex, and posterior LIFG (BA 44). Voxel-wise ROI analysis in 456
hippocampus showed pattern completion activity in a left anterior region (Table 3). 457
458
< TABLE 2 about here> 459
460
< FIGURE 4 about here > 461
462
1 2 3 4 5 6 7 8 9 10 11 12 13 14 15 16 17 18 19 20 21 22 23 24 25 26 27 28 29 30 31 32 33 34 35 36 37 38 39 40 41 42 43 44 45 46 47 48 49 50 51 52 53 54 55 56 57 58 59 60 61
464
<TABLE 3 about here > 465
466
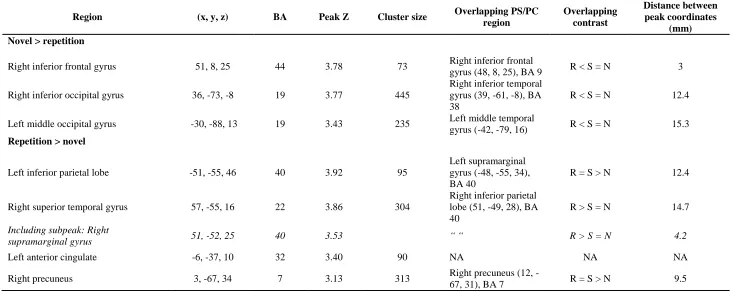
3.2.2. Input similarity 467
3.2.2.1. Analysis strategy 468
To ensure independence of input similarity analyses from the ROI selection procedure, 469
repetition sensitive regions were first identified by conducting unidirectional t-contrasts of novel > 470
repeated, and repeated > novel using half of the items in each of these conditions (Section 2.7.1. for 471
model and thresholding; Table 4 for results). Voxel-wise ROI analysis in the hippocampus did not 472
reveal any repetition sensitive regions which survived thresholding, so model fit was examined in 473
cortical repetition sensitive regions (Table 4) and a priori ROIs (Table 1) only. Input similarity 474
analyses were conducted using the remaining half of the novel and repeated items within ROIs 475
centred on the peak voxels of all regions which showed significant differences between novel and 476
repeated items, and for the a priori ROIs for which pattern separation was supported in whole-brain 477
analyses (Section 3.2.1.2.). Next, beta values extracted from first level models for each ROI were 478
averaged across participants for each trial type – repetitions, high (S1), medium (S2), and low (S3) 479
similarity items, and first presentations of novel items. Using the Curve Fitting Toolbox (v3.4) in 480
MATLAB (v8.2), linear (f(x) = ax + b) and power functions (f(x) = axb+ c) were fitted to the data for 481
each ROI, with each data point weighted by the inverse of the square of the standard error (Machluf, 482
2008). Power functions with decreasing slope are defined as functions where b (the exponent) < 0, 483
and increasing slope power functions where b > 1 (Motley & Kirwan, 2012). The least squares 484
analogue of Akaike’s Information Criterion, including correction for small sample size (AICc) was 485
calculated using: AICc = nlog(SSE/n) + 2K + (2K(K+1))/(n-K-1), where n is the sample size, SSE is 486
the sum of squared error, and K is the number of model parameters, including the error term 487
(Burnham and Anderson, 1998). For each similarity measure, comparative fit of each linear and 488
power model was assessed via AICc, adopting the criterion that a difference in AICc of greater than 4 489
corresponds to significant evidence of a difference in model fit (Burnham and Anderson, 1998), with 490
better fit for the model with the lower AICc value. To avoid formal comparison of very poor fitting 491
models, model fit was compared using AICc only where adjusted R 2
> 0 (indicating the model 492
provides better fit than a horizontal line) for one or both models. 493
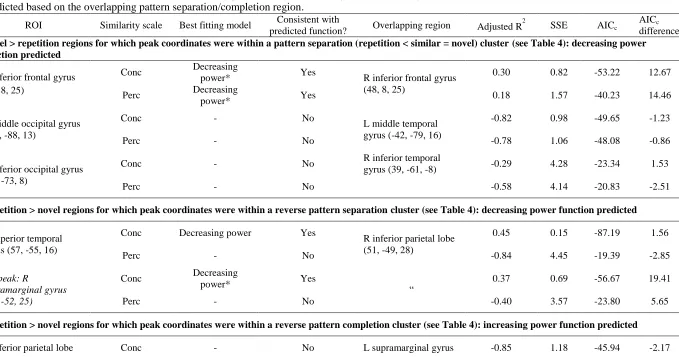
For five out of six repetition sensitive regions, the peak voxel coordinates fell within a pattern 494
separation or completion cluster revealed in the whole-brain contrasts (Section 3.2.1.2.). Findings of 495
the curve fitting analysis were therefore interpreted in light of this overlap, to determine whether fitted 496
curves were consistent with the overall analysis. The predicted function for pattern separation in 497
1 2 3 4 5 6 7 8 9 10 11 12 13 14 15 16 17 18 19 20 21 22 23 24 25 26 27 28 29 30 31 32 33 34 35 36 37 38 39 40 41 42 43 44 45 46 47 48 49 50 51 52 53 54 55 56 57 58 59 60 61
decreasing slope (above the diagonal in Fig. 1A) for responses to repetitions, items of high, medium 499
and low similarity, and novel items, The predicted function for pattern completion was a power 500
function with increasing slope. Using a stricter operationalisation of pattern completion than Motley 501
and Kirwan (2012), who also interpreted linear functions as evidence of pattern completion, we 502
classified a linear function as consistent with neither pattern separation nor completion (see 503
Introduction). In regions showing repetition enhancement, the direction of response functions 504
consistent with pattern separation and completion was reversed: pattern separation is expected to 505
approximate the decreasing slope power function below the diagonal in Fig. 1B, and pattern 506
completion the increasing slope power function above the diagonal. 507
508
<TABLE 4 about here> 509
3.2.2.2. Findings 510
Repetition sensitive regions are summarised in Table 4. Model fit is summarised in Table 5, 511
and full model parameters are listed in Supplementary Table S1. Best fitting curves for ROIs showing 512
model fit consistent with pattern separation are depicted in Fig. 6. The RIFG cluster overlapped with 513
an RIFG cluster revealed in the whole-brain pattern separation contrast (repetition < similar = novel) 514
and showed decreasing slope power functions for both conceptual and perceptual similarity, 515
consistent with pattern separation. AICc differences between the power and linear models were 13.33 516
and 14.46 for conceptual and perceptual similarity, respectively, and for both similarity measures, 517
linear models showed very poor fit (adjusted R2 < 0), suggesting better fit for the power function. The 518
right superior temporal gyrus cluster overlapped with a right inferior parietal reverse pattern 519
separation cluster (repetition > similar = novel) but did not show sufficiently reduced AICc for the 520
best fitting decreasing slope power function for conceptual similarity relative to the linear function 521
(AICc difference = 1.56). However, the right supramarginal gyrus subpeak of this cluster was closer to 522
the peak of the overlapping right inferior parietal cluster (4.2 vs.14.7 mm; see Table 4) and showed 523
better fit for the decreasing slope power model for conceptual similarity, consistent with pattern 524
separation (AICc difference = 19.41). 525
Among the a priori ROIs, posterior LIFG showed the predicted power function with decreasing 526
slope for conceptual similarity, indicative of pattern separation and consistent with the overall 527
analysis (AICc difference =8.59). Contrary to predictions however, the right middle occipital (RMO) 528
ROI showed best fitting increasing slope power functions for both conceptual and perceptual 529
similarity (AICc differences = 29.42 and 18.31). For all other ROIs, including a left anterior cingulate 530
region which did not overlap with pattern separation or completion regions, support for the predicted 531
pattern separation or completion function was not found. 532
533
1 2 3 4 5 6 7 8 9 10 11 12 13 14 15 16 17 18 19 20 21 22 23 24 25 26 27 28 29 30 31 32 33 34 35 36 37 38 39 40 41 42 43 44 45 46 47 48 49 50 51 52 53 54 55 56 57 58 59 60 61
< FIGURE 6 about here > 535
536
537
3.2.3. Subsequent memory 538
3.2.3.1. Analysis strategy 539
Encoding trials were sorted according to responses in the subsequent recognition test (see Fig. 540
3). Subsequent hits to studied items and subsequent correct rejection of lures were classified as item-541
specific memory, while subsequent partial recognition of studied items as 'similar' and subsequent 542
false recognition of lures as ‘same’ were classified as gist memory (Garoff et al., 2005). Misses 543
(‘new’ responses) of studied items and lures comprised the subsequent forgetting category. Hits 544
versus partial recognition of studied items, and correct rejection versus false recognition of lures were 545
analysed as two distinct subsequent memory effects, one relating to encoding supporting recognition 546
of studied items, the other to encoding supporting mnemonic discrimination of lures (Cheng and 547
Rugg, 2010). To examine encoding predicting gist memory, we used unidirectional t-contrasts to 548
identify activity increases for subsequent partial recognition relative to subsequent hits; and for 549
subsequent false recognition relative to subsequent lure correct rejection. As both partial and false 550
recognition have been proposed to reflect gist memory (Garoff et al., 2005), to maximise trials 551
available for gist contrasts and to allow comparison with the results of Garoff et al. (2005), additional 552
contrasts also collapsed subsequent partial and false recognition into a single 'gist memory' category, 553
and compared this separately with subsequent hits and subsequent correct rejection. The reverse 554
contrasts were also computed (subsequent hits > subsequent partial recognition; subsequent correct 555
rejection > subsequent false recognition, and each item-specific memory outcome > subsequent gist 556
memory). Finally, each response category was also contrasted with subsequent forgetting. 557
558
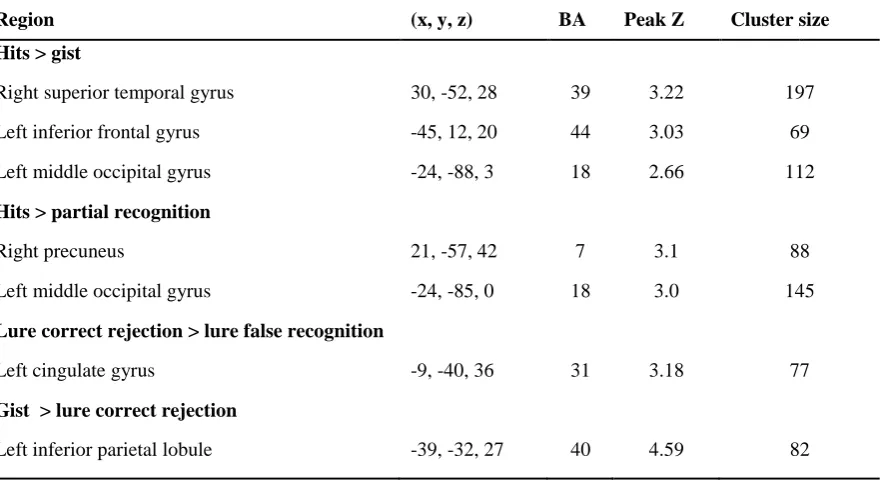
3.2.3.2. Findings 559
Results of the subsequent memory analyses are summarised in Table 6. Encoding of items 560
attracting subsequent hits, when compared with subsequent gist memory (partial recognition of 561
studied items and false recognition of lures) elicited greater activity in right superior temporal gyrus, 562
posterior LIFG, and left middle occipital gyrus. The contrast of subsequent hits vs. subsequent partial 563
recognition revealed activity in right precuneus and left middle occipital gyrus. Encoding predicting 564
lure correct rejection compared to lure false recognition elicited greater activity in posterior cingulate. 565
Encoding predicting subsequent gist memory, when contrasted with encoding predicting subsequent 566
lure correct rejection, revealed activity in left inferior parietal lobe. 567
1 2 3 4 5 6 7 8 9 10 11 12 13 14 15 16 17 18 19 20 21 22 23 24 25 26 27 28 29 30 31 32 33 34 35 36 37 38 39 40 41 42 43 44 45 46 47 48 49 50 51 52 53 54 55 56 57 58 59 60 61
< TABLE 6 about here > 569
570
The voxel-wise analysis in the hippocampus showed that activity in right posterior and left 571
anterior regions predicted subsequent correct rejection of lures relative to subsequent gist memory 572
(Table 3). Activity in a left posterior region was also greater for encoding of items for which lures 573
were subsequently falsely recognised compared to items for which lures were correctly rejected. 574
575
3.2.4. Overlap between pattern separation/completion and item-specific/gist encoding 576
3.2.4.1. Analysis strategy 577
Functional overlap between pattern separation or pattern completion and mnemonic encoding 578
was assessed by searching for regions showing conjoint activity between significant contrasts 579
employed in pattern separation and subsequent memory contrasts (see Sections 2.7.1., 3.2.1.1. & 580
3.2.3.1. for masking and thresholding procedures) for the 13 participants included in both analyses. 581
582
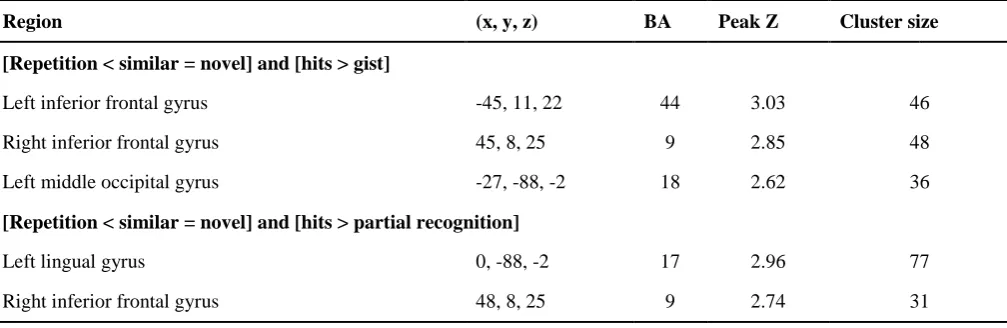
3.2.4.2. Findings 583
The conjoint analysis revealed significant functional overlap between regions engaged in 584
pattern separation and encoding predicting hits to studied items (Table 7 & Fig. 7). Bilateral inferior 585
frontal and left middle occipital regions showed both pattern separation (repetition < similar = novel) 586
and greater activity for subsequent hits than subsequent gist memory. Overlap was also observed 587
between pattern separation activity and encoding activity predicting subsequent hits relative to 588
subsequent partial recognition in left occipital and right inferior frontal cortex. No significant 589
functional overlap was observed between pattern separation and gist encoding, or between pattern 590
completion and either item-specific or gist encoding. 591
592
< TABLE 7 about here > 593
< FIGURE 7 about here > 594
595
596
4. Discussion 597
This is the first study to investigate cortical pattern separation and completion of visual object 598
representations in humans. We found neural activity consistent with pattern separation in occipito-599
temporal cortex and bilateral lateral PFC, and pattern completion in left anterior PFC and right 600
precuneus. In bilateral lateral PFC, and right parietal regions, responses to parametrically varied 601
1 2 3 4 5 6 7 8 9 10 11 12 13 14 15 16 17 18 19 20 21 22 23 24 25 26 27 28 29 30 31 32 33 34 35 36 37 38 39 40 41 42 43 44 45 46 47 48 49 50 51 52 53 54 55 56 57 58 59 60 61
are in line with computational predictions (Treves and Rolls, 1992; Vazdarjanova and Guzowski, 603
2004) and with findings of pattern separation and completion computations in sensory cortex in 604
rodents (Aimone et al., 2011; Barnes et al., 2008). Bilateral prefrontal and left occipital cortex regions 605
showing pattern separation activity were also engaged during encoding predicting subsequent true 606
recognition, consistent with suggestions that cortical pattern separation contributes to successful item-607
specific encoding. Contrary to predictions, we did not detect overlap between pattern separation 608
activity and encoding activity associated with later mnemonic discrimination of lures, although 609
activity in the hippocampus did predict accurate lure rejection, in line with previous findings (e.g., 610
Kirwan & Stark, 2007). The data are consistent with the view that cortical pattern separation at 611
encoding contributes to successful item-specific memory, but that further processes, such as encoding 612
of gist and item-specific information, contribute to later mnemonic outcomes. 613
614
4.1. Behavioural findings 615
Reaction time data did not reveal any evidence that later recognition outcomes were due to 616
differences in duration of processing at study. Faster RTs at study to both repeated and similar items 617
are consistent with priming of similar items based on overlapping perceptual or conceptual features 618
(Stenberg et al., 2009). Performance on the ‘same/similar/new’ recognition test was similar to that in 619
previous reports (Garoff et al., 2005; Stark et al., 2013; Toner et al., 2009) with participants most 620
often correctly classifying studied, lure and novel images as ‘same’, ‘similar’ and ‘new’, respectively. 621
Proportions of ‘similar’ responses to each item type were lower than in Garoff et al.’s (2005) earlier 622
study which employed the same retention interval and largely the same stimulus set. This may be 623
explained by the fact that in Garoff et al.’s (2005) study, a higher proportion of test items were lures 624
(2/5) compared to the current study (1/3), which may have led to greater bias to respond ‘similar’ in 625
the original study. This may also be why responses here but not in the previous study were also less 626
accurate for lures than for studied and novel items. The pattern observed here is consistent with 627
previous findings of reduced performance for lures (e.g., Stark et al., 2013; Toner et al., 2009), and 628
with claims that lure discrimination places greater demands on pattern separation (Kirwan and Stark, 629
2007; Yassa et al., 2011) and/or post-retrieval processing (Brainerd et al., 2003; Morcom, 2015) and 630
is therefore associated with reduced accuracy. 631
632
4.2. Pattern separation and pattern completion 633
As predicted, contrasts of study phase activity elicited by novel, repeated and all similar items 634
revealed evidence of pattern separation in bilateral occipito-temporal cortex in both a priori and 635
whole-brain analyses. This is consistent with neurophysiological evidence of orthogonalisation of 636
1 2 3 4 5 6 7 8 9 10 11 12 13 14 15 16 17 18 19 20 21 22 23 24 25 26 27 28 29 30 31 32 33 34 35 36 37 38 39 40 41 42 43 44 45 46 47 48 49 50 51 52 53 54 55 56 57 58 59 60 61
studies reporting sensitivity of visual regions to subtle perceptual change in images (Chouinard et al., 638
2008; Kim et al., 2009; Koutstaal et al., 2001), by identifying occipito-temporal clusters of activity 639
that show differential activity between repetitions and both novel and similar items, with no hint of 640
activity differences between novel and similar items. Curve fitting analysis did not however provide 641
additional support for true computational pattern separation in occipito-temporal regions. 642
We also observed activity consistent with pattern separation in bilateral, mainly posterior and 643
inferior, regions of lateral frontal cortex. In bilateral inferior frontal and right parietal areas, 644
converging evidence from the overall analyses and from curve fitting supported pattern separation, 645
indicative of sensitivity to item novelty despite overlapping representations. The prefrontal regions 646
have been linked to cognitive control functions including selection among competing memory 647
representations (Badre and Wagner, 2007; Dudukovic and Wagner, 2007), and goal-related attentional 648
modulation of sensory signals in extrastriate visual regions (Zanto et al., 2011), and of hippocampal 649
processing (Summerfield et al., 2006). Such top-down modulation is consistent with other evidence 650
that the regions engaged in pattern separation or completion vary according to the orienting task as 651
well as the stimuli (Hashimoto et al., 2012; Motley and Kirwan, 2012). Parametric analysis indicated 652
both conceptual and perceptual pattern separation in the right inferior frontal region. A contribution of 653
both similarity dimensions is in keeping with the task goals which made both dimensions of 654
individual items relevant. However a dominance of conceptual separation in the posterior LIFG ROI 655
may also reflect its proposed specialisation for resolution of competition between active semantic 656
representations (Badre et al., 2005; Thompson-Schill et al., 1999). The present data raise the 657
possibility that pattern separation computations may contribute to this resolution. 658
Suggestions of pattern completion from initial contrasts in regions including anterior inferior 659
left PFC, right precuneus and left parietal lobe were not borne out by the more specific parametric 660
similarity analysis. In the case of the left prefrontal regions, lack of significant repetition sensitivity 661
when only the subset of novel and repeated items were analysed precluded examination of input 662
response functions. Other repetition sensitive ROIs did overlap with clusters revealed in the overall 663
pattern separation (e.g., left and right middle occipital, right inferior occipital) or completion (left 664
inferior parietal, right precuneus) contrasts, but did not show the predicted model fit for these 665
computations. Selection of repetition sensitive ROIs using different trials from those included in 666
similarity analyses allowed us to ensure that the two pattern separation/completion analyses were 667
independent, but this reduced the number of trials in both analyses. Although this presumably 668
impacted sensitivity, the only inconsistent result between the two was in the right middle occipital a 669
priori ROI, in which the two analyses showed repetition effects of opposite direction. No region 670
showed greater evidence for a linear response than for the increasing/decreasing slope power 671
functions predicted for pattern separation or completion in the closest or overlapping peak. Future 672