Rochester Institute of Technology
RIT Scholar Works
Theses Thesis/Dissertation Collections
8-1-2012
An Investigation of ink usage in offset process
printing
Jiayi Zhou
Follow this and additional works at:http://scholarworks.rit.edu/theses
Recommended Citation
An Investigation of Ink Usage in Offset Process Printing
By Jiayi Zhou
A thesis submitted in partial fulfillment of the requirements for the degree of Master of Science
in the School of Print Media
in the College of Imaging Arts and Sciences of the Rochester Institute of Technology
Aug 2012
Table of Contents
CHAPTER 1 - INTRODUCTION ...1
SUSTAINABLE PRINTING AND REDUCING INK USAGE ...1
APPROACHES OF REDUCING INK USAGE ...3
REASONS FOR INTEREST IN INK USAGE ...3
CHAPTER 2 – THEORETICAL BACKGROUND ...5
ROLE OF GRAPHIC CONTENT IN INK USAGE ...5
ROLE OF GCR IN INK USAGE ...6
CHAPTER 3 – LITERATURE REVIEW ...11
INK USAGE ESTIMATE METHODS AND INK UNIT PRICE ...11
GRAPHIC CONTENT AND INK SAVING ...13
GCR AND INK SAVING ...14
CHAPTER 4 – RESEARCH QUESTIONS ...17
RESEARCH QUESTION#1–AIC AND INK USAGE ...17
RESEARCH QUESTION#2–GCR AND INK USAGE ...17
CHAPTER 5 – METHODOLOGY ...19
METHODOLOGY #1–AIC AND INK USAGE ...19
METHODOLOGY #2–GCR AND INK USAGE ...25
ii
CHAPTER 7 – DISCUSSION AND SUMMARY ...36
AIC AND INK USAGE ...36
ACCURACY OF AIC-BASED INK ESTIMATE METHOD ...36
RUN LENGTH AND INK SAVING ...38
INK USAGE IN OFFSET AND OTHER PRINT METHODS ...40
PRELIMINARY BIBLIOGRAPHY ...42
APPENDIX A TEST FORM ...44
APPENDIX B PRESS RUN ORGANIZER ...45
List of Tables
Table 1. AIC readings for image “Cookies” and “Seafood” ...9
Table 2. Printing coverage area constants ...11
Table 3. Average unit price of process ink ...12
Table 4. AIC-Ink usage model - production information ...20
Table 5. AIC per page per color and average AIC for each publication ...23
Table 6. Production information and AIC ...24
Table 7. AIC – Ink usage normalized model ...31
Table 8. Ink usage comparison for high AIC and low AIC ...32
Table 9. AIC for normal GCR and high GCR ...34
Table 10. Ink usage for normal GCR and high GCR ...34
Table 11. Ink usage comparison for normal GCR and high GCR ...34
Table 12. Estimated ink usage vs. actual ink usage ...37
iv
List of Figures
Figure 1. Image: “CMYK Pach” before and after averge blur, and AIC reading ...8
Figure 2. Image: “Seafood” before and after averge blur, and AIC reading ...9
Figure 3. Four steps to build an AIC-Ink usage model ...20
Figure 4. Pages selected from high AIC and low AIC publication ...21
Figure 5. Blur – Average filter in Photoshop ...22
Figure 6. Before and after blur with readings ...22
Figure 7. Test form preparation workflow ...28
Figure 8 Dynamic maximum black setting ...29
Abstract
With the trend of sustainable printing in the print industry, reducing ink usage is
considered a win-win solution for printers who are seeking sustainable printing strategies,
and in the meantime, a way of cutting costs. This research focuses on ink-saving
strategies for process printing using color management technology in the prepress stage.
Two ink-saving methods are discussed in this research. First method is reducing the AIC
(Average Ink Coverage) in graphic design. A case study is carried out and verifies the
rule that high AIC requires more ink usage than low AIC does. However AIC and ink
usage are not committed to a linear relationship; instead, AIC variance, as a result of
different graphic designs, will be amplified in terms of ink usage variance during the
printing. Graphic design significantly affects the ink usage.
The second method is processing images that have same graphic designs, with optimized
GCR (Gray Component Replacement). The result is high GCR results less AIC and ink
usage; normal GCR results higher AIC and ink usage. AIC variance, as a result of
different GCR levels, will be diminished in terms of the ink usage variance during the
printing. GCR affects ink usage within a certain range. GCR does affect the ink usage,
1 Chapter 1
Introduction
Sustainable Printing and Reducing Ink Usage
This section brings out the topic of reducing ink usage under the sustainable printing
industry trend. Merits and approaches of reducing ink usage are discussed in detail.
Sustainable Printing
Sustainable printing and environmental concern continue to be news. Solutions for
sustainable printing cover various fields from environmentally friendly ink to recycled
paper, from workflow improvement to waste treatment. However, do administrative
management groups in printing companies aware the importance of being
environmentally responsible? How many printing factories have budgets to minimize
their environmental impact? And when there is a conflict between profit and environment
protection, what will choices be? Most of the time it seems that there is tradeoff between
pursuing profits and behaving in an environmentally responsible manner.
Reducing Ink Usage
The well-known concept of 3-R (Reduce, Reuse, and Recycle) is practical when comes to
usage. Reducing ink usage can be a win-win solution for printing manufacturers seeking
a way of cutting costs, improving production efficiency, and in the mean time, getting
certification for sustainable printing.
Merits of Reducing Ink Usage
Adopting a reasonable inking strategy has three major merits as listed below.
Cost Saving. Ink is usually 2% to 5% of the average cost of a print job (Ruggles, 2008). It
seems a small portion relative to the total job cost, but when it comes with a high-volume
print job, the cost of ink could be considerable. For example, during 1980 and 1990,
Procter & Gamble Co. was seeking methods to become low-cost manufacturers. One of
the strategies was to use less ink on the Tide package. This strategy realized an annual
savings of about $2 million (Rising Tide, 2004).
Production Efficiency. Reducing ink usage by means of Gray Component Replacement
(GCR) helps to shorten drying times, and to improve both color stability and gray balance
stability (Pritchard, 2009).
Sustainable Printing. In the paper recycling process, using less ink enables more efficient
3 Approaches for Reducing Ink Usage
Corresponding to printing workflow from prepress to press, there are various strategies
for ink usage reduction. In the graphic design and prepress stage, there are the two most
effective approaches for reducing ink usage:
1. Reducing the colored area and tone level of the graphic content
2. Replacing chroma ink with relatively less expensive black ink, known as Gray
Component Replacement (GCR) technology.
Both approaches take place in the digital file stage with the same goal: to reduce Total
Area Coverage (TAC) of the digital file. When graphic content is printed with less TAC,
ink usage consumed during the printing process will be reduced as a result.
Reasons for Interest in Ink Saving
As stated above, considering ink saving has the merits of cutting costs, improving
production efficiency, and stabilizing product quality; it is meaningful to take a further
step to study ink saving methodology, its potential impact to image quality and
This study focuses on ink saving strategies happen in the prepress stage. Prepress is at the
very beginning of the workflow, so any operation and optimization applied during
prepress has the largest effect in determining ink usage afterward. It would be very
interesting to see how graphic content and digital file optimization strategies affect the
5 Chapter 2
Theoretical Background
The following paragraphs elaborate on how graphic content and gray component
replacement (GCR) plays an important role in determining ink usage. Additionally,
concepts of total area coverage (TAC), average ink coverage (AIC), and gray component
replacement (GCR) are defined and explained in terms of their relationship differences
with ink usage.
Role of Graphic Contents in Ink Saving
In the process of print production, the first determination is the graphic content. Images
and typefaces jointly determine the graphic content, printing area, and tone level. As a
result, the graphic designer has the largest impact on deciding how much ink will be
consumed in order to print the graphic content. Graphic content designed in an
environmentally responsible way can lower ink costs by avoiding unnecessary inverse
designs or large shadow areas in the packaging design. Graphic design like this can be
recognized as sustainable graphic design, whose definition is “the application of
sustainability principles to graphic design.” This concept considers the environmental
etc.) throughout a life cycle that includes raw material, transformation, manufacturing,
and disposal (Refer to Wikipedia).
Ink saving can also be realized by using color management technology. Even though the
graphic content is designed with heavy ink coverage, still there is room left for ink
reduction if GCR technology is employed.
Role of GCR in Ink Saving
In order to explain how GCR functions in ink saving, the concept of total area coverage
and average ink coverage are defined; and their differences are discussed.
GCR⎯Gray Component Replacement
The definition of gray component replacement (GCR) is “a method of black generation
that replaces an amount of CMY with equivalent amount of K” (Real World Color
Management). GCR is an ink optimization methodology in color management, and it can
be integrated into ICC profiles or device link profiles. The kernel of GCR is a
CMYK-to-CMYK Look Up Table (LUT) embedded in the Device Link conversion process. Before
explaining how GCR works in terms of ink savings, there are two concepts that need to
7
TAC ⎯Total Area Coverage
In process printing, colors are generated by overprinting C, M, Y, and K process inks.
The maximal dot area sum of the four color (C, M, Y, and K) permitted in the darkest
area is defined as total area coverage (TAC), expressed as a dot percentage. For a print
job, the magnitude of TAC depends on the printing process type. The TAC value
determines how much ink is allowed to print the darkest point of one page. For example,
typical TAC is 320-340% for sheet-fed offset; 300-320% for web offset; 300% for
SWOP. (Refer to http://www.colourphil.co.uk/gcr_ucr_total_ink.html). TAC does not
indicate ink usage of a print job; it reflects the maximal ink coverage of the darkest point
for a pictorial color image.
AIC ⎯ Average Ink Coverage
Average ink coverage (AIC) is a new concept that can be defined as the average inked
area of each CMYK ink amount on a page, meaning an estimation of ink coverage per
color per page. AIC is also expressed as a dot percentage. Ideally, AIC and ink usage are
in direct proportion, meaning ink usage increases as AIC increases. In practice, ink usage
can be estimated based on AIC value.
AIC is obtained by averaging the dot percentage of each CMYK channel on one page.
Tools such as Photoshop’s “Blur – Average” can achieve this manipulation. To read the
If not, select “Image/Mode/ CMYK Color” to change into CMYK mode. Second, select
“Blur - Average” from the “Filter” menu. This operation allows Photoshop to take an
average calculation of the dot percentage of each pixel on that page. Lastly, to read the
AIC of each color for that page, select “Info” from the “Window” menu and place the
cursor on the blurred area. The info panel will show the AIC of the page.
[image:15.612.127.514.255.389.2]
Figure 1. Image: “CMYK Pach” before and after averge blur, and AIC reading
Figures 1 shows the “Blur – Average” concept with a simple vector image. Before
blurring, 40% C, M, Y, and K each occupies one quarter of the area (shown as Figure
1-Left). After processed via “Blur – Average”, CMYK colors are averaged as one single
color and filled in the whole area. (Figure 1-Middle). CMYK percentage reading on info
9
[image:16.612.136.265.90.222.2]
Figure 2. Image: “Seafood” before and after averge blur, and AIC reading
Figure 2 shows the application of “Blur – Average” with a pictorial image. Photoshop
displays their appearances before and after applying average blur, and their AIC values.
The original images is presented on the left, its appearance after average blurring is as
shown in the middle, and the info panel that displays the AIC readings is shown on the
right. Table 1 displays the readings of CMYK patches and Seafood. Those numbers are
considered as AIC value of that picture.
Table 1. AIC readings for image “CMYK patches and “Seafood”
Cyan Magenta Yellow Black
CMYK Patches 25 25 25 25
Seafood 44 62 69 33
Ink Saving by GCR
How does GCR work in ink saving? Theoretically, GCR works mainly in two aspects.
[image:16.612.135.517.90.225.2] [image:16.612.116.528.511.555.2]reduced accordingly. (Remember TAC represents the dot area sum of the darkest point of
a page). Second, GCR decreases CMY ink coverage by increasing K ink coverage while
maintaining the color appearance. Since black ink is relatively less expensive than
chroma ink, changing the proportion of process inks in the prepress stage appropriately
will result in decreasing ink cost without obvious color appearance shifts.
11 Chapter 3
Literature Review
This literature review intends to summarize previous relevant research of three topics:
1. For a typical offset printing job, what is the average unit price of process inks?
In addition, how is the ink cost estimated?
2. How does graphic content affect ink usage?
3. How does GCR affect ink usage?
Ink Usage Estimate Methods and Ink Unit Price
For a typical print job, the ink cost is usually 2% to 5% of the average cost of the job
(Ruggles, 2008). In the book Printing Estimating, Philip (2008) elaborated on offset ink
weight estimating methods using printing coverage area constants. In Table 2, the
numbers represent the approximate size that one pound of ink covers with 100% area on
[image:18.612.126.529.588.635.2]a litho-coated substrate.
Table 2. Printing coverage area constants
Cyan Magenta Yellow Black Litho Coated 340 345 355 380
The following are steps to calculate ink weight for a job with a known AIC of each color.
Step One – Calculate the total printing size.
Total printing size (Inch!) = Single page size (Inch!) × pages × copies
Step Two – Convert the total inked area
Convert the total inked area in certain percentage of AIC to the solid (100% dot) print in
corresponding size. In the above equation, AIC is obtained as stated on page 6.
Corresponding size of solid print = AIC × total inked area
Step Three – Find the ink weight.
Total ink weight = Corresponding size of solid print / constant
According to industry research, the average unit prices for process inks are as shown in
the following Table 3.
Table 3. Average unit price of process ink
Cyan Magenta Yellow Black Average Unit Price ($) per lb. 4.09 4.93 4.24 3.49 4.18
The unit prices for individual CMYK ink are slightly varied, and black is the least
13
usage and cost being reduced accordingly. And the other way is to use less expensive
black ink to replace cyan, magenta, and yellow inks. Having done calculating the total
ink weight, ink cost is calculable using the formula in Step Four.
Step Four – Find the ink cost.
Ink cost (per color) = Total ink weight × Ink unit price
Graphic Content and Ink Saving
Spranq has developed a new font that claims to save up to 20% of the cost of ink
according to Anon’s paper “Economic font: new cost effective font” published in 2009.
The new Ecofont has small holes in the letter strokes to decrease the use of ink or toner.
The inventor hopes the new font can increase users’ environmental and cost awareness
regarding ink and toner consumption. This is a good example of how typeface designers
can reduce ink consumption by simply changing the typeface design. In addition, the
design concept behind the font is: less inked area requires less ink usage.
This report reflects designers’ awareness of sustainability. If adding holes in type strokes
can save ink, what improvement is applicable to pictorial color image to save ink? Hence,
it is meaningful to see how pictorial color image with continuous tone affect ink usage
GCR and Ink Saving
Eric Neumann, Greg Radencic and Dr. Mark Bohan (2008) have published an article
titled “An Evaluation of Different Strategies for Ink Savings on Press.” In this article,
their research focused on “ink reduction strategies available in prepress stage and how
they impact the print quality and ink usage” (pg.1). The ink reduction strategy employed
in their research is GCR, which is integrated into different color management workflow
software. Conventional, synthetic, and composite images are used as test targets to
evaluate the performance of different software vendors’ GCR optimizing function. The
ink saving is computed by comparing digital files processed with and without GCR for
different workflows. There are two most valuable conclusions that any further research in
GCR can use as references. 1) All workflows do display overall ink savings when GCR is
employed. 2) The amount of ink saved is affected by graphic content and type. Images
with heavy coverage can achieve the largest savings. Besides the above two conclusions,
this research also pointed out that environmental factors (e.g., graphic contents and ink
density) need to be kept equally. As the research objective, GCR has to be the only factor
that determines the ink usage in the experiment. In this research, the ink savings are
evaluated based on the digital file limited in prepress stage. There is no discussion about
real ink mileage consumed in printing production.
15
LinkProfiler 1.8, X-Rite MonacoPROFILER4.6, ProfileMaker 5.01, etc. GCR is part of
the function in device link profiles. The experiment tested device link profiles along with
GCR in several aspects including colorimetric, visual appearance, and ink coverage. The
result shows that Alwan LinkProfiler is “capable of achieving good colorimetric and
visual results while limiting the amount of ink used” (pg.15). In summary, this paper
provides the background knowledge of device link carrying with GCR. In addition, the
finished research suggested using Alwan Link Profile as the application software to
optimize digital files with GCR.
The report Use of Device Link Profiles for Graphic Arts Industry published by French
Paper and Printing Engineering School, discussed the effect of Dynamic Device Link
Profile (Dynamic DVLP) and Conventional Device Link Profile (DVLP). The major
difference between a conventional and dynamic device link profile is that conventional
device link applies a pre-set calculation model to adjust CMYK percentage (mainly
decrease CMY percentage and increase K percentage) regardless of the image content,
meaning all images will be processed with the same manner as far as GCR level is
decided. Dynamic device link gives opportunity to have the application analyzed the
image characteristic first, and then optimize the CMYK percentage with a proper GCR
level to decrease CMY percentage, increase K percentage, yet maintain the color,
In this research, both dynamic and conventional DVLP are color management tools
developed by Alwan. They convert images between two CMYK spaces with different
levels of GCR. Dynamic DVLP claims to achieve higher GCR and more ink saving than
conventional DVLP. This report describes the methodology and results of this
comparison experiment of Dynamic DVLP and conventional DVLP. Colorimetric
accuracy was first assessed. Average and maximum Delta E and gamut mapping are
taken into account for determining the dynamic and conventional DVLP’s colorimetric
accuracy performance. The conclusion is that dynamic DVLP, carrying higher GCR,
achieves better color accuracy than conventional DVLP. The amount of ink saved is
calculated using Alwan CMYK Optimizer Ink Statistics, a digital count-based software.
As a result, the conclusion is still based on digital file pixel count instead of real printing
ink mileage. This experiment proved GCR does help save ink (at least the digital counts),
but it did not discuss the amount of each individual CMYK ink saved, thus was not able
to reflect the GCR merits of using cheaper black ink to replace CMY ink. In addition,
there is no discussion on ink saving in real printing when GCR technology is used.
17 Chapter 4
Research Questions
Research Question #1 – AIC and Ink Usage
It goes without saying that reducing ink coverage in the graphic design and prepress
stages helps reduce ink consumption in printing. It will be meaningful to see the real cost
difference between light ink coverage content and high ink coverage content in practical
printing. The first research question is: how does graphic content difference (high AIC vs.
low AIC) affect ink usage in practical printing?
Research Question #2 – GCR and Ink Savings
Previous research did prove that the use of GCR results in ink savings. However, all
existing ink-saving estimation methods are mostly based on simulation, which is counting
the pixel value of images using a software application. Some ink saving application
advertisements claim that the ink usage reduced can be as much as 30% when proper
GCR settings are applied.
Here comes a question on whether the pixel counting saving indicates accurate ink cost
As a result, the second research question is: how much ink can actually be saved in the
press run with GCR being used?
19 Chapter 5
Methodology
Methodology for Research Question #1 – AIC and Ink Usage
A case study was discussed to get an explanation for research question #1. In this case
study, an “AIC - ink usage” model was built to reveal the relation between AIC and ink
usage. In this model, two different printed magazines are borrowed as testing objects.
One magazine carried heavy ink coverage (high AIC) and the other carried low ink
coverage (low AIC). Their production information such as AIC, ink usage, and printing
volume were collected and listed against each other to display the ink usage difference
caused by the different AIC level.
An offset company provided the printed magazines and production data, which were
considered to represent a general printing situation. Connecting with this case study, the
model revealed the magnitude of AIC in affecting the actual ink usage. The model
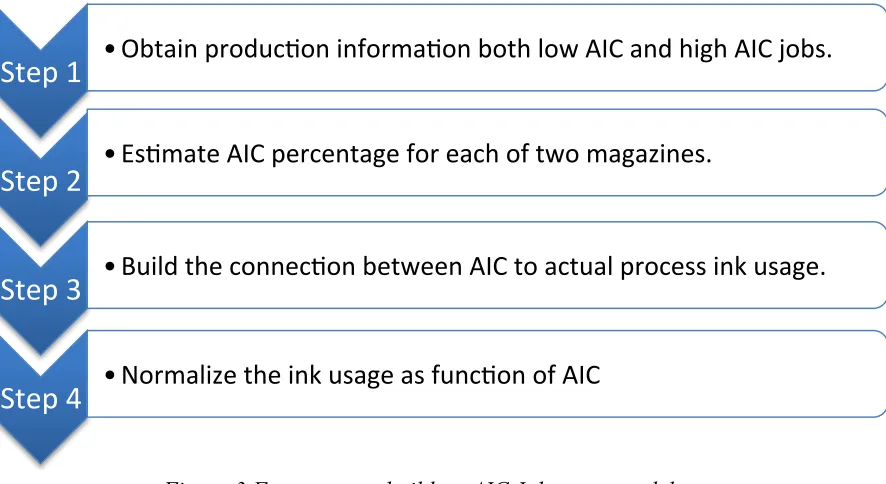
building procedures were composed of four steps. Figure 3 displays this four steps
Figure 3 Four steps to build an AIC-Ink usage model
Step One – Obtain production information both low AIC and high AIC jobs.
An offset printing company provided the hard copy of magazines and production
information. The known production information including page size, publication pages,
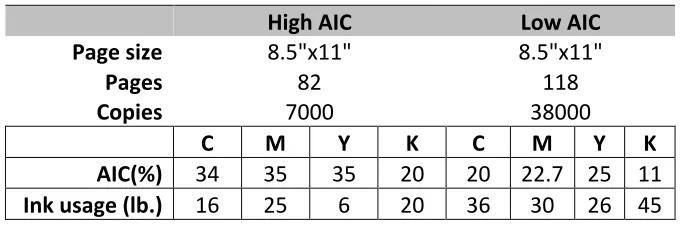
printing qualities, and process ink usage is shown in Table 4.
Table 4. AIC-Ink usage model - production information
High AIC Low AIC
Page size 8.5"x11" 8.5"x11"
Pages 82 118
Copies 7000 38000
C M Y K C M Y K Ink usage (lb.) 16 25 6 20 36 30 26 45
Step 1
•
Obtain produc?on informa?on both low AIC and high AIC jobs.
Step 2
•
Es?mate AIC percentage for each of two magazines.
Step 3
•
Build the connec?on between AIC to actual process ink usage.
21
The AIC was unknown temporarily because none of the magazines’ digital files were
provided to author. Hence, the next step was to sample the AIC from two hard copy
magazines.
Step Two – Estimate AIC percentage for each of two magazines.
First, the researcher randomly selected 10 pages from each magazine and scanned these
pages into digital files using an Epson flatbed photo scanner. Figure 4 shows the selected
[image:28.612.135.516.341.603.2]pages for both high AIC and low AIC magazines.
Then, the researcher opened the scanned pages in Photoshop and converted color space
from the original RGB color space to CMYK SWOP v2 color space. In order to get the
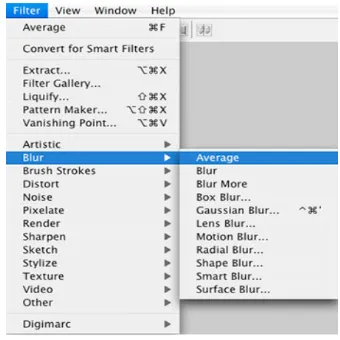
AIC of each page, the “Blur – Average” filter (see Figure 5) was used to blur all pages.
This operation allows Photoshop analyzing the color of each pixel for that page to
determine an average value, and then filling the whole page with that color of the average
value (Richard, 2009 Understanding Adobe Photoshop CS4). Figure 6 shows the average
[image:29.612.238.408.283.453.2]blur filter effect on one page.
[image:29.612.120.529.494.652.2]23
To read the AIC of each CMYK ink, info panel was called from the “window” menu
(Figure 5) with the cursor on the blurred page, the info panel displayed the separated
CMYK ink printing area (left circle) as well as the total ink amount (right circle).
The researcher repeated the above procedures to obtain the AIC of ten pages in each of
two publications. Table 5 shows the AIC for each of 10 pages. The average AIC
[image:30.612.132.513.337.532.2]represents that magazine’s AIC.
Table 5. AIC per page per color and average AIC for each publication
High AIC Low AIC
Page # C M Y K C M Y K
1 30 31 35 16 16 10 5 1
2 31 25 29 20 38 58 57 27 3 45 44 49 32 21 18 11 4 4 25 22 20 10 18 17 22 11
5 33 31 33 18 7 7 7 1
6 28 23 25 9 22 18 23 10
7 34 29 32 17 18 17 25 11 8 32 40 53 23 13 12 16 7 9 34 28 32 17 33 29 35 22 10 49 49 44 34 18 41 49 16
Average 34.1 32.2 35.2 19.6 20.4 22.7 25 11
Step Three – Build the connection the AIC with the process ink usage
Knowing the AIC for each magazine, the next step was to list the production info and
production information as well as the AIC percentages for both high and low AIC
[image:31.612.154.494.198.311.2]magazines.
Table 6. Production information and AIC
High AIC Low AIC
Page size 8.5"x11" 8.5"x11"
Pages 82 118
Copies 7000 38000
C M Y K C M Y K AIC(%) 34 35 35 20 20 22.7 25 11
Ink usage (lb.) 16 25 6 20 36 30 26 45
In Table 6, high AIC publication had an overall higher AIC value for CMYK than low
AIC magazine had, which is obvious and understandable. However, the process ink usage
of the high AIC magazine was even less than that of the low AIC magazine. The reason is
that the process ink usage for each of the two magazines was not compared under the fair
condition.
In printing production, factors other than AIC, such as page size, page numbers, and
printing volume also affect the total ink usage. The page counts and copy quantity for two
magazines in Table 6 are different, meaning the AIC is not the only factor determining
25
Step Four – Normalize ink usage as a function of AIC
The normalization logic is to divide the process ink usage in Table 6 into a unit weight,
that is pounds per square inch, and then, to multiply the unit weight with a standard page
size of 8.5 inch by 11 inch, 100 pages and 1000 copies.
The following equations show the procedures of normalization.
1. Ink weight for each copy = Total ink weight / copies
2. Ink weight for each page = Ink weight for each copy/ pages
3. Ink weight for each square inch = Ink weight for each page / page size
4. Ink weight for one page in size of 8.5” × 11” = Ink weight for each square inch ×
8.5” × 11”
5. Ink weight for 100 pages = Ink weight for one page × 100
6. Ink weight for 1000 copies = Ink weight for 100 pages × 1000
Methodology for Research Question #2 – GCR and Ink Usage
To answer research question #2, a test form carrying high ink coverage was processed by
normal GCR and high GCR, generating two test forms: a normal GCR test form and a
high GCR test form. The researcher printed the two forms to a standard printing
in the ink usage between the two test forms were compared and their relationship with
GCR levels was discussed.
The following sections describe the whole process in three steps:
Step One – Printing condition standardization
Step Two – Test Form preparation
Step There – Press Run
Step One – Printing condition standardization.
In offset printing, many factors can affect the ink usage, including AIC, SID (solid ink
density), TVI (tone value increase), etc. For testing the GCR effect on ink usage and ink
saving, it was important to keep SID and TVI in the same condition and settings for both
test forms’ printing. Hence, performing an initial and characterization run before running
the GCR test forms is necessary. This run was composed of two parts: initial run and
characterization run.
Initial run. The goal of an initial run was: 1) to adjust the ink density to conform to
colorimetric aim point of solids per ISO 12647-2; 2) to obtain the initial TVI and
generate the transfer curve to adjust the TVI to conform to aim point of TVI per ISO
27
measured to derive the initial TVI. By comparing the initial TVI and ISO standard TVI,
the transfer curve was generated and applied to the second set of plates, named “curved
plate”
Verification run. The goal of the verification run was to verify the conformity to the ISO
12647-2 standard. Firstly, the test form (IT8.7/4) was printed with curved plates to
achieve both the SID and TVI aim points per ISO 12647-2. Then, the test form (IT8.7/4)
was measured ; color difference was calculated between the printed test form (IT8.7/4)
and FOGRA39 characterization dataset. It turned out that the press was in good
conformity to the ISO 12647-2, and as a result, the FOGRA39 was considered as a
reasonable output space to process the two GCR test forms in the following experiment.
Step Two – Test Form Preparation
GCR’s ink saving effect is very image-dependent. Theoretically, ink usage has the most
obvious decrease when apply a level GCR is applied to the high AIC. To expect a
noticeable GCR ink saving in the press run experiment, the test form was designed with
high AIC pictorial images and background. Appendix A shows the layout of the test
forms. The following paragraphs elaborate the workflow of preparing the high GCR and
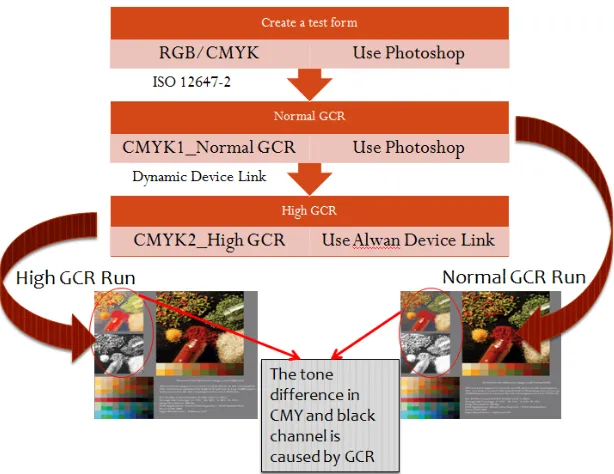
Figure 7. Test form preparation workflow
First, the researcher composed the test form using Photoshop, which transferred pictorial
images from RGB or CMYK into FOGRA39 space. The normal GCR level was
employed during the transfer. The output file was then named “normal GCR test form”
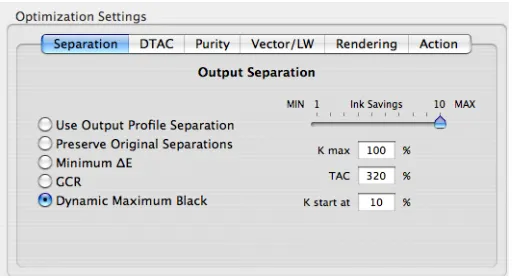
which was embedded with FOGRA39.
Second, the researcher processed the normal GCR test form using the Alwan CMYK
Optimizer. Both input and output spaces were maintained as FOGRA 39. Figure 8
displays the CMYK Optimizer interface where the Dynamic maximum black was applied
29
Figure 8. Dynamic maximum black setting
Step Three – Press Run
Materials and Devices. The experiment pressrun was executed on web offset press with
Sun Chemical ink and NewPage 80# Sterling Ultra Matte text. The GOSS Sunday 2000
was used to run the experiment because it is installed with an ink meter that can track ink
usage on the press. In printing, the ink flow through the meter causes rotation of a
positive displacement gear. The rate of rotation is monitored by a sensing device and
transmitted to a counter, which provides a read out of the amount of ink passing through
the meter. The unit of the ink meter is 1 pound, meaning that the minimum detectable ink
usage increase is one pound.
Pressrun. The press length was 24,000 impressions for each test form. Ink usage was
read every 2 minutes, after the press went into a stable condition until it achieved the
anticipated impressions. In this way, the increasing ink usage was recorded for each
Data Collection. The collected data included the AIC of two versions of the test form and
ink usage measured from the pressrun.
31 Chapter 6
Results and Conclusions
Result for Research Question #1 – AIC and Ink Usage
AIC – Ink Usage Model
To investigate the significance of graphic content difference (high AIC vs. low AIC) to
ink usage, two publications with high AIC and low AIC were employed to build an “AIC
[image:38.612.155.494.392.505.2]– Ink usage” normalized model as displayed in Table 7.
Table 7. AIC – Ink Usage normalized model
High AIC Low AIC
Page size 8.5"x11" 8.5"x11"
Pages 100 100
Copies 1,000 1,000
C M Y K C M Y K AIC (%) 34 35 35 20 20 23 25 11
Ink usage (lb.) 2.8 4.4 1.0 3.5 0.8 0.7 0.6 1.0
This model provides an equivalent printing condition, in which ink usage of two
magazines, one with high AIC and one with low AIC, were compared against each other.
In this model, AIC is considered to be only factor causing a difference in ink usage.
Data Analysis
For the high AIC publication, each individual color AIC is: C -34%, M - 32%, Y - 35%
and K - 20%. After printed, the ink usage is: C - 2.8 lb.; M - 4.4 lb.; Y - 1.0 lb.; and K -
3.5 lb.
For the low AIC publication, AIC for each individual color is: C - 20%, M - 23%, Y -
25% and K - 11%. After printed, the ink usage is: C - 0.8 lb.; M - 0.7 lb.; Y - 0.6 lb.; and
K -1.0 lb.
Table 8. Ink usage comparison for high AIC and low AIC
Cyan Magenta Yellow Black
AIC Ink Usage AIC Ink Usage AIC Ink Usage AIC Ink Usage High AIC 34 2.8 35 4.4 35 1 20 3.5
Low AIC 20 0.8 23 0.7 25 0.6 11 1
Ratio 1.7 3.5 1.5 6.3 1.4 1.7 1.8 3.5
To investigate the way AIC affects ink usage, the AIC and ink usage ratio between high
AIC design and low AIC design is shown in table 8. The cyan AIC ratio is 1.7, and the
cyan ink usage ratio is 3.5, which means that for every 1 lb. of cyan used in the low AIC
design, there should be 3.5 lb. of cyan used in the high AIC design. Following the same
logic, the magenta AIC ratio is 1.5, and the ink usage ratio is 6.3; yellow AIC ratio is 1.4,
33
Conclusion
To answer the first research question ⎯ how does graphic content difference (high AIC
vs. low AIC) affect ink usage ⎯ the rule is that high AIC always requires more ink usage
and low AIC always requires less ink usage. AIC variance, as a result of different graphic
designs in the digital files, will yield to an amplified ink usage difference in printing.
Hence, graphic design significantly affects ink usage.
Result for Research Question #2 – GCR and Ink Savings
As discussed in the methodology section, a high level GCR applied to a test form
decreases AIC. Then two versions of test forms are sent to the press to capture the actual
ink usage. In this section, the author will share the AIC before and after being applied
with GCR and ink usage collected on the press.
Data Analysis
With GCR employed, the AIC of cyan, magenta, and yellow decreases, while the AIC of
black increases. AIC is decreased by 48% for cyan, 43% for magenta, and 43% for
yellow. The AIC of black is increased by 49%. The overall area coverage is decreased by
26%. The conclusion for this table is that applying GCR to a high AIC test form certainly
results in a drease in AIC for cyan magenta and yellow, while resulting in an increase for
Table 9. AIC for normal GCR and high GCR
AIC (%) Cyan Magenta Yellow Black Total Normal GCR 50 46 47 35 178
High GCR 26 26 27 52 131
Delta AIC 24 20 20 -‐17 47
AIC decreased by 48% 43% 43% 49% 26%
Table 10 shows the final ink usage for both test forms. Ink usage decreases by 27% for
cyan, 30% for magenta, and 39% for yellow. The usage of black increases by 32%. The
total ink usage decreases by 20%. Applying GCR to a high AIC test form results in an
obvious reduction in ink usage of cyan, magenta and yellow, while resulting in an
[image:41.612.155.494.442.519.2]increase for black. The overall ink usage is decreased by 20% as a result of GCR.
Table 10. Ink usage for Normal GCR and High GCR
Weight (lb.) Cyan Magenta Yellow Black Total Normal GCR 41 27 28 28 124
High GCR 30 15 17 37 99
Delta lb. 11 8 11 -‐9 25
[image:41.612.98.554.601.680.2]Ink saved by (%) 27% 30% 39% 32% 20%
Table 11. Ink usage comparison for normal GCR and high GCR
Cyan Magenta Yellow Black
35
To investigate the way GCR affects ink usage, AIC and ink usage ratio between the
normal GCR test form and the high GCR test form is as shown in Table 11. The cyan
AIC ratio is 1.9 (cyan AIC of normal GCR divided by cyan AIC of high GCR), and the
ink usage ratio is 1.4 (cyan ink usage of normal GCR divided by cyan ink usage of high
GCR). The ratio 1.4 means that for every 1 lb. cyan used in the high GCR test form, there
should be 1.4 lb. of cyan used in the normal GCR test form. Following the same logic,
the magenta AIC ratio is 1.8, and the ink usage ratio is 1.8; the yellow AIC ratio is 1.7,
and the ink usage ratio is 1.6; the black AIC ratio is 0.7, and the ink usage ratio is 0.8. For
all four colors, the AIC differences that exist in the high GCR and normal GCR digital
file is diminished in ink usage after printing.
Conclusion
To answer the second research question ⎯ how does GCR variance (high GCR vs.
normal GCR) affect ink usage ⎯ the rule is that a high GCR results in less AIC and ink
usage; and a normal AIC results in higher AIC and ink usage. AIC variance, as a result of
different GCR levels, will yield a diminished ink usage variance in printing. Hence, GCR
affects ink usage within a certain range, but not as significant as graphic design does.
Chapter 7
Discussion and Summary
AIC and Ink Usage
Comparing the AIC and ink usage of the two test forms, the researcher finds that
although ink usage and AIC both decreased, they do not decrease proportionally. For
example, while the cyan AIC of the normal GCR test form is 48% higher than that of the
high GCR test form, it does not necessarily mean that the cyan usage of the normal GCR
test form will also be 48% higher than that of the high GCR test from. Instead, it is 27%.
The ink estimate method that used AIC to represent the ink usage is not accurate enough.
This result further verifies the conclusions from the “AIC-Ink usage model”, which is that
AIC and ink usage, are not linear in their linear relationship. The resulting ink usage
variance by the GCR level (high GCR vs. normal GCR) is actually smaller than the AIC
variance in the digital file.
Accuracy of AIC-based Ink Estimate Method
37
based ink usage estimate method, it is possible to estimate ink usage. Estimated ink usage
[image:44.612.139.510.199.325.2]and actual ink usage are compared against each other in Table12
Table 12 Estimated ink usage vs. actual ink usage
Normal GCR Cyan Magenta Yellow Black AIC(%) 50 46 47 35
Estimated Ink Usage (lb.) 45.77 41.5 41.2 28.67
Actual Ink Usage (lb.) 41 27 28 28
High GCR Cyan Magenta Yellow Black AIC(%) 26 26 27 52
Estimated Ink Usage (lb.) 23.8 23.45 23.67 42.59
Actual Ink Usage (lb.) 30 15 17 37
Actual ink usage of cyan and black are close to the predicted amount, while magenta and
yellow are off from the estimate. The estimate method is logically correct, but the
printing coverage area constants have an issue. These constants are calculated based on a
press experiment. The press, substrate and printing condition jointly determine the
printing coverage area constant. Technically, if the GCR press run is done under the same
printing condition as Philip’s experiment, the estimated ink usage should match the actual
amount. However, although the estimate method claimed to be applicable to offset
printing, the press, substrate, and printing condition results Philip’s constant are not
accurate enough, which explains the mismatch between the estimated ink usage and the
Run Length and Ink-Saving
Ink cost might comprise only 2% - 5% of the total material cost. And the ink cost saving,
as a result of AIC decrease, might reduce the total ink usage by 10% - 50%, depending on
whether AIC is decreased as result of varying graphic designs or high level GCR. But
who cares about a 50% ink cost saving within a mere 2% of the total material cost? The
big print corporations with millions of dollars in production costs care! In the real world,
assume a printing company receives a routine print job that happens every month. The
AIC difference in the digital file will end up accumulating a considerable ink usage
variation by end of the year.
For any print job, graphic design is the primary factor that determines the final ink usage.
In high-volume printing companies, such as packaging printing, the most effective way to
save ink is to eliminate the art design for a low AIC design. However, printers do not
usually make decisions on art design; instead, they are more likely to receive art from the
clients and print what the clients want them to print. In this case, GCR can be employed
to decrease the AIC to a certain level, which satisfies the ink-saving purpose without
hurting the image quality and color accuracy.
The test form press run experiment proves the GCR effect in ink saving. With 24,000
39
press run per process color. The x-axis is the time length starting from 0 to 55 minutes,
when the press run ended. Y-axis is the ink usage read every two minutes. The graphics
shows increasing ink usage along the timeline.
[image:46.612.119.528.195.467.2]
Figure 9. Ink usage increasing curve
For all four colors, there is no significant ink usage difference (between normal GCR and
high GCR) within the first 20 minutes. The high GCR advantage became obvious after 30
minutes. GCR is helpful only for long press runs. The longer the press run is, the more
ink is saved. For a short run and a small quantity job, a high level GCR doesn’t show its
GCR saves ink costs in two ways. Firstly, as concluded above, GCR decreases the overall
AIC and total ink usage, which, of course, causes a savings in ink costs. Secondly, the
unit prices for cyan, magenta, and yellow inks are usually higher than they are for black
ink. GCR manipulates a digital file by decreasing cyan, magenta, and yellow inks, and by
increasing black ink, so that the color appearance is kept unchanged. Hence, replacing
relatively expensive cyan, magenta, and yellow inks with less expensive black ink saves
ink cost.
Ink savings in offset and other print methods
This research only discusses the ink saving in the offset field. GCR is found to be the
most effective for high AIC type images and lengthy offset production. For small
quantity offset print jobs, the ink saving caused by GCR is very limited. According to the
literature review, the total ink cost in an offset job is usually 2% to 5% depending on the
printing specifications. The ink saving by GCR is ideally 20% based on the GCR press
run experiment. The ink cost saving by GCR is approximately 0.4% to 1% of the total job
cost. In conclusion, the ink cost saving in offset printing will be very dependent on the
print volume. Overall, GCR’s ink cost saving effect on offset jobs is limited because the
41
For other print methods, such as wide format UV printer, ink cost can be one of the major
factors relative to the total printing cost. Because only certified brand ink can be used on
the printer, consumers usually have to pay more for proprietary inks. In this case, the ink
saving by GCR is very meaningful and deserves further research. GCR also deserves
further research in gravure and flexography printing, since these two methods are
frequently used in package printing, meaning high volume and repeated print runs.
PRELIMINARY BIBLIOGRAPHY
Alwan Color Expertise. (2008). Alwan CMYK Optimizer v.3.5 Manual. Available at
http://www.alwancolor.com/download/documenttation/cmyk_optimizer/CMYKOptimize r_Manual.pdf
Anon. (2009, February). Economic font: new cost effective font. Aktuel Gr. Inf, (469), 7.
Benton, P. (2009, July/August). Cutting remarks: cutting the cost of ink usage. Print Pap.Mon, 22(4), 17. Abstract obtained from Print Pap. Mon. adopting a good inking strategy can reduce costs and waste.
Chung,R.(1999). Color Management Systems, A Panel Discussion, 1999 TAGA
Proceedings, p.623 – 628
Chung, R. & Yoshikazu S. (2001). Quantitative Analysis of Pictorial Color Image
Difference. 2001 TAGA Proceedings, p.381-398.
Chung, R. (2002). Color Management Systems: Foundations for Success. Instant & Small
Commercial Printer, p. 24-26; 56.
Neumann, E., Radencic, G., & Bohan, M. (2008). An Evaluation of Different Strategies for Ink Savings on Press. Retrieved from PIA/GATA website: http://www.printing.org
French Paper and Printing Engineering School. (2006/2007). Use of Device Link Profiles for Graphic Arts Industry. Available at
http://www.alwancolor.com/images/accueil/Dynamic_DVLP_complete_report_c3.pdf
Gross, K. (2009, August). Sustainable best practices: growth of sustainability in screen printing (2009). Screen Print, 99(8), 20-22, 24. Abstract obtained from Sustainable best practices: growth of sustainability in screen printing (2009).
Heidelberg. (n.d.). Generation and Application of DeviceLink Profiles, part of publication series Prinect Color Solution-User Guide. Available at http://
www.heidelberg.com/wwwbiaries/bin/files/dotcom/en/prinect/device_link_profile.pdf
43
Meade, R. (2005, June). Stochastic screening without a dedicated Rip: new software eliminates RIP process. Print World, 290(9), 14.
Ploumidis,D. (2005). Device Link Profiling. Test Targets 5.0, p18-25
Ruggles, P. K. (2008). Printing estimating : costing and pricing print and
digital media (5th ed.). Pittsburgh, PA: PIA/GATFPress.
Starr, B. (2005). Device Link Profiles/Repurposing CMYK. Retrieved March, 2009, from
Progressive Color Media LLLC website:
http://www.impressed.de/t/TECHINFOS/CMYK_Optimizer/ PCM_report_DeviceLink.pdf
Appendix A Test Form
Test form for calibration and characterization run
45
Appendix B Press Run Organizer
!"#$$%&'(#)% !"*+#,(%&#$,"-.(-*/)% !"#$"%&'()*)%+$ !"*+#,(%,*/(',()% 0#1#.2*/#%3*)% 45464746489: 0*&';<$%&'(#=(->#)% ?*@%A.#,-B-,'(-*/$ !CD!CDAA !"-/(%*/%@*(2%$-&#$
A-E/'(F"#%,*/(#/($)% G$##%&#$,"-.(-*/%'(%"-E2(H Form_1 & 2: Same contents, differnet GCR levels
I>'E#%"#$*1F(-*/)% :99%..-J*1*"%,*/("*1%@'")% CI0%J*1*"%J*/("*1%K'" !CLLM N'/FB',(F"#")% O! K"'/&)% P#$-E/+#(%4499%.$%GJ*/(#/(%*/1;H CI!=!QR0D S*&'T%!"-/#"E;%7U%VW4%1.-%RN N'/FB',(F"#")% S*&'T%XQM
Y799%&.-K"'/&)% S!ZGVY>-1HU%(2#">'1%Z*1& !CDAA N'/FB',(F"#")% ZLAA%[#@%*BB$#(%."#$$ K"'/&)% ZLAA%AF/&';%Y999 A-\#%G>']H)% 4W^U%C#.#'(%1#/E(2)%YY_W4^ ML`30RI3%ALQ<3 N'/FB',(F"#")% R/,2*" K"'/&)% aY997W%D>#"'1&%!"#>-F> .O=J*/&F,(-b-(;)% .O%7_9%@FBB#"#&U%J*/&F,(_%:949 KQR3SD0
N'/FB',(F"#")% P';%I/(#"/'(-*/'1 _ K"'/&)% Z'.1#$$%:999 J*>.1-'/,; G0*.H%S7Wc%J7:c%N74c%d7: I3S N'/FB',(F"#")% M1-/( 3*(#)% O#'($#( 0#>.=0',T !R!DC K"'/&)% X#"$* %K'$-$%[#-E2%=%A-\#) eF'/(-(;) ,$(%--* !CI30I3Z C#B#"#/,#)%IAL%VYf7W6Y I/T6&*[/%$#gF#/,#)% SJNd%
P#/$-(;%R->%!*-/( ./$0123 4/$0153
G0*1_)%4 D'@H "/0163 7/$8193 %TVI at 50% dot area: .:$0; 4:$05
(Tol: 4%)":$05 7:$05 Print Speed 0<,88$=>?&)+
eF'/(-(;)% V99c999%->."#$$-*/$%.#"%"F/ GA##%/#](%('@%B*"%-/T%'/&%.'.#"%#$(->'(#_H