Int. J. Electrochem. Sci., 14 (2019) 861 – 874, doi: 10.20964/2019.01.71
International Journal of
ELECTROCHEMICAL
SCIENCE
www.electrochemsci.org
New sensor based on AgCl containing Iron Oxide or Zinc Oxide
Nanoparticles for Chloride Determination
Ante Prkić1,*, Tina Vukušić2, Ivana Mitar3, Josipa Giljanović1, Vesna Sokol4, Perica Bošković3,
Miće Jakić5, Andrea Sedlar1
1 Department of Analytical Chemistry, Faculty of Chemistry and Technology, University of Split,
Ruđer Bošković 35, 21000 Split, Croatia.
2 Faculty of Chemistry and Technology, University of Split, Ruđer Bošković 35, 21000 Split, Croatia. 3 Department of Chemistry, Faculty of Science, University of Split, Ruđer Bošković 33, 21000 Split,
Croatia.
4 Department of Physical Chemistry, Faculty of Chemistry and Technology, University of Split, Ruđer
Bošković 35, 21000 Split, Croatia.
5 Department of Organic Technology, Faculty of Chemistry and Technology, University of Split,
Ruđer Bošković 35, 21000 Split, Croatia.
*E-mail: prkic@ktf-split.hr
Received: 13 September 2018 / Accepted: 23 October 2018 / Published: 30 November 2018
This work describes preparation and application of “homemade” chloride ISE enriched with iron oxides or zinc oxide nanoparticles. The prepared chloride ISE membrane was made of AgCl:Ag2S:PTFE =
1:1:2 and AgCl:Ag2S:PTFE = 2:1:2 enriched with mentioned nanoparticles in ratio 0.5-1.2 wt.%.
Prepared membranes were used for chloride determination in perchloric acid (pH = 0-2) and acetic buffer (pH = 4 – 4.75). Due to the low method price, simplicity and a reasonably fast way of usage, it was considered as a possibility for chloride determination in high acid media. Two of prepared membranes (M1 and M4) have shown best characteristics. M1 showed linear response range for chloride between 2.0×10⁻⁶ and 1×10⁻¹ mol L−1, with a detection limit of 2.24×10⁻⁶ mol L−1 and potential change of 44.39 mV per decade. M4 showed linear response range for chloride between 4.2×10⁻⁶ to 1×10⁻¹ mol L−1, limit of detection of 1.39×10⁻⁶ mol L−1 with potential change of 24.79 mV per decade at pH = 0.
Keywords: chloride, potentiometric, determination, “homemade” ion-selective electrode, nanoparticles
1. INTRODUCTION
proposed methods are generally those for determination of certain cationic quaternary ammonium slats or compounds containing chloride, e.g. cetylpyridinium chloride [3], benzalkonium chloride [8] or chlorpromazine [5, 10]. Interest for above mentioned cationic quaternary ammonium slats is related to their positive effects to human health, e.g. chlorpromazine is used for treatment of migraine, antipyschotic, porphyria and tetanus [5, 10]. In contrast, benzalkonium chloride is used in eye and ear drops as preservative and in elevated concentrations, above of 0.01%, can cause permanent damage to the corneal endothelium and it should be controlled benzalkonium chloride levels in such pharamceuticals [8]. The described and used newly prepared sensors are mainly based on the use of various ionophores, e.g. E-N'-(2-hydroxy-3-methoxybenzylidene) benzohydrazide, in a PVC plasticizer [9]. All sensors have common disadvantages: relatively short life time (maximum 60 days) and the price of the ionophore used in the preparation of the sensor. Other papers describe the implementation of well-known commercial chloride ion-selective electrodes (ISE) in Flow-Injection Systems [3, 4, 13]. Generally, it could be stated there is very few papers describing a new solid state potentiometric sensors. Solid state sensors have advantage of simple use and application as well as longer life time in comparison of screen-printed electrodes or ones made of various ionophores.
The work presented here is continuation of our efforts in improvement of both new suitable potentiometric sensors [14] and methods [15-18] suitable for wide application. As regards to the period of membrane preparation and testing, our aim was to make a simple sensor for everyday use, low-cost and reasonably fast. On the other hand, we made a step in a new direction by adding nanoparticles (NPs) of iron oxides (FexOy) or ZnO. We expected that adding FexOy or ZnO NPs would have an impact on
selectivity of our membranes as well as make a possible determination of lower chloride concentrations. In the end it could be stated that we have succeeded. All needed chemicals (AgCl+Ag2S) and
FexOy nanoparticles were synthesized in our laboratory by using commercially available chemicals.
2. EXPERIMENTAL 2.1. Reagents and chemicals
All needed solutions were prepared by solving certain amount of solid chemicals in supra pure water. Supra pure water (declared conductivity 0.04 μS cm−1) was prepared by Millipore Simplicity (USA).
The following chemicals were used: Sodium nitrate, NaNO3, p.a., Sodium acetate, CH3COONa,
p.a., Acetic acid, CH3COOH, p.a., Potassium iodide, KI, p.a., Silver nitrate, AgNO3, p.a., Sodium
sulphide, Na2S, p.a., Iron(III) chloride, FeCl3×6H2O, p.a., Perchloric acid, HClO4, p.a. Kemika (Croatia)
and sodium dodecyl sulfate (SDS) Alfa Aesar (USA). All used solutions were prepared by dissolving a required quantity of substance in perchloric acid (pH = 0-2) and acetic buffer (pH = 4-4.75), respectively. Ionic strength of solutions was adjusted at 0.5 M by adding NaNO3, except perchloric acid pH = 0
because its ionic strength was 1.0 M.
2.2. Preparation of iron oxide nanoparticles
The composition of all samples S1-S5 is given in Table 1.
Samples S1, S2 and S3 were autoclaved at 160 °C using a teflon-lined, non-stirred pressure vessel manufactured by Berghof (model DAP-60K). The autoclaves were heated 24 hours in an oven at a temperature of 160 °C (Memmert, model ULM 400; temperature uniformity ±1.9 °C at 100 °C and ±3 °C at 200 °C). The autoclaving times were corrected for the time needed for the autoclave to reach the predetermined temperature. After autoclaving, the autoclaves were abruptly cooled with cold water.
Samples S4 and S5 were heated in a microwave oven using a teflon-lined, non-stirred pressure vessel manufactured by Berghof (model DAP-60K). The samples were heated for 30 min in a Speedwave MWS-2 microwave oven (Berghof, 2.45 MHz, maximum power 1000 W) at a temperature of 160 °C. After heating, the autoclaves were left in microwave system for 3-6 hours.
The mother liquor was separated from the precipitate with the laboratory centrifuge (Heraeus, model Biofuge primo R). The separated precipitates were subsequently washed with supra pure water and once with C2H5OH, then dried.
Table 1. Experimental conditions for the preparation of samples S1 to S5.
Sample V(1 M FeCl3)/mL V(H2O) /mL m(SDS)/mg c(FeCl3)/M
S1 2 38 50 0.05
S2 2 38 200 0.05
S3 4 36 50 0.10
S4 2 38 100 0.05
S5 4 36 50 0.10
SDS – sodium dodecyl sulfate
[image:3.596.182.422.513.737.2]FT-IR spectra were recorded at RT with a Shimadzu spectrometer (model 8400S). The powders were mixed with KBr, then pressed into tablets using the Carver press.
Figure 1 shows the FT-IR spectra of samples S1 and S3 prepared by forced hydrolysis of 0.05 M and 0.1 M FeCl3 solution with addition of SDS by hydrothermal method of synthesis. The FT-IR
spectrum of sample S1 is characterized by a band at 562 and 480 cm-1. These IR bands could be asscribed to a hematite phase (α-Fe2O3). The FT-IR spectrum of sample S3 shows IR bands at 569 and 482 cm-1
which can be assigned to α-Fe2O3 as well. Normally, bands at ~557 and 485 cm-1 are used for
identification of hematite phase, but IR spectrum of α-Fe2O3 is influenced by shape of the particles as
published by Serna and Iglesias [20]. The IR band at 912 cm-1 that can be observed at the sample S3 can be present in α-Fe2O3 precipitated in aqueus media, due to nonstochiometry (the presence of OH groups
in the structure) [21]. In spectra of S3 sample, a very small band at 800 cm-1 can be noticed which can refer to a very small amount of goethite phase (α-FeOOH).
The IR bands at 1213, 1128, 1040 and 964 cm-1 at the sample S1 and bands at 1223, 1134, 1035 and 975 cm-1 at S3 sample can be associated with the sulfate groups that can be related with the SDS sulfate employed. The 3(SO4) fundamental vibration split into 3 active IR bands due to the formation
of a bidentate bridging complex between the sulfate group and iron. The IR band at ~969 cm-1 can be associated with the ν1(SO4) vibration [22]. Two IR bands with very low intensity at spectra of S1 sample
at ~2960 and 2925 cm-1 can be due to an organic chain of SDS molecule [23].
IR spectra of S1 sample show a broad band at wave number ~3420 cm-1. That band can be assigned to stretching modes of surface H2O molecules or to the hydrogen bonded surface OH groups
[24].
[image:4.596.113.490.444.717.2]The peaks positioned at ~1620 or 1625 cm-1 can be assigned to hydroxyl bending vibrations of absorbed water. The two peaks at ~2360 cm-1 are due to O=C=O of CO2 in air.
Figure 2 shows the FT-IR spectra of sample S2 prepared at the same synthesis route as samples S1 and S3 but with and addition of a larger amount of SDS as presented in Table1. These spectra of S2 sample are typical for goethite phase (α-FeOOH). The strong and sharp bands observed at 892 and 794 cm-1 can be assigned to the Fe-O-H vibrations and are characteristic of goethite. The mode at 894 cm-1 is assigned to in-plane deformation (δ) modes of hydroxyls and the mode at 796 cm-1 corresponds to out-of-plane deformation (γ) modes [25]. These IR bands are generally used for identification of goethite in phase analysis. The prominent IR bands at 578 and 452 cm-1 can be assigned to ferrihydrite or amorphous iron(III)-hydroxide [26, 27]. The IR bands at 1212, 1129, 1035 and 970 cm-1 can be associated with the
sulphate groups that can be related with the SDS as in the previous examples of the samples S1 and S3 as well as the weak band at 2925 cm-1.
[image:5.596.109.497.304.716.2]The band at 3100 cm-1 can be attributed to OH stretching vibrations in the goethite structure [28]. A less intense band at 3400 cm-1 can be attributed to the physically adsorbed water or as well the peak positioned at 1640 cm-1. The two peaks at ~2350 cm-1 are due to CO2 in air.
Figure 3 shows IR spectra of samples S4 and S5 prepared by microwave synthesis of iron oxides nanoparticles from 0.05 and 0.1 M FeCl3 solutions with addition of a certain amount of SDS as shown
in Table 1.
The spectrum of samples S4 and S5 is characterized by IR bands at 845 and 681 cm-1. These
bands can be assigned to akaganeit phase (β-FeOOH). Vibrations near 820 cm-1 that can be seen in
spectra of sample S4 and band at 845 cm-1 in both described samples can be due to O-H ····Cl hydrogen bonds present in a structure of akaganeit [29, 30].
Transmittance spectra of akaganeite include strong vibrational bands due to H2O stretching near
3484 and 3388 cm-1, due to H2O bending near 1628 cm-1 [31]. These bands are well-noticeable at FT-IR
spectra of samples S4 and S5.
The IR bands at 2960, 2925, 1200, 1129, 1058 and 975 cm-1 are present in FT-IR spectra of both samples, S4 and S5. These bands can be ascribed to the sulfate groups as in other samples as well as the two peaks at ~2350 cm-1 due to CO2 in air.
2.3. Preparation of membranes and potentiometric measurements
Membranes were laid on the multi-purpose solid-state electrode body, as shown in previous study[14]. Precipitation of silver chloride was done in nitric acid in order to prevent silver ions reduction. After the precipitation of silver chloride and silver sulfide, proper quantities were weighted and mixed with PTFE and FexOy or ZnO NPs in powder homogenizer. Membranes had mass of 0.5000±0.0005 g.
Prepared powders for membranes were put in a press for 1 h at 740 MPa [14]. Membranes’ composition was given in Table 2 and Table 3.
Table 2. Weight ratio of added FexOy nanoparticles per membrane
Membrane label Weight ratio of FexOy nanoparticles, % FexOy type
M1 0.9 S1
M2 1.2 S2
M3 0.5 S3
M4 0.7 S3
M5 0.5 S4
M6 1.0 S4
M7 1.2 S4
M8 0.4 S5
M9 0 -
Table 3. Weight ratio of added ZnO nanoparticles per membrane
Membrane label Weight ratio of ZnO nanoparticles, %
Membrane composition, AgCl:Ag2S
M10 0.2 1:1
M11 0.4 1:1
M13 0.8 1:1
M14 1.0 1:1
M15 1.2 1:1
M16 0.2 1:2
M17 0.4 1:2
M18 0.6 1:2
M19 0.8 1:2
M20 1.0 1:2
M21 1.2 1:2
M22 0 1:2
The reference electrode was an Orion 90-02 double junction reference electrode (Orion, USA). Potentiometric data were recorded at constant temperature in thermostated vessel with a millivoltmeter (SevenExcellence™, Mettler-Toledo, Switzerland-USA) coupled to a personal computer by USB cable and data were recorded by using LabX direct pH 3.3 (Mettler-Toledo, Switzerland-USA). The uncertainty in potential measurements was ±0.0001 V.
3. RESULTS AND DISCUSSION
Due to the new method of preparation, “homemade” chloride ISEs has been tested for response to both silver and chloride concentration by standard dilution method at pH = 0-2 (pechloric buffer) and pH = 4-4.75 (acetic buffer). Due to the possibility of iron hydrolyzation pH > 2, membranes containing FexOy nanoparticles were tested only at pH = 0-2. During measurement, solution was stirred and kept at
[image:7.596.125.474.500.738.2]constant temperature of 25 °C. Results are shown in Figures 4-6. It should be mentioned that in Figures 4-6 responses of certain membranes were given since others did not show acceptable response.
[image:8.596.61.548.440.723.2]
Figure 5.Response of “homemade” chloride ISE to chloride ions, pH=1
Points in Figures 4-6 represent experimental data while straight lines were calculated by using linear regression built in Microsoft Excel® 2016. Newly prepared membrane, made of pressed pellet consisting of Ag2S, AgCl and PTFE, linearly follows changing of Cl− concentration in concentration
range of at least four magnitude of order. Stable potential was reached in 35-40 seconds. It should be mentioned that there has not been any response to silver ions of either membranes M1-M22. We assume this phenomenon was caused by charging membrane with positive charge. Positively charged membranes resulted from the loss of oxide or hydroxide ions from FexOy and ZnO NPs. The loss had
occurred during reaction with H+ ions from strong acid media. Therefore, we did not test the response
of commercially available electrode (Orion, USA).
[image:9.596.51.548.300.405.2]In Table 3-5 linear response range, limit of detection, slope and coefficient of regression are given.
Table 3. Characteristics of membranes with best response, pH = 0.
Number Linear response range (M) Detection limit (M) Slope (mV/dec) R2
M3 1.6×10⁻⁵ – 1×10⁻¹ 4.22×10⁻⁶ 40.43 0.9951
M4 4.2×10⁻⁶ – 1×10⁻¹ 1.39×10⁻⁶ 24.79 0.9971
M9 8×10⁻⁴ – 1×10⁻¹ 4.22×10⁻⁴ 35.75 0.9636
M22 9×10⁻⁴ – 1×10⁻¹ 4.62×10⁻⁴ 94.00 0.9837
The best response to chlorides in very strong acidic medium gave membrane M4. Slope of membrane M4 is close to those for divalent ions (~29 mV/dec). This could be explained on the basis of formation of complex FeCl2+. Complex was created after iron oxide particles had been exposed to H+ in perchloric acid. M4 showed good characteristics with stretching linear response range by one magnitude of order and detection limit, respectively. Life time of M4 was proven to be 4 months. Since the commercially available electrode showed poor response, its response has not been drawn. On the other hand, according to manual electrode, it is suitable for measurements from pH 2 to 12.
Table 4. Characteristics of membranes with best response, pH = 1.
Number Linear response range (M) Detection limit (M) Slope (mV/dec) R2
M3 4.5×10⁻⁵ – 1×10⁻¹ 2.00×10⁻⁵ 35.44 0.9921
M4 8.0×10⁻⁶ – 1×10⁻¹ 4.94×10⁻⁶ 38.61 0.9880
M9 2.6×10⁻³ – 1×10⁻¹ 5.42×10⁻⁴ 93.00 0.9834
M14 1.9×10⁻⁴ – 1×10⁻¹ 7.96×10⁻⁵ 63.36 0.9921
M18 4.6×10⁻⁵ – 1×10⁻¹ 2.00×10⁻⁵ 55.18 0.9913
CE* 3×10–6 – 1×10⁻² 1.78×10⁻⁶ 54.93 0.9972
At pH = 1 the number of newly prepared membranes increased to five. The best response was given by M18. Lifetime of M18 was about 2.5 months. Slope of M4 increased about 50% in experiments at pH = 1. Possible reason is the existence of significant amount of both FeCl2+ and FeCl2+ in the solution.
[image:10.596.50.553.209.384.2]Among all tested membranes and a commercially available electrode the best response had the commercially available electrode.
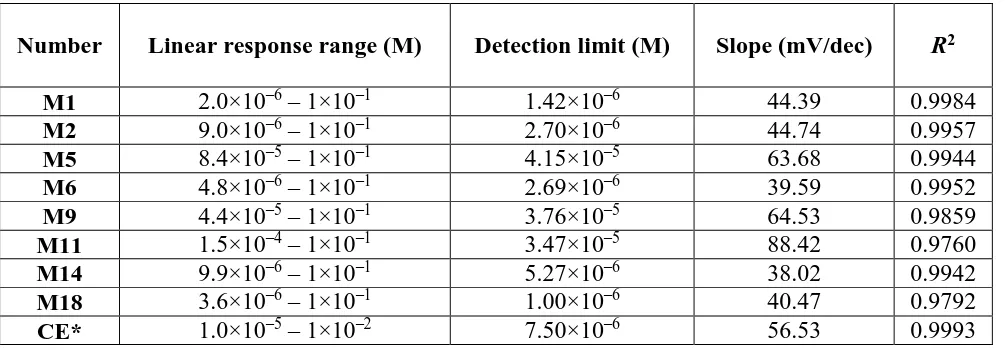
Table 5. Characteristics of membranes with best response, pH = 2.
Number Linear response range (M) Detection limit (M) Slope (mV/dec) R2
M1 2.0×10⁻⁶ – 1×10⁻¹ 1.42×10⁻⁶ 44.39 0.9984
M2 9.0×10⁻⁶ – 1×10⁻¹ 2.70×10⁻⁶ 44.74 0.9957
M5 8.4×10⁻⁵ – 1×10⁻¹ 4.15×10⁻⁵ 63.68 0.9944
M6 4.8×10⁻⁶ – 1×10⁻¹ 2.69×10⁻⁶ 39.59 0.9952
M9 4.4×10⁻⁵ – 1×10⁻¹ 3.76×10⁻⁵ 64.53 0.9859
M11 1.5×10⁻⁴ – 1×10⁻¹ 3.47×10⁻⁵ 88.42 0.9760
M14 9.9×10⁻⁶ – 1×10⁻¹ 5.27×10⁻⁶ 38.02 0.9942
M18 3.6×10⁻⁶ – 1×10⁻¹ 1.00×10⁻⁶ 40.47 0.9792
CE* 1.0×10–5 – 1×10⁻² 7.50×10⁻⁶ 56.53 0.9993
*commercially available electrode, Orion 9417BN
When conducting experiments at pH = 2, we realized there was an increase in the number of satisfying membranes. The best membrane was found to be M1. M1 showed a linear response range of five magnitudes of order and limit of detection 1.42×10⁻⁶ M. Its slope could be explained by creation of both FeCl2+ and FeCl
2+ in solution. Lifetime of membrane M1 was about 3 months. Although
commercially available electrode had a longer lifetime (approximately a year, according to manuals) and slope very close to Nerstian one, our M1 showed the possibility of determining up to 10 times lower chloride concentrations than commercially available electrode. M9 is a membrane consisting only of Ag2S, AgCl and PTFE. We prepared it to make comparison between our membranes and commercially
available electrode easy. Commercially available electrodes should have membranes of Ag2S and AgCl.
Since M9 showed supernerstian slope (93.00 and 64.53 mV dec-1, respectively), we assume that PTFE
added in our case may cause unwanted response. On the other hand, correlation coefficients in all cases were below 0.9900, so our conclusion should be thoroughly examined in further studies.
When the influences of FexOy and ZnO NPs were compared, a significantly better response of
membranes containing FexOy NPs could be observed. Both M1 and M4 contained mainly hematite in
FexOy NPs as shown in Figure 1 and described previously in the text. On the other hand, the impact of
ratio of FexOy NPs in membranes was not observed. Since all FexOy NPs contained a certain crystal
structure with Fe3+, we assumed that Fe3+ would make a complex with Cl- according literature [32]. This complex equilibria between Fe3+ and Cl- benefited membranes by increasing their selectivity and
and retracted cations from solutions. Although, this phenomenon was not observed for ZnO NPs in this study, ZnO NPs improved other membranes [18] and definitely could be useful.
Hence, membranes M1-M22 did not show satisfying response to chloride nor to silver ions at pH= 4 and 4.75, therefore, no graphical presentations were given.
[image:11.596.115.483.187.429.2]After finishing laboratory work, the best of new membranes, M4, was analyzed by using SEM, Figure 7 and 8.
Figure 7. SEM image of M4 in cross section
[image:11.596.116.482.481.719.2]
In Figure 7 it could be seen that all nanoparticles were at both surfaces, not spread in whole membrane volume. The hole in Figure 8 is the result of membrane use. During the use, membranes were exposed to friction with stainless part of the electrode body and to perchloric acid. Use over longer period of time would undoubtedly reduce membrane lifetime due to use of force required for screwing and would lead to breaking.
[image:12.596.46.550.232.411.2]Recently, only a handful of papers noteworthy to a comparison could be found in the literature. Papers in Table 6 describe potentiometric determination of chloride.
Table 6. Comparison of similar sensor with ones proposed in this work for chloride determination
Reference Limit of detection/mol L−1 Linear range/mol L−1 pH
This work M4 1.39×10⁻⁶ 4.2×10⁻⁶ – 1×10⁻¹ 0-1
This work M1 1.42×10⁻⁶ 2.0×10⁻⁶ – 1×10⁻¹ 2
[2] 8.00×10⁻⁷ 1.0×10⁻⁶–1.0×10⁻² 2-8
[20] N/A 1.4×10⁻⁶–2.8×10⁻¹ 4-12
N/A – not available
By comparing data given in Table 6, it could be seen that our sensors have very similar limit of detection and linear range. The main advantage of our sensors is their possible application in high acid media. Lifetime for sensors described in literature [2, 33] was not given, therefore such comparison was not possible. On the other hand, our sensors are very simple and there is no need for complicating synthesis [2] or using very complex system[33].
4. CONCLUSIONS
In this work were described “homemade” chloride ion-selective electrode (ISE) enriched with both FexOy and ZnO nanoparticles were described. The preparation of FexOy NPs was done in our
laboratory. Characterization of FexOy NPs was done in our laboratory by using FTIR. On the other hand
ZnO NPs were purchased. Our experiments indicated better response of membranes containing FexOy
NPs. Positive effects were stretching linear response range and decreasing both limit of detection and limit of quantification for 10 times in comparison to commercially available chloride ISE. The two proposed membranes (M1 and M4) could be applicable for chloride determination. M1 has linear response range c(Cl-) = 2.0×10⁻⁶ – 1×10⁻¹ mol L−1, with potential change of 44.39 mV per decade of
range c(Cl-) = 4.2×10⁻⁶ – 1×10⁻¹ mol L−1, with potential change of 24.79 mV per decade of chloride concentration and limit of detection of 1.39×10⁻⁶ mol L−1 at pH = 0.
ACKNOWLEDGEMENT
The authors are grateful to Prof. Vladimir Srdić, PhD, and Miloš Bokorov, PhD, of University of Novi Sad for making SEM images.
This work has been supported by the Croatian Science Foundation, project number UIP-2017-05-6282.
References
1. U. Angst, B. Elsener, C.K. Larsen and O. Vennesland, J. Appl. Electrochem., 40 (2010) 561. 2. G.G. Mohamed, T.A. Ali, M.F. El-Shahat, A.M. Al-Sabagh, M.A. Migahed and E. Khaled, Anal.
Chim. Acta, 673 (2010) 79.
3. S.A.A. Almeida, T.S.C.R. Rebelo, A.M. Heitor, M.B.P.P. Oliveira and M.G.F. Sales, Curr. Anal. Chem., 6 (2010) 277.
4. D.J. Delport, S.S. Potgieter-Vermaak, R.I. McCrindle and J.H. Potgieter, S.-Afr. Tydskr. Chem. SA J. Chem., 64 (2011) 251.
5. M.A. Abounassif, M.M. Hefnawy, M.M. Hassanien and G.A.E. Mostafa, Sens. Lett., 10 (2012) 966.
6. A.A. El-Sherif, J. Solution Chem., 41 (2012) 392. 7. M. Berger, J. Chem. Educ., 89 (2012) 812.
8. M. Gaber, H.M. Abu Shawish, A.M. Khedr and K.I. Abed-Almonem, Mat. Sci. Eng. C-Mater., 32 (2012) 2299.
9. S. Tajik, M.A. Taher and I. Sheikhshoaie, J. AOAC Int., 96 (2013) 204. 10.L.A. Al-Shatti, Indian J. Chem. Technol., 20 (2013) 265.
11.M.A. Bagherini and M. Pournaghdi, J. Mol. Liq., 199 (2014) 339.
12.W. Bolong, Z. Fengxia, M. Xiaoning, Z. Fengjuan and S.L. Brunelle, J. AOAC Int., 99 (2016) 198. 13.T.A. Ali, G.G. Mohamed, M.M. El-Dessouky and R.M. Ragheb, Int. J. Electrochem. Sci., 10
(2015) 4820.
14.A. Prkić, J. Giljanović and M. Bralić, Int. J. Electrochem. Sci., 6 (2011) 5388. 15.J. Giljanovic and A. Prkic, Molecules, 15 (2010) 100.
16.M. Bralić, A. Prkić, J. Radić and I. Pleslić, Int. J. Electrochem. Sci., 13 (2018) 1390.
17.T. Vukusić, A. Prkić, J. Giljanović, V. Sokol and P. Bošković, Croat. Chem. Acta, 88 (2015) 255. 18. A. Prkić, T. Vukusić, J. Giljanović, V. Sokol, P. Bošković, M. Lučić Lavčević, I. Mitar and M. Jakić,
Int. J. Electrochem. Sci., 13 (2018) 10894. doi: 10.20964/2018.11.92.
19.M. Ristić, J. Štajdohar, I. Opačak and S. Musić, Contributions, Section of Natural, Mathematical and Biotechnical Sciences, 38 (2017) 57.
20.J. Iglesias and C. Serna, Miner. Petrogr. Acta, 29 (1985) 363. 21.M. Žic, M. Ristić and S. Musić, J. Alloys Compd., 466 (2008) 498.
22.D. Peak, R.G. Ford and D.L. Sparks, J. Colloid Interface Sci., 218 (1999) 289. 23.M. Ristić, S. Musić and M. Godec, J. Alloys Compd., 417 (2006) 292.
24.S. Krehula and S. Music, J. Alloys Compd., 416 (2006) 284.
25.H. Ruan, R. Frost and J. Kloprogge, Spectrochim. Acta, Part A, 57 (2001) 2575.
26.M. Ristić, E. De Grave, S. Musić, S. Popović and Z. Orehovec, J. Mol. Struct., 834 (2007) 454. 27.U. Schwertmann, J. Friedl and H. Stanjek, J. Colloid Interface Sci., 209 (1999) 215.
28.M. Gotić and S. Musić, J. Mol. Struct., 834 (2007) 445.
31.E. Murad and J.L. Bishop, Am. Mineral., 85 (2000) 716.
32.V.N. Misra, S.C. Das and T. Subbaiah, International Conference on Emerging Trends in Mineral Processing and Extractive Metallurgy, Allied Publishers, (2005) New Delhi pp.341.
33.G. Chango, E. Palacio and V. Cerda, Talanta, 186 (2018) 554.