This is a repository copy of
High Throughput Computation of Reference Ranges of
Biventricular Cardiac Function on the UK Biobank Population Cohort
.
White Rose Research Online URL for this paper:
http://eprints.whiterose.ac.uk/145281/
Version: Accepted Version
Proceedings Paper:
Attar, R, Pereañez, M, Gooya, A et al. (6 more authors) (2019) High Throughput
Computation of Reference Ranges of Biventricular Cardiac Function on the UK Biobank
Population Cohort. In: Lecture Notes in Computer Science. MICCAI Medical Image
Computing and Computer Assisted Interventions, 16-20 Sep 2018, Granada, Spain.
Springer Verlag , pp. 114-121. ISBN 9783030120283
https://doi.org/10.1007/978-3-030-12029-0_13
© Springer Nature Switzerland AG 2019. This is an author produced version of a paper
published in Lecture Notes on Computer Science. Uploaded in accordance with the
publisher's self-archiving policy. The final authenticated version is available online at:
https://doi.org/10.1007/978-3-030-12029-0_13
[email protected] https://eprints.whiterose.ac.uk/
Reuse
Items deposited in White Rose Research Online are protected by copyright, with all rights reserved unless indicated otherwise. They may be downloaded and/or printed for private study, or other acts as permitted by national copyright laws. The publisher or other rights holders may allow further reproduction and re-use of the full text version. This is indicated by the licence information on the White Rose Research Online record for the item.
Takedown
If you consider content in White Rose Research Online to be in breach of UK law, please notify us by
Ranges of Biventricular Cardiac Function on
the UK Biobank Population Cohort
Rahman Attar1
, Marco Perea˜nez1
, Ali Gooya1
, X`enia Alb`a2
, Le Zhang1
,
Stefan K. Piechnik3
, Stefan Neubauer3
, Steffen E. Petersen4
,
Alejandro F. Frangi1
1Center for Computational Imaging and Simulation Technologies in Biomedicine,
Department of Electronic and Electrical Engineering, The University of Sheffield, UK.
2Center for Computational Imaging and Simulation Technologies in Biomedicine,
Universitat Pompeu Fabra, Barcelona, Spain.
3Oxford Center for Clinical Magnetic Resonance Research (OCMR), Division of
Cardiovascular Medicine, University of Oxford, John Radcliffe Hospital, UK.
4Cardiovascular Medicine at the William Harvey Research Institute, Queen Mary
University of London and Barts Heart Center, Barts Health NHS Trust, UK.
Abstract. The exploitation of large-scale population data has the po-tential to improve healthcare by discovering and understanding patterns and trends within this data. To enable high throughput analysis of car-diac imaging data automatically, a pipeline should comprise quality mon-itoring of the input images, segmentation of the cardiac structures, as-sessment of the segmentation quality, and parsing of cardiac functional indexes. We present a fully automatic, high throughput image parsing workflow for the analysis of cardiac MR images, and test its performance on the UK Biobank (UKB) cardiac dataset. The proposed pipeline is ca-pable of performing end-to-end image processing including: data organ-isation, image quality assessment, shape model initialorgan-isation, segmenta-tion, segmentation quality assessment, and functional parameter compu-tation; all without any user interaction. To the best of our knowledge, this is the first paper tackling the fully automatic 3D analysis of the UKB population study, providing reference ranges for all key cardiovas-cular functional indexes, from both left and right ventricles of the heart. We tested our workflow on a reference cohort of 800 healthy subjects for which manual delineations, and reference functional indexes exist. Our results show statistically significant agreement between the manu-ally obtained reference indexes, and those automaticmanu-ally computed using our framework.
1
Introduction
2 R. Attar et al.
care. Thus, mechanisms for early and reliable quantification of cardiac function is of utmost importance.
Analysis and interpretation of cardiac structural and functional indexes in large-scale population image data can reveal patterns and trends across popu-lation groups, and allow insights into risk factors before CVDs develop. UKB is one of the world’s largest population-based prospective studies, established to investigate the determinants of disease.
In terms of population sample size, experimental setup, and quality control, the most reliable reference ranges for cardiovascular structure and function in adult caucasians aged 45-74 found in the literature are those reported in [2]. In [2], cardiovascular magnetic resonance (CMR) scans were manually delineated and analysed using cvi42 post-processing software (Version 5.1.1, Circle Cardio-vascular Imaging Inc., Calgary, Canada). These reference values are used in this paper to validate the proposed workflow.
In this paper, we present a fully automatic 3D image parsing workflow with quality control modules to analyse CMR images in the UKB and corroborate their validity compared to their manual counterpart. The proposed workflow is capable of segmenting the cardiac ventricles and generating clinical reference ranges that are statistically comparable to those obtained by human observers. The main contribution of this paper is in its clinical impact, resulting from the analysis of left ventricle (LV) and right ventricle (RV) of the heart, as well as the extraction of key cardiac functional indexes from large CMR datasets.
2
Methods
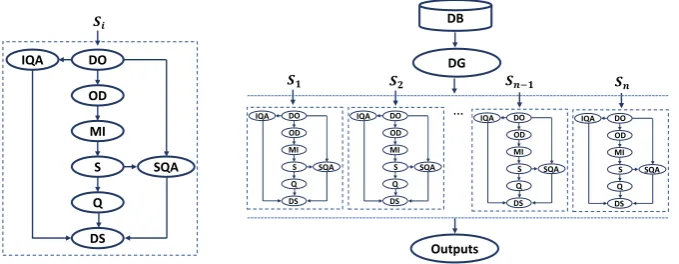
Figure 1 shows the architecture of the proposed workflow addressing the issue of large-scale analysis of CMR images. It consists of eight main modules to analyse every single subject of the database. To create a modular workflow and enable processing multiple subjects in parallel, a workflow manager software package is required. This provides an infrastructure for the set-up, performance and monitoring of a defined sequence of tasks, regardless their programming language. In our implementation, the Nipype package [3] has been used. It allows us to combine a heterogeneous set of software packages within a single and highly efficient workflow, processing several subjects in parallel using cloud computing platforms provided by Amazon (high performance processors and S3 storage services).
2.1 Data Organisation (DO)
DO
OD
MI
S
Q
DS
SQA IQA
DB
Outputs DG
SQA IQA DO
OD MI S Q DS
SQA IQA DO
OD MI S Q DS SQA IQA DO
OD MI S Q DS SQA
[image:4.595.139.479.124.256.2]IQA DO OD MI S Q DS
Figure 1. The proposed fully automatic image parsing workflow for the analysis of cardiac ventricles in parallel. Left: The workflow includes the following modules: DO: Data Organisation, IQA: Image Quality Assessment, OD: Organ Detection, MI: Model Initialisation, S: Segmentation, SQA: Segmentation Quality Assessment, Q: Quantifi-cation, DS: Data Sink. Right: The quantitative functional analysis of a large database in parallel mode. DB: Database, DG: Data Grabber, n: number of subjects, andSi:i
th subject of the dataset.
identify the data, and enable precise accessibility and data retrieval. Each sub-ject’s DICOM data are organised according to cardiac cycle phase, and into short axis (SAX) and long axis (LAX) views.
2.2 Image Quality Assessment (IQA)
Low image quality can not be fully avoided, particularly in large-scale imaging studies. To ensure that the quality of collected data is optimal for statistical analysis, having an IQA module is of paramount. This allows the automatic detection of abnormal images, whose analysis would otherwise impair the ag-gregated statistics over the cohort. Since the lack of basal and/or apical slices is the most common problem affecting image quality in CMR images, and has a major impact on the accuracy of quantitative parameters of cardiac function, our IQA module is designed to detect missing apical and basal slices of the CMR input. Thus, every top and bottom short axis view of input image volumes is analysed using two convolutional neural networks, each particularly trained for detection of missing slices in the basal and/or apical positions. The details of the architecture used can be found in [4].
2.3 Organ Detection (OD)
4 R. Attar et al.
In [6], the location of the LV is determined by a rough estimation of the inter-section of slices from different views (SAX and LAX). Then, a Random Forest regressor trained with two complementary feature descriptors (i.e. the Histogram of Oriented Gradients and Gabor Filters) is used to predict the final landmark positions. This method is LV specific and therefore we have extended it to take into account image features corresponding to the RV, and obtain optimal ini-tialisations for biventricular segmentation.
2.4 Model Initialization (MI)
The landmarks obtained in Sec. 2.3 are used 1) to suitably place the initial shape inside the image volume (translation), 2) to scale the initial shape along the main axis of the heart (scaling); and 3) to define the initial orientation of the heart based on the relative position of the mitral valve (rotation). These initial pose parameters are estimated by registering the obtained landmarks to their corresponding points on the mean model shape. As we segment all timepoints in the CINE sequence, we initialise the first image timepoint with the model mean, however, subsequent cardiac phases are initialised with the resulting segmentation from the previous timepoint.
2.5 Segmentation (S)
Cardiac LV and RV segmentation is performed with a modified 3D-SPASM seg-mentation method [5]. The main components of the 3D-SPASM are a Point Dis-tribution Model (PDM), an Intensity Appearance Model (IAM), and a Model Matching Algorithm (MMA).
In this work, the PDM is a surface mesh representing the endocardial and epicardial surfaces for the LV and the endocardial surface for the RV. The PDM is built during training by applying Principal Component Analysis to a set of aligned shapes and maintaining eigenvectors corresponding to a predefined per-centage of shape variability. The learned shape variability can be modeled as
ˆ
x=x¯+Φbwhere ˆx is a shape model instance,x¯is the mean shape,Φ is an
eigenvector matrix andbis a vector of scaling values for each principal
compo-nent. By modifying b, we can generate shapes from the shape distribution.
The IAM is trained by learning the graylevel intensity distribution along perpendiculars to boundary points on the cardiac shape. An appearance mean
and covariance matrix{g¯,Σgg} is computed for each landmark by sampling the
intensity around each point over the image training set.
The last element of the segmentation process is the MMA, whose role is iterating between finding the optimal location of boundary points by distance minimisation between sampled image profiles and the IAM, and projection of these points onto the valid shape space defined by the PDM.
2.6 Segmentation Quality Assessment (SQA)
to automatically detect incorrect results, either to reprocess those images, or disregard them. This becomes even more important when automated segmenta-tion methods are applied to large-scale datasets, and the segmentasegmenta-tion results are to be used for further statistical population analysis [7]. In our pipeline we incorporate the SQA proposed in [6]. The SQA uses Random Forest classifiers trained on intensity features associated to blood pool and myocardium, and is able to detect successful segmentations.
2.7 Quantification (Q)
After successful SQA, we compute a thorough set of functional parameters based on blood-pool and myocardial volumes. To reproduce the reference ranges re-ported in [2], our quantification module performs volume computations using the Simpson’s rule. The principle underlying this method is that total volume can be approximated by the summation of stacks of elliptical disks.
3
Experiments and Results
We use the same dataset exploited in [2], and evaluate the performance of the proposed automatic workflow in two ways: 1) applying common metrics for seg-mentation accuracy assessment i.e., Dice Similarity Coefficient (DSC), Mean Contour Distance (MCD) and Hausdorff distance (HD), against ground truth values obtained through manual delineation by clinicians. 2) comparing cardiac biventricular function indexes derived from manual and automatic segmentations such as ventricular end diastolic/systolic volumes and myocardial mass. Addi-tionally, quantitative evaluation of human performance i.e., the inter-observer variability, is measured among the manual segmentations of different clinical ex-perts. A set of 50 subjects was randomly selected and each subject was analysed by three expert observers (O1, O2, O3) independently. We compare the result of segmentation on the same set of subjects to show how close the performance of the automatic segmentation is to human performance and also the performance of the proposed workflow on a large dataset.
6 R. Attar et al.
3.1 Segmentation Accuracy
Table 1 reports mean and standard deviation for DSC, MCD, and HD comparing between automatic and manual segmentations performed on test sets of 50 and 800 subjects never seen before by the PDM and IAM. The set of 50 subjects is the same set used for the evaluation of inter-observer variability. The set of 800 subjects is the same set used to generate reference ranges in [2].
The reported DSC values show excellent agreement (≥0.87) between manual
delineations and automatic segmentations. MCD errors are smaller than the in-plane pixel spacing range of 1.8 mm to 2.3 mm found in the UKB. Although HD is larger than the in-plane pixel spacing, it is still within an acceptable range when compared with the distance range seen between different human observers. Table 1 shows that the segmentation accuracy of our method is within error ranges observed between different human raters. This indicates that our workflow performs with human-like reliability, and can fully automatically segment large scale datasets where manual inputs are infeasible.
Table 1.Segmentation accuracy expressed in terms of DSC, MCD and HD comparing the automatic (Auto.), manual (Man.), and observers (O1-O3) segmentations. LVendo: LV endocardium. LVmyo: LV myocardium, RVendo: RV endocardium. Values
indicate mean±standard deviation.
(a) DSC
O1 vs O2 O2 vs O3 O3 vs O1 Auto. vs Man. Auto. vs Man. (n=50) (n=50) (n=50) (n=50) (n=800) LVendo 0.94±0.04 0.92±0.04 0.93±0.04 0.93±0.03 0.93 ±0.04 LVmyo 0.88±0.02 0.87±0.03 0.88±0.02 0.88±0.03 0.87 ±0.03 RVendo0.87±0.06 0.88±0.05 0.89±0.05 0.87±0.06 0.89 ±0.05
(b) MCD (mm)
O1 vs O2 O2 vs O3 O3 vs O1 Auto. vs Man. Auto. vs Man. (n=50) (n=50) (n=50) (n=50) (n=800) LVendo 1.00±0.25 1.30±0.37 1.21±0.48 1.28±0.39 1.17 ±0.32 LVmyo 1.16±0.34 1.19±0.25 1.21±0.36 1.20±0.34 1.16 ±0.40 RVendo2.00±0.79 1.78±0.45 1.87±0.74 1.79±0.80 1.81 ±0.67
(c) HD (mm)
O1 vs O2 O2 vs O3 O3 vs O1 Auto. vs Man. Auto. vs Man. (n=50) (n=50) (n=50) (n=50) (n=800) LVendo 2.84±0.70 3.31±0.90 3.25±0.96 3.21±0.97 3.21±0.99 LVmyo 3.70±1.16 3.82±1.07 3.76±1.21 3.91±1.20 3.92±1.30 RVendo7.56±5.51 7.35±2.19 7.14±2.20 7.41±4.11 7.31±3.32
3.2 Estimation of Cardiac Function Indexes
from automated segmentation and compare them to measurements from manual segmentation.
Table 2 shows excellent agreement between the mean and standard devia-tion of ventricular parameters of a healthy populadevia-tion obtained through both automatic and manual segmentations. Furthermore, we performed two-sample Kolmogorov-Smirnov (K-S) tests to show that ventricular parameters obtained through manual and automatic approaches are drawn from the same population, under the null hypothesis that the manual and automatic methods are from the same continuous distribution in terms of clinical indexes. K-S test on different indexes does not reject the null hypothesis of being from same distribution at the 5% significance level.
Table 2.Cardiac function indexes derived from manual (Man.) vs automatic (Auto.) segmentation on 779 subjects. Values indicate mean±standard deviation.
LVEDV (ml) LVESV (ml) LVSV (ml) LVEF (%) LVM (g) RVEDV (ml) RVESV (ml) RVSV (ml) RVEF (%) Man. 144±34 59±18 85±20 60±6 86±24 154±40 69±24 85±20 56±6
Auto. 146±31 60±18 86±18 60±7 87±23 154±40 71±26 83±21 54±7
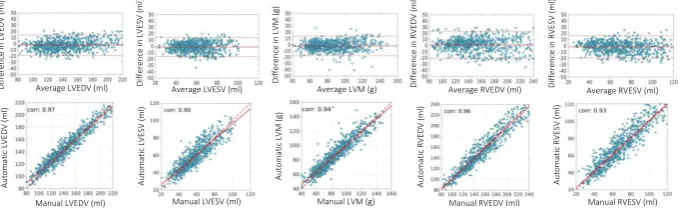
Figure 2 shows Bland-Altman (top) and correlation (bottom) plots of ven-tricular parameters computed using the proposed automatic method and the manual reference on the test dataset. The Bland-Altman plots show good limits of agreement and also the mean difference line nearly at zero, which suggests that the clinical indexes obtained through the automatic approach have little bias. The correlation plots and their correlation coefficient (corr) indicate a strong relationship between the manual and automatic approaches.
D if fe re n ce i n L V E D V ( m l) D if fe re n ce i n L V E S V ( m l) D if fe re n ce i n L V M ( g ) D if fe re n ce i n R V E D V ( m l) D if fe re n ce i n R V E S V ( m l) A u to ma ti c LV E D V ( m l) A u to ma ti c LV E S V ( m l) A u to ma ti c LV M ( g ) A u to ma ti c R V E D V ( m l) A u to m a ti c R V E S V ( m l)
Manual LVEDV (ml) Manual LVESV (ml) Manual LVM (g) Manual RVESV (ml) Average LVEDV (ml) Average LVESV (ml) Average LVM (g) Average RVEDV (ml) Average RVESV (ml)
[image:8.595.140.481.469.575.2]Manual RVEDV (ml)
Figure 2. Repeatability of various cardiac functional indexes: manual vs automatic analysis on the test dataset. The first row showsBland-Altmanplots. The solid line denotes the mean difference (bias) and the two dashed lines denote ±1.96 standard
8 R. Attar et al.
4
Conclusion
In this paper, we propose a fully automatic workflow capable of performing high throughput end-to-end 3D cardiac image analysis. We tested our workflow on a reference cohort of 800 healthy subjects for which manual delineations, and reference functional indexes exist. Our results show statistically significant agreement between the manually obtained reference indexes, and those computed automatically using the proposed workflow. As future work, we plan to analyse all available UKB datasets including both healthy and pathological subjects and report the regional and global cardiac function indexes.
Acknowledgements
R. Attar was funded by the Faculty of Engineer-ing Doctoral Academy Scholarship, University of Sheffield. This work has been partially supported by the MedIAN Network (EP/N026993/1) funded by the En-gineering and Physical Sciences Research Council (EPSRC), and the European Commission through FP7 contract VPH-DARE@IT (FP7-ICT-2011-9-601055) and H2020 Program contract InSilc (H2020-SC1-2017-CNECT-2- 777119). The UKB CMR dataset has been provided under UK Biobank Application 2964.References
1. G. A. Roth, C. Johnson, A. Abajobir, F. Abd-Allah, S. F. Abera, G. Abyu, M. Ahmed, B. Aksut, T. Alam, K. Alam,et al., “Global, regional, and national bur-den of cardiovascular diseases for 10 causes, 1990 to 2015,”Journal of the American College of Cardiology, vol. 70, no. 1, pp. 1–25, 2017.
2. S. E. Petersen, N. Aung, M. M. Sanghvi, F. Zemrak, K. Fung, J. M. Paiva, J. M. Francis, M. Y. Khanji, E. Lukaschuk, A. M. Lee,et al., “Reference ranges for car-diac structure and function using cardiovascular magnetic resonance (CMR) in cau-casians from the UK Biobank population cohort,”Journal of Cardiovascular Mag-netic Resonance, vol. 19, no. 1, p. 18, 2017.
3. K. Gorgolewski, C. D. Burns, C. Madison, D. Clark, Y. O. Halchenko, M. L. Waskom, and S. S. Ghosh, “Nipype: a flexible, lightweight and extensible neu-roimaging data processing framework in python,” Frontiers in neuroinformatics, vol. 5, p. 13, 2011.
4. L. Zhang, A. Gooya, B. Dong, R. Hua, S. E. Petersen, P. Medrano-Gracia, and A. F. Frangi, “Automated quality assessment of cardiac MR images using convolu-tional neural networks,” inInternational Workshop on Simulation and Synthesis in Medical Imaging, pp. 138–145, Springer, 2016.
5. H. C. Van Assen, M. G. Danilouchkine, A. F. Frangi, S. Ord´as, J. J. Westenberg, J. H. Reiber, and B. P. Lelieveldt, “SPASM: a 3D-ASM for segmentation of sparse and arbitrarily oriented cardiac MRI data,”Medical Image Analysis, vol. 10, no. 2, pp. 286–303, 2006.
6. X. Alb`a, K. Lekadir, M. Perea˜nez, P. Medrano-Gracia, A. A. Young, and A. F. Frangi, “Automatic initialization and quality control of large-scale cardiac MRI segmentations,”Medical image analysis, vol. 43, pp. 129–141, 2018.