COMBINING DIFFERENT VALIDATION TECHNIQUES FOR CONTINUOUS
SOFTWARE IMPROVEMENT - IMPLICATIONS IN THE DEVELOPMENT OF
TRNSYS 16
Michaël KUMMERT
(1)David E. BRADLEY
(2)Timothy P. McDOWELL
(2)(1)
University of Wisconsin-Madison, Solar Energy Laboratory. Madison, Wisconsin (USA)
(2)Thermal Energy System Specialists, LLC. Madison, Wisconsin (USA)
[email protected]
[email protected]
[email protected]
ABSTRACT
Validation using published, high quality test suites can serve to identify different problems in simulation software: modeling and coding errors, missing features, frequent sources of user confusion. This paper discusses the application of different published validation procedures during the development of a new TRNSYS version: BESTEST/ASHRAE 140 (Building envelope), HVAC BESTEST (mechanical systems) and IEA ECBCS Annex 21 / SHC Task 12 empirical validation (performance of a test cell with a very simple mechanical system).
It is shown that each validation suite has allowed to identify different types of problems. Those validation tools were also used to diagnose and fix some of the identified problems, and to assess the influence of code modifications. The paper also discusses some limitations of the selected validation tools.
INTRODUCTION
Software developers can rely on users of their program to validate it versus other tools or measured data. Users can then give a very useful feedback to the developers by filing bug reports and explaining technical issues. However, the developers themselves must constantly validate their software using high quality published test suites.
Different methods of validation can serve different purposes for a building energy simulation program developer:
- Identify sources of user confusion and missing features
- Reveal modeling and coding errors
- Assess the strengths and weaknesses of a tool in comparison with state-of-the-art simulation programs
- Understand the discrepancies between the results through the use of simplified cases and sensitivity studies
- Assess the influence of code modifications
Rather than presenting the results obtained with different validation suites in the order the tests were run and discussing the results of each suite, this paper will illustrate the usefulness of validation tools for different purposes. Examples of application to the development of TRNSYS are presented and discussed for each of the purposes listed here above.
TRNSYS was originally developed at the University of Wisconsin-Madison Solar Energy Laboratory. It was made commercially available in 1975, when it consisted of an equation solver with a few solar thermal components. Since then, the program has been expanded into a comprehensive package to model buildings and energy systems. It has become a reference program for solar and other renewable energy systems and buildings. The program has kept its original flexibility and an increasing number of additional component libraries (some of them with dozens of components) are being developed. This paper will focus on the standard TRNSYS 15 package currently available (SEL, 2000) and on planned developments for TRNSYS 16.
SELECTED VALIDATION TOOLS
between the results obtained by different testers are discussed in (Bradley et al., 2004)
0 10 20 30 40 50 60 70 80 90 100
Dble Glazing Opaque - Dble Gl. EVmin EVavg EVmax T15 Measured [MJ]
- IEA HVAC BESTEST. The currently available test cases in this suite allow validating "performance-map modeling of space cooling equipment when the equipment is operating close to design conditions" (Neymark and Judkoff, 2002). Results can be compared to analytical solutions and to other simulation programs.
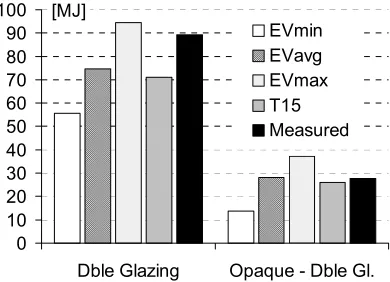
[image:2.612.325.520.97.238.2]- IEA ECBCS Annex 21 / SHC Task 12 empirical validation test suite (Lomas et al., 1994). The package contains high quality data sets for two ten-day experiments in test rooms. The use of identical test rooms with different glazing options also allows testing the accuracy of models to predict the difference in performance between different options. The results obtained with 17 simulation programs, during blind and non-blind tests, are also included.
Figure 1: Heating energy (Double Glazing case and difference with Opaque case), IEA EV
Ability to simulate validation test cases
The 3 validation packages cover the different types of validation (Neymark and Judkoff, 2002): analytical verification, empirical validation and inter-model comparison. They also contain data for selected reference programs, including previous versions of TRNSYS.
Reference validation tools have become de facto standards to test and compare simulation programs and developers must ensure that their tool is able to simulate all the test cases.
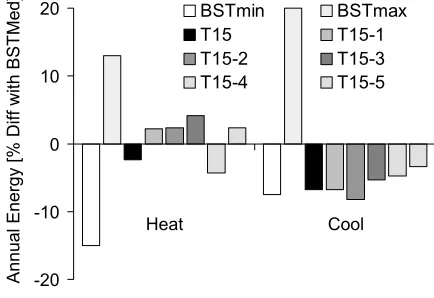
In the case of TRNSYS, the fact that every user is able to modify or add components and that most user take advantage of that flexibility may cause some confusion, as some modules that were tested in the validation projects mentioned here above are not available to all TRNSYS users. The authors have opted to only use standard components. Figure 2 shows the results obtained for HVAC BESTEST cases using TRNSYS' standard performance map component (T15), compared to the minimum and maximum simulated values (HBSTmin and HBSTmax) and the analytical solution.
STRENGTHS AND WEAKNESSES VS.
STATE-OF-THE-ART TOOLS
Ability to simulate real buildings
The IEA Empirical validation suite allows to compare simulated results with measured values in a highly controlled environment. This gives the developers an opportunity to uncover physical modeling errors (i.e. cases when the actual thermal processes occurring in the building are different from their representation).
0 1 2 3 4
E
1
0
0
E
1
1
0
E
1
2
0
E
1
3
0
E
1
4
0
E
1
5
0
E
1
6
0
E
1
6
5
E
1
7
0
E
1
8
0
E
1
8
5
E
1
9
0
E
1
9
5
E
2
0
0
C
O
P
[-]
HBSTmin Analytical HBSTmax
T15 T16a
Furthermore, results obtained with other programs are also given, which helps the developers analyze the discrepancies between measured and simulated results and allows them to distinguish between modeling errors and coding or mathematical errors.
!
! !
!
!
This is illustrated by Figure 1, which shows the total heating energy for the heated period (Double glazing case and difference between the opaque and double glazing cases). The vast majority of tested programs underestimates the heating load, but the difference between the two cases is accurately simulated. This indicates that the cause of the discrepancy in heating load is more likely to be a modeling or an experimental inaccuracy (common to different programs) than a coding or mathematical error.
Figure 2: Mean COP, HVAC BESTEST
[image:2.612.322.540.512.658.2]exclamation mark) are not acceptable. The humidity in the zone reaches negative values during the simulation. The TRNSYS 15 performance map component (Type 42) is not adapted to situations when the cooling coil is in dry regime. Calculating the performance for those cases first requires interpolating the maximum entering wet bulb temperature for dry coil regime and then calculating the performance in dry regime by extrapolating those results. The "T16a" results are obtained with a development version of a component able to handle the special interpolation and extrapolation required to run HVAC BESTEST cases. It should be repeated here that the TRNSYS results given in HVAC BESTEST (Neymark and Judkoff, 2002) were not obtained with the standard performance map component (Type 42) but with a special component developed by the participating team. They obtained results in the acceptable range for all cases. Another example of program limitations occurs in Cases 195, 200 and 215 of the BESTEST validation suites: those cases require setting the external infrared emissivity of walls to 0.1, which is not possible in TRNSYS Type 56 without a source code modification. This is a typical example of a feature that is unlikely to be used in realistic cases but that is useful for diagnostic purposes.
DETAILED INVESTIGATIONS
The BESTEST user guide gives reference values for combined heat transfer coefficients (inside and outside). Outside coefficients are given as a function of wind speed and long wave emissivity, while inside coefficient depend on the surface slope, the direction of heat transfer and emissivity.
TRNSYS requires outside convection coefficients separately, because long wave heat exchanges are calculated using Stefan-Boltzmann law and an effective sky temperature. Long wave exchanges inside the building are also treated separately, using the concept of "star temperature" (SEL, 2000). So both inside and outside heat transfer coefficients must be disaggregated to obtain the convective part. Once this is done, the convective heat transfer can be modeled exactly as intended in BESTEST, but radiative heat transfer will still be modeled differently. In order to assess the importance of that difference, Case 600 was simulated with different options:
- T15: Default option throughout this paper. Outside convection coefficients are wind dependent, inside convective coefficients are variable and calculated at
each iteration using the surface and air temperatures using the default correlations in TRNSYS Type 80 (Glück, 1997). It is important to note that this is not the default approach in Type 56, the building model. - T15-1: inside convection coefficients follow the
guidelines given in BESTEST, i.e. they are not temperature dependent but they depend on the heat flow direction for horizontal surfaces
- T15-2: Same as T15-1 + constant convective coefficients outside (calculated using the average wind speed)
- T15-3: constant convective coefficients outside, constant convective coefficients inside (not dependent on the direction of heat flow for floor and ceiling)
- T15-4: T15 coefficients but use of another correlation to compute the effective sky temperature for long wave radiative heat transfer outside (Clark and Allen, 1978). The correlation gives a sky temperature that is 4 degrees warmer than the default correlation in TRNSYS (Duffie and Beckman, 1991) for the BESTEST weather data (average sky temperature of -3.7°C instead of -7.7°C).
[image:3.612.319.536.490.639.2]- T15-5: T15-3 coefficients with T15-4 correlation for the effective sky temperature
Figure 3 shows the results obtained for those different hypotheses. The median result of the original BESTEST programs has been used as a reference in order to emphasize differences between programs. It should be noted, however, that results near the middle of a range are not necessarily any better than results at the edges of a range.
-20 -10 0 10 20
Heat Cool
An
n
u
a
l
En
e
rg
y
[%
D
if
f
w
it
h
BST
Me
d
]
BSTmin BSTmax
T15 T15-1
T15-2 T15-3
T15-4 T15-5
Figure 3: BESTEST Case 600, Heating and Cooling loads. Percentage difference with the median BESTEST result
why BESTEST proposes simplified "diagnostic cases" that allow studying some effects in detail by isolating them from other disturbances. For example, Case 200 is based on Case 600 but all emissivities (in- and outside, long- and shortwave) are set to 0.1 to minimize the effects of radiation. The transparent window is also replaced with an opaque panel having the same thermal properties. Case 200 isolates the effect of film coefficients on the building.
The long wave emissivities are not directly adjustable in TRNSYS, although the inside coefficients can easily be changed all at once by adjusting the Stefan-Boltzmann constant. Outside radiation losses use hard coded parameters and require a source code modification to be adjusted. Figure 4 shows the results obtained for that diagnostic case.
-25 -20 -15 -10 -5 0 5 10 15
An
n
u
a
l
En
e
rg
y
[%
D
if
f
w
it
h
BST
Me
d
]
BSTmin BSTmax
T15 T15-1
T15-2 T15-3
[image:4.612.321.520.108.249.2]Heat Cool
Figure 4: BESTEST Case 200, Heating and Cooling loads. Percentage difference with the median BESTEST result
Those results show that the low cooling load that is consistently calculated by TRNSYS for BESTEST cases is mainly due to the variable convective heat transfer coefficients that were chosen. The sky temperature used to calculate long wave radiative heat transfers also plays a secondary role. It is interesting to note that only one of the original BESTEST programs used variable internal convective heat transfer coefficients. That program (ESP-r) calculated the lowest cooling load in the vast majority of test cases. The combined cooling load of ESP-r for all cases was 20% lower than the average of all programs.
IDENTIFICATION OF ERRORS
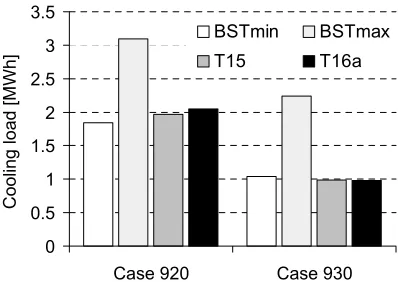
The BESTEST validation suite allowed the developers to identify a problem in the algorithm used to simulate shading by overhangs and wing walls. As shown in Figure 5, the cooling load for Case 920 (unshaded windows, East and West facing) is at the lower end of
the range defined in BESTEST, while it is outside the range for Case 930 (shaded).
0 0.5 1 1.5 2 2.5 3 3.5
Case 920 Case 930
C
o
o
lin
g
l
o
a
d
[
M
W
h
]
BSTmin BSTmax
[image:4.612.75.293.278.421.2]T15 T16a
Figure 5: Annual cooling load, BESTEST
The BESTEST suite allows testers to further investigate this type of unexpected results by providing intermediate results such as the total radiation transmitted through all windows and the shading factor (1 - shaded transm. rad. / unshaded transm. rad.). It can be seen in Figure 6 that TRNSYS 15 and the development version using the new solar radiation algorithms have a high shading coefficient compared to most programs originally tested in BESTEST.
0 0.1 0.2 0.3 0.4
ESP-D
MU
D
O
E2
SR
ES/
SU
N
SR
ES-BR
E
S3
PAS
T
ASE T1
3
T
1
5
T
1
6
[image:4.612.324.538.409.549.2]a
Figure 6: Annual shading factor, BESTEST (930 vs. 920)
ASSESSMENT OF MODIFICATIONS
-150 -100 -50 0 50 100 150
Case 900 Case 920
T
ra
n
sm.
[
kW
h
/m²]
vs.
BST
Me
d BSTmin BSTmax
T14.2 T15
T16a TRNSYS includes a solar radiation processor which
[image:5.612.320.542.78.215.2]can use different sky models to calculate the diffuse radiation on tilted surfaces. The radiation processor also calculates the sun position according to well accepted algorithms (Duffie and Beckman, 1991). The developers are considering to replace the default correlation for sky diffuse radiation with the correlation developed by Perez et al. (1990). The sun position calculation will also be updated to use more accurate data (Michalsky, 1988). Both changes are expected to have a small influence on the calculated performance of energy systems, but it is interesting to be able to test such code changes using validation test cases.
Figure 8: Total transmitted radiation through windows. The median value of BESTEST has been subtracted
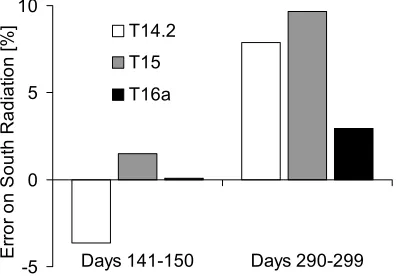
The IEA empirical validation suite contains data recorded for the global and diffuse horizontal radiation and for the global radiation on the South wall. Figure 7 shows the error on the calculated global radiation for that orientation. Even though the data covers a relatively short period of time, it is reassuring to see that the updated solar radiation algorithms improve the accuracy of calculated values.
It should be noted that the results here above combine solar radiation processing results and windows optical properties. We discuss later the problems that occurred when trying to reproduce accurately the thermal and optical properties of windows in BESTEST.
SOURCES OF USER CONFUSION
-5 0 5 10
Days 141-150 Days 290-299
Er
ro
r
o
n
So
u
th
R
a
d
ia
ti
o
n
[
%
] T14.2
T15
T16a
Running validation test cases usually implies many iterations: the user first tracks possible input errors, decides to model a particular aspect in different ways, and then he or she can assess the importance of choosing different values for some parameters that are not specified.
In the case of TRNSYS, two potential problems were identified using the validation packages: windows properties and setpoint profiles.
Windows thermal and optical performance
The TRNSYS multizone building model, known as the "Type 56", uses a detailed window model that requires an input file created using the WINDOW program (LBNL, 2001). This program allows to model thermal and optical performance of windows in a very detailed way. However, it is not always easy to understand the data that is really used by Type 56.
Figure 7: Error on radiation, South wall (IEA EV)
The BESTEST validation suite also allows to assess the influence of a modified solar radiation algorithm on the simulated building performance. As expected, the difference is rather small in the case of improved solar radiation algorithms. However, BESTEST allows developers to study some intermediate results. This is illustrated in Figure 8, which shows the annual transmitted radiation through all windows for Case 900 (South windows) and 930 (East windows).
[image:5.612.76.274.377.516.2]It is interesting to note that the validation packages themselves contain a less detailed window properties description, which adds to the user confusion. This is discussed later in the paper.
0 1 2 3 4 5 6 7
Annual Heat [kWh] Peak Heat [kW] BSTmin
BSTmax
T15-1h
T15-0.1h
Heating and cooling setpoint profile
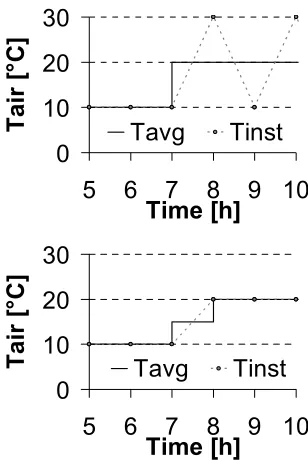
[image:6.612.322.520.77.218.2]The value of any TRNSYS variable for a given time step refers to the average value over that time step. While this is a very logical concept for an energy analysis program, it can lead to some confusion when a time-varying setpoint profile is used for building load calculations: the setpoint actually acts on the average value of the temperature during a time step, which could generate oscillations if a conventional setback strategy is used. This is illustrated in Figure 9. The top graph shows the oscillations in the instantaneous temperature that would occur if the average temperature goes from 10°C to 20°C in one time step. The bottom graph shows the solution applied in Type56: the average temperature setpoint for the first hour after startup is moved halfway between the setback temperature and the day temperature.
Figure 10: Time step influence (BESTEST Case 940)
Other potential problems
- Lack of geometrical information: the TRNSYS building model in itself does not include any geometrical information, which can cause user errors (geometrical inconsistencies). This also requires the user to enter some key parameters in a simulation, such as the distribution of direct solar radiation on the different internal surfaces. Two out of the three authors had used a wrong distribution when they first ran the BESTEST validation suite (Type 56 asks for the distribution factors of direct radiation only, while the BESTEST manual mentions overall distribution coefficients, i.e. direct + diffuse after internal reflections).
0
10
20
30
5
6
7
8
9 10
Time [h]
T
a
ir
[
°C
]
Tavg
Tinst
0
10
20
30
5
6
7
8
9 10
Time [h]
T
a
ir
[
°C
]
Tavg
Tinst
- Weather data: both BESTEST and Empirical validation suites require the use of weather data that does not have one of the standard formats recognized by TRNSYS 15 (TMY2, IWEC, TRY, etc.). The BESTEST suite uses an older format (NREL TMY) while the Empirical Validation suite uses a non-standard format. This requires some caution from users in order to process the solar radiation correctly, and it is a potential source of important errors. However, the very fact that those non-standard formats can be used in simulations without requiring a modification of the standard component library demonstrates the flexibility offered by TRNSYS. Figure 9: Heating setpoint profile
Using validation suites to create exemplars
This approach can lead to significant differences between calculated heating loads and peak demands with different time steps if an infinite heating power is assumed, as shown in Figure 10. The figure shows results for BESTEST case 940 (setback, heavy building). It is clear that the value obtained for a small time step is closer to the results obtained with other programs.
[image:6.612.99.253.349.580.2]developing and documenting a new version of the program, but they will also post the complete test results and input files to a website in order to give an example of good modeling practice. The BESTEST and HVAC BESTEST validation suites are especially well suited to that purpose, because the input data amount is acceptable and the full documentation packages are available on the internet.
PROBLEMS WITH VALIDATION TOOLS
The selected validation tools are a very valuable resource for software developers and users, as shown in the previous sections. They must be continuously improved to reflect changes in state-of-the-art modeling techniques and computer science. Work is currently in progress in the IEA framework (IEA, 2004)
The following problems were encountered by the authors:
- The IEA BESTEST (Judkoff and Neymark, 1995) validation suite uses combined heat exchange coefficients to model convective and radiative heat transfer, both inside and outside the building. The linearization and aggregation of radiative exchanges with convective losses is a well accepted modeling technique, but some simulation programs use a different approach based on an effective sky temperature for outdoor IR losses and use different solutions to the "delta-star" transformation problem for indoor long-wave exchanges. Our tests have shown that both choices have a significant influence on some results. High quality data sets for empirical validation, such as the IEA ECBCS Annex 21 / SHC Task 12 test suite (Lomas et al., 1994) offer an irreplaceable solution to test simulation tools without having to make a modeling assumption regarding long-wave radiative exchanges.
- The notion of peak heating load in BESTEST Cases 640 and 940, which use a night setback and have a virtually infinite available heating power, is a very theoretical concept. A test where simulation programs have to simulate accurately the recovery time from a night setback using a realistic maximum power would probably be closer to real design and analysis simulations.
- The description of windows thermal and optical properties in BESTEST does not take advantage of state-of-the-art modeling tools like WINDOW 5 (LBNL, 2001). This may actually penalize modelers that use those advanced tools to model windows
accurately because their U-value will not match the simplified value exactly.
- All the selected validation tools use very simple controls when an energy load is to be computed. In particular, the HVAC-BESTEST E100-E200 series seems to be adapted to a de-coupled solution of the building and system performance. The test cases are also designed to check that simulation programs are able to reproduce a particular performance map. Empirical validation results, such as those obtained during the IEA SHC task 22 (Travesi et al., 2001), would help to put the different aspects of system performance into perspective.
CONCLUSIONS
High quality published validation sets are of great interest for Building Energy Simulation Tools developers. They are used by the TRNSYS development team during the preparation of TRNSYS 16, and they have proven their effectiveness in many instances.
Validation tools allow developers to assess the position of their program in comparison with state-of-the-art tools, and some missing features were identified. Empirical validation packages also allow to check the global performance of the program during its development.
Modeling and coding errors were identified, even though their effect on global performance are barely significant, which demonstrates the ability of validation packages to detect a great variety of errors in tested programs. Validation tools also allow to realize detailed investigations on the cause of unexpected results.
New program or algorithms are also efficiently checked using validation test cases, as part of the quality assurance process.
Sources of user confusion have also been uncovered thanks to the validation packages. The developers will take this into account in developing and documenting a new version of TRNSYS. The complete results of the tests, together with a user guide adapted to TRNSYS, will also be posted to a website, in order to help users facing the sources of confusion that have been identified. This is another benefit of applying reference validation tools to a software package.
ACKNOWLEDGEMENTS
The authors wish to thank Jeff Thornton, at Thermal Energy Systems Specialists, for his help in identifying and solving the problems that occurred with the HVAC BESTEST suite.
REFERENCES
ASHRAE (2001), ANSI/ASHRAE Standard 140-2001, Standard Method of Test for the Evaluation of Building
Energy Analysis Computer Programs, American
Society of Heating, Refrigerating, and Air-Conditioning Engineers, Atlanta, Georgia.
Bradley D.E., Kummert M. and Mc Dowell T.P. (2004), 'Experiences with and interpretation of standard test methods of building energy analysis tools', in Proceedings of ESim 2004, Vancouver, Canada.
Clark G. and Allen C. (1978), 'The estimation of atmospheric radiation for clear and cloudy skies', in
Proceedings of 2nd National Passive Solar Conference
(AS/ISES), pp. 675-678.
Duffie J. And Beckman W. (1991), Solar Engineering
of Thermal Processes – Second Edition, Wiley
Interscience, New-York.
Glück (1997), Wärmetechnisches Raummodel, C.F. Müller Verlag, Karlsruhe.
IEA (2004), Energy Conservation in Buildings & Community Systems (ECBCS), Annex 43 – Solar Heating and Cooling (SHC), Task 34: Testing and
Validation of Building Energy Simulation Tools.
http://www.ecbcs.org/Annexes/annex43.htm
Judkoff R. and Neymark J. (1995), International Energy Agency Building Energy Simulation Test
(BESTEST) and Diagnostic Method, National
Renewable Energy Laboratory, Golden, Colorado. NREL/TP-472-6231.
LBNL (2001), WINDOW 5 User Manual, Ernest Orlando Lawrence Berkeley National Laboratory, Berkeley, California. LBNL-44789
LBNL (2003), EnergyPlus Testing with ANSI/ASHRAE Standard 140-2001 (BESTEST) - EnergyPlus Version
1.1.0.020, Ernest Orlando Lawrence Berkeley National
Laboratory, Berkeley, California.
Lomas K.J., Eppel H., Martin C. and Bloomfield D. (1994), Empirical validation of thermal building simulation programs using test room data. Vol.1, Final
Report. Vol. 2, Empirical Validation Package,
International Energy Agency.
Michalsky J.J. (1988), 'The Astronomical Almanac’s Algorithm for Approximate Solar Position (1950-2050)', Solar Energy. 40 (3), pp. 227-235.
Neymark J. and Judkoff R. (2002), International Energy Agency Building Energy Simulation Test and Diagnostic Method for HVAC Equipment Models
(HVAC BESTEST), National Renewable Energy
Laboratory, Golden, Colorado. NREL/TP-550-30152. Perez R., Ineichen P., Seals R., Michalsky J.J. and Stewart R. (1990), 'Modeling Daylight Availability and Irradiance Components from Direct and Global Irradiance', Solar Energy, 44 (5) pp. 271-289.
SEL, 2000, TRNSYS - A Transient System Simulation
Program - Reference Manual, Solar Energy
Laboratory, University of Wisconsin-Madison. Madison, WI. http:/sel.me.wisc.edu/trnsys
Travesi J., Maxwell G., Klaassen C., Holtz M. (2001),