including groundwater effect
.
White Rose Research Online URL for this paper:
http://eprints.whiterose.ac.uk/151911/
Version: Accepted Version
Proceedings Paper:
Derbin, Y, Walker, J, Wanatowski, D orcid.org/0000-0002-5809-0374 et al. (1 more author)
(2019) Numerical simulation of surface subsidence after UCG including groundwater
effect. In: Proceedings of the 17th European Conference on Soil Mechanics and
Geotechnical Engineering (ECSMGE 2019). XVII ECSMGE 2019, 01-06 Sep 2019,
Reykjavik, Iceland. International Society for Soil Mechanics and Geotechnical
Engineering . ISBN 978-9935-9436-1-3
10.32075/17ECSMGE-2019-0174
© The authors and IGS: All rights reserved, 2019. This is an author produced version of a
conference paper presented at The XVII European Conference on Soil Mechanics and
Geotechnical Engineering.
eprints@whiterose.ac.uk https://eprints.whiterose.ac.uk/ Reuse
Items deposited in White Rose Research Online are protected by copyright, with all rights reserved unless indicated otherwise. They may be downloaded and/or printed for private study, or other acts as permitted by national copyright laws. The publisher or other rights holders may allow further reproduction and re-use of the full text version. This is indicated by the licence information on the White Rose Research Online record for the item.
Takedown
If you consider content in White Rose Research Online to be in breach of UK law, please notify us by
Proceedings of the XVII ECSMGE-2019 Geotechnical Engineering foundation of the future
ISBN 978-9935-9436-1-3
© The authors and IGS: All rights reserved, 2019 doi:10.32075/17ECSMGE-2019-0174
Numerical simulation of surface subsidence after UCG
including groundwater effect
Simulation numérique de la subsidence de surface incluant les eaux
souterraines après une GSC
Y. Derbin
State Hydrological Institute, Saint Petersburg, Russia
J. Walker
University of Nottingham, Ningbo, China
D. Wanatowski
University of Leeds, Leeds, UK
L. Khaba
Lerotholi Polytechnic, Maseru, Lesotho
ABSTRACT: Underground Coal Gasification (UCG) is a method that allows for the extraction of energy from hard to access coal seams (i.e. very thin or deep underground). One of the greatest advantages of UCG is that it eliminates the need to put humans underground, thereby reducing the risk of injury and fatality, which are significant concerns during conventional underground coal excavations.
UCG currently has two main hurdles that are affecting its potential industrialization: the risk of surface subsidence and groundwater pollution. The existence of groundwater is particularly a challenge because of implications to both pollution and its influence on mechanical processes underground. Two mechanical effects of groundwater should be considered: changes in effective stress and in volumetric strain. Additionally, at any UCG site, the influence of groundwater should be analyzed together with the thermal impact of coal combustion. To couple the fluid, thermal and mechanical analyses, the commercial software FLAC3D by Itasca is utilized. The modelling results are compared with the field measurements at the Shatsk UCG station in the Moscow Basin. The site at hand is complicated by six aquifers in the overburden above the UCG reactor. The relative performance of the models with and without groundwater and thermal effects is evaluated based on predictions of the surface subsidence. The groundwater increases the depth and narrows the width of surface subsidence closing the modelling results to the measurements, whereas the high-temperature decreases the depth without changing the shape of the surface subsidence.
RÉSUMÉ: La GSC (Gazéification Souterraine de Charbon) est une méthode qui permet d’extraire énergie des veines de charbon difficilement accessibles (par exemple des gisements fins ou bien en profondeur).
Un des avantages de la GSC est d’éliminer le besoin d’envoyer des êtres humains dans le sous-sol, ce qui réduit
ECSMGE-2019 – Proceedings 2 IGS
Toutefois, au présent il y a deux obstacles principaux à l’exécution de la GSC à grande échelle: le risque de
l’affaissement de surface et la pollution potentielle des eaux souterraines. Il faut donc considérer deux effets mécaniques des eaux souterraines: les changements dans l’effort efficace et ceux dans la pression volumétrique. Afin de relier les réponses fluides, thermiques et mécaniques de la surface avec la combustion du charbon dans un site GSC pour évaluer la subsidence de surface, nous avons utilisé le logiciel commercial FLAC3D de Itasca. Dans cet article, nous considérons l’influence des hautes températures et des eaux souterraines sur la subsidence de surface.
Les résultats du modelage sont comparés avec les mesures de terrain dans un site GSC dans le bassin de Moscou. Dans le mort-terrain sur le réacteur GSC il y a six aquifères, ce qui rend ce modelage plus intéressant. La performance des modèles avec et sans eaux souterraines et effets thermiques est évaluée sur la base des prédictions de la subsidence de surface.
Keywords: Underground Coal Gasification; Groundwater; Surface Subsidence; Numerical Modelling; Thermal Analysis, FLAC3D
1
INTRODUCTION
Surface subsidence could be a serious obstacle to coal extraction in the densely-populated areas causing damages to buildings and infrastructure. The surface subsidence is more difficult to handle during and after underground coal gasification (UCG), which is an unconventional method of coal extraction. Distinctly from traditional mining, UCG causes a thermal impact on surface subsidence due to underground coal combustion in the UCG reactor. At that, the UCG method gives several important advantages, for example, the elimination of underground human work or application to the deep and thin coal seams. To enjoy the UCG benefits, the surface subsidence should be precisely forecasted, for example, by numerical modelling.
This work deployed commercial finite-difference software FLAC3D version 5 by the Itasca Consulting Group (Itasca, 2011) to simulate surface subsidence after UCG with coupling thermo-fluid-mechanical processes.
Previously, the geomechanical software
FLAC3D has been used for linking thermal, fluid and mechanical analyses. For example, Rutqvist (2011), and Prassetyo and Gutierrez (2014) coupled FLAC with TOUGH2 (Pruess et al., 1999) to predict the fluid-mechanical response of
geomaterial. TOUGH2 is a multiphase fluid and heat transport code, which has been used for coupling thermal, fluid, and mechanical processes in different geomechanical software. For example, Yeh and O’Sullivan (2007) coupled, in the geomechanical finite-element software ABAQUS (ABAQUS, 2003) with TOUGH2 to model subsidence in geothermal fields. At that, Kiryukhin et al. (2014) successfully coupled FLAC and TOUGH2 to investigate surface subsidence at the geothermal fields too. One more application of the coupling thermo-fluid-mechanical processes is geological disposal of nuclear waste. Rutqvist and Tsang (2003) investigated the possibility of nuclear waste storage underground and drew the conclusion which was used in this research and which said that the groundwater impacted the overburden behaviour, but flow pattern immediate above the drift excavation did not significantly change.
Numerical simulation of surface subsidence after UCG including groundwater effect
Chen and Baladi (1985), the concept of isotropy could and was assumed in stress-strain relations for these soils and rocks as this study on the surface subsidence did not refer to the cases of nonhomogeneous stress states, nonproportional loading paths or cyclic loadings. These cases are not acceptable for isotropy concept. This research also used the isotropic thermal conduction model and isotropic fluid model. The null fluid model was implemented to specify impermeable materials.
Firstly, the pure mechanical model was run. Secondly, the model was run with fluid-mechanical interaction for two cases. The first case used the uniform porosity and the Biot coefficient in the whole domain. The second case exploited the different porosity and the Biot coefficient, which were assigned according to the soil or rock type. Then the thermal interaction was included in the fluid-mechanical model. The
results were compared with the field
measurements at the Shatsk UCG station in the Moscow Basin.
2
UCG SITE
The Shatsk UCG station was located 180km south from Moscow. The UCG was started in 1955 and conducted for 27 months. For this site, the borehole logs and measured surface subsidence were recorded by Turchaninov and Sazonov (1958). Despite the age of the field data, the data is unique due to the scarce of UCG projects in the world. The reported 1cm-accuracy of the data was sufficient for their comparison with the modelled results.
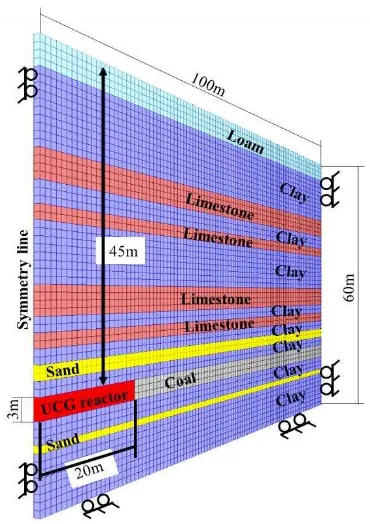
ECSMGE-2019 – Proceedings 4 IGS Figure 1 Lithological Column
Figure 1 shows that the surface layer was 4m-thick Quaternary loam, which covered the Mesozoic clay with a thickness of 7-20m. This clay constituted the thickest layer at the site and spread on the Palaeozoic layers of fractured limestone at depths of 18m, 23m, 35m and 39m, sand at depths of 43m and 52m, clay at depths of 14m, 21m, 31m, 37m, 41m, 45m, 51m, 54m, and coal seam at a depth of 48m. The properties for these geomaterials were calculated according to the algorithm presented in the paper by Derbin et
Numerical simulation of surface subsidence after UCG including groundwater effect
conducted groundwater well because it was fractured at the site. There were four Palaeozoic limestone aquifers, namely Alexin, Upper-, Middle-, and Lower- Tulsk aquifers, and two Palaeozoic sand aquifers, namely Above-the-Coal and Under-the-Above-the-Coal aquifers, at the site.
3
THEORY ON THERMAL (T), FLUID
(F) AND MECHANICAL (M)
COUPLING
To couple T-F-M analyses of the surface subsidence at the Shatsk UCG site, several coefficients, i.e. the Biot coefficient, thermal expansion coefficient and undrained thermal coefficient, and the laws by Darcy and Fourier are required. The Biot coefficient couples the mechanical and hydraulic processes. The thermal expansion coefficient t and the undrained thermal coefficient join the mechanical and thermal responses. Darcy’s and Fourier’s laws describe the fluid and heat transport within the homogeneous solid matrix, respectively. The subscript i denotes a vector, the subscript ij represents a tensor, and the subscript ,j stands for a partial derivative.
The Biot coefficient is needed to define the Biot effective stress ’:
(1)
where is the total stress, p is the pore pressure, and ij is the Kronecker delta.
The thermal expansion coefficient t is incorporated using an equation of volumetric strain :
(2)
where T is the change of temperature.
The undrained thermal coefficient plays its role in the fluid continuity:
(3)
where M is the Biot modulus, n is the porosity, s is the saturation, q is the specific discharge, and qv is the volumetric fluid source intensity.
The Biot modulus M is defined as
(4)
where K and Ku are the drain and undrained bulk moduli of the material, respectively.
For an ideal porous material, the Biot modulus M can be defined through the fluid bulk modulus Kf:
(5)
At that, the thermal continuity equation is
(6)
where MT= 1/( Cv), is the mass density of the medium, and Cv is the specific heat at constant volume, qT is the heat flux, and qvT is the volumetric heat source intensity.
The fluid transport law by Darcy is
(7)
where k is the mobility coefficient, f is the fluid density, and g is the gravity.
The heat transport law by Fourier:
(8)
where kT is the thermal conductivity.
4
MODEL
ECSMGE-2019 – Proceedings 6 IGS Figure 2. Model Domain
The domain consisted of 6000 zones in total. The zones were cube-shaped. The symmetry line of the problem is shown in Figure 2. It went through the middle of the UCG reactor. In the model, the coal was combusted 20m into the coal seam. Obviously, the real UCG reactor was wider. Roller boundary conditions were imposed on both ends and bottom of the domain. The lithological layers from Figure 1 in the model are also shown in Figure 2 by different colours.
The mechanical analysis explored the traditional Mohr-Coulomb constitutive model in the whole domain, and the double-yield model was used to simulate the goaf behaviour, perturbation of highly disintegrated geomaterial at the place of a collapse of a UCG reactor.
5
F-M MODEL
For the F-M analysis, the mobility coefficients k were assigned according to Figure 1. The water bulk modulus Kf was taken as 2.2GPa from the FLAC3D manual (Itasca, 2011). The water table was at a depth of 2m, as the deepest typical groundwater depth mentioned earlier for the Moscow basin. The deepest depth was chosen because highly likely the ‘driest’ place was chosen to conduct UCG.
Firstly, the Biot coefficient and porosity n were taken as default uniform values of = 1 (the grains were considered to be incompressible) and n = 0.5 in FLAC3D (Itasca, 2011) because the real values are difficult to estimate. The fractures increase the porosity in a complicated manner (Long and Witherspoon, 1985). Then the porosity and the Biot coefficient were assigned according to the soil or rock type: 15% for coal (Mastalerz et al., 2012), 29% for sand, 41% for clay (Bell, 2000), 55% for loam, and 10% for limestone (Bear and Verruijt, 2012). Wu (2001) suggested the empirical relations between the Biot coefficient and the porosity n by
(9)
Numerical simulation of surface subsidence after UCG including groundwater effect
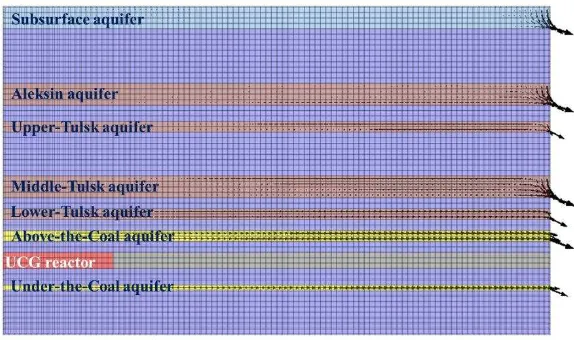
Figure 3. Simulated Directions of the Groundwater Flow in the Model
Figure 3 illustrates six groundwater aquifers and one subsurface aquifer. According to Figure 3, the model predicted that the groundwater immediate above the UCG reactor is not affected significantly; however, the groundwater aside the UCG reactor flowed in the direction from the UCG reactor in all aquifers. The field observations during surface subsidence at the conventional mines have shown the same groundwater flow direction (Booth, 2006). The outlet flow of the different aquifers varied a little and was within 0.07-0.09 m3/s, except 0.005 m3/s for the outlet of the Under-the-Coal aquifer. Therefore, this aquifer experienced the smallest impact of surface subsidence.
6
T-F-M MODEL
Prior to the fluid analysis in TFM model, the thermal fields were imposed. The following thermal parameters were assigned after Derbin (2018): specific heat Cv of 860J kg°C-1, thermal expansion coefficients t of 0.0002°C-1, thermal conductivity kT of 0.2W m-1°C-1. A temperature of coal combustion 1250°C or 1523K was assigned to the UCG reactor and 5°C or 278K to the rest domain as a mean
[image:8.536.279.492.362.535.2]underground temperature for the Moscow Basin. The model was run for 27 months, the period of coal combustion. After this, the null thermal model was assigned to the UCG area as the material (coal) was combusted there. Figure 4 depicts the obtained temperature fields.
Figure 4. Temperature Fields
ECSMGE-2019 – Proceedings 8 IGS
the aquifers did not change a lot, except for the Under-the-Coal seam. There the discharge reduced to 0.00005m3/s and the outlet flow changed its direction for inlet flow.
7
MODEL RESULTS
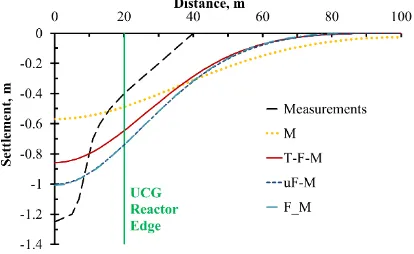
[image:9.536.51.258.256.383.2]The M, F-M, and T-F-M modelling of the surface subsidence at the Shatsk UCG station was performed on the 3.4GHz Intel(R) Core(TM)i7-3770 CPU computer. It took about 10min to reach the equilibrium solution. Figure 5 shows the modelled results and field measurements at the UCG station.
Figure 5. Modelling Results
Figure 5 illustrates the subsidence troughs in the x-y space. The x-axis shows the settlements in m, and it is also a symmetry line. The y-axis is a distance from the symmetry line. The vertical line at 20m is an edge of the UCG reactor. The Measurements curve represents the measured subsidence trough, and four curves, i.e. M, uF-M, F-M, and T-F-M, stand for troughs which were simulated with the mechanical model. The uF-M and F-M curves were obtained with the coupled fluid-mechanical model for the uniform porosity and Biot coefficient through the domain and for the porosity and the Biot coefficient assigned according to the soil type, respectively. The T-F-M curve was modelled with the full coupled thermal-fluid-mechanical model.
None of the modelled troughs agree with the
measurements; however, coupling
fluid-mechanical model provided better predictions. The choice of the porosity did not play a great role as the uF-M and F_M curves agree well as shown in Figure 5. The fluid analysis is important as the uF-M and F_M curves correspond to the Measurements curve better. The T-F-M curve is slightly shallower than the uF-M and F_M curves due to consideration of the uplifting thermal stresses. The M curve is the shallowest and widest modelled trough and much shallower and wider than the measurements were.
8
DISCUSSIONS AND CONCLUSIONS
The research showed that the groundwater impacted surface subsidence greatly; therefore, the fluid analysis should be considered to simulate surface subsidence. The surface subsidence forced to flow the groundwater outwards from the UCG reactor with similar discharge for all aquifers except smaller discharge of the aquifer under the coal. The fluid analysis resulted in deeper surface subsidence troughs. At that, the thermal impact had an uplifting effect decreasing the depth of the surface subsidence. The high temperature also reduced the flow changed its direction of the aquifer under the coal seam.
Numerical simulation of surface subsidence after UCG including groundwater effect
9
ACKNOWLEDGEMENTS
The authors acknowledge the financial support of Ningbo Science and Technology Bureau as part of the International Academy for the Marine Economy and Technology (IAMET) project ‘Structural Health Monitoring of Infrastructure in the Logistics Cycle (2014A35008)’ and the China Association for Science and Technology - Ningbo Youth Talent Raising Scheme. Giovanna Comerio’s help with the translation of the title and abstract into French is appreciated. Last but not least, Prof Vadim Kuzmin is greatly thanked for inspiration.
10
REFERENCES
ABAQUS Inc. 2003. ABAQUS Analysis user’s manual version 6.4. Pawtucket: ABAQUS Inc. Bell, F.G. 2000. Engineering properties of soils
and rocks. London: Blackwell.
Booth, C. 2006. Groundwater as an
environmental constraint of longwall coal mining. Environmental Geology 49, 796–803. Chen, W.F., Baladi, G.Y. 1985. Soil plasticity: theory and implementation. Amsterdam: Elsevier.
Derbin, Y., Walker J., Wanatowski D., Marshall A.M. 2019. Numerical simulation of surface subsidence after the collapse of a mine. In: Enhancements in Applied Geomechanics, Mining, and Excavation Simulation and Analysis. GeoChina 2018. Sustainable Civil Infrastructures. (Eds: Sevi A., Neves J., & Zhao H. ), 80–97. Springer, Cham.
Derbin, Y., Walker, J., Wanatowski, D. 2018. Modelling surface subsidence during
underground coal gasification. In:
Proceedings of International Conference on Mechanics, Energy and Geo-Resources (Eds: Xie, H., Ranjith, PG, & Zhao J.), 1080–1095, Monash University, Chengdu.
Dmitrak, Y, Logachova, V. 2006. Hydro-geological conditions of laying of the coal
seams in the Moscow basin. Mining Scientific Journal 6, 28–30.
Itasca Inc. 2011. FLAC3D Fast Lagrangian Analysis of Continua in 3D dimensions, users guide. Minneapolis: Itasca Consulting Group.
Kiryukhin, A., Rutqvist, J., Maguskin, M. 2014. Thermal-Hydrodynamic-Mechanical
Modeling of Subsidence During Exploitation of the Mutnovsky Geothermal Field, Kamchatka. In: Proceedings 39th Workshop on Geothermal Reservoir Engineering. (Eds: Castro, J.P.), 323–333, Stanford University, Stanford, CA.
Mastalerz, M., He, L., Melnichenko, Y.B., Rupp, J.A. 2012. Porosity of coal and shale: insights from gas adsorption and SANS/USANS techniques. Energy & Fuels 26, 5109–5120. Long, J., Witherspoon, P.A. 1985. The
relationship of the degree of interconnection to permeability in fracture networks. Journal of Geophysical Research: Solid Earth 90, 3087–3098.
Prassetyo, S., Gutierrez, M.A. 2014. Modeling approach in FLAC to predict hydro-mechanical response of subsurface storage reservoirs due to CO2 injection. In: Proceedings 48th US Rock Mechanics/ Geomechanics Symposium. American Rock Mechanics Association (Eds: Labuz, J. F., Detournay, E. & Pettitt, W.), 55–69. American Rock Mechanics Association, Alexandria.
Pruess, K., Oldenburg, C., Moridis, G. 1999. TOUGH2 user’s guide version 2.0, Berkeley: University of California.
Rutqvist, J. 2011. Status of the TOUGH-FLAC simulator and recent applications related to coupled fluid flow and crustal deformations. Computers & Geosciences 37. 739–750. Rutqvist, J., Tsang, C.-F. 2003. Analysis of
thermal–hydrologic–mechanical behavior near an emplacement drift at Yucca
Mountain. Journal of Contaminant
ECSMGE-2019 – Proceedings 10 IGS
Turchaninov, I., Sazonov, V. 1958. Some features of gasification of the coal seam and movements of the overburden during UCG at the Shatsk station. Underground coal gasification 3. 11–16.
Wu B. 2001. Biot’s effective stress coefficient evaluation: static and dynamic approaches. In: Proceedings of ISRM-2nd Asian rock mechanics symposium (Ed: Sijing, W.), 1002–1005. ISRM, Beijing.