Weiss, Stephan and Hoppe, Ulrich (1996) Recognition and
reconstruction of late auditory evoked potentials using wavelet analysis.
In: IEEE-SP International Symposium on Frequency and
Time-Scale Analysis, 1996-06-18 - 1996-06-21, Paris. ,
http://dx.doi.org/10.1109/TFSA.1996.550095
This version is available at
https://strathprints.strath.ac.uk/32593/
Strathprints
is designed to allow users to access the research output of the University of
Strathclyde. Unless otherwise explicitly stated on the manuscript, Copyright © and Moral Rights
for the papers on this site are retained by the individual authors and/or other copyright owners.
Please check the manuscript for details of any other licences that may have been applied. You
may not engage in further distribution of the material for any profitmaking activities or any
commercial gain. You may freely distribute both the url (
https://strathprints.strath.ac.uk/
) and the
content of this paper for research or private study, educational, or not-for-profit purposes without
prior permission or charge.
Any correspondence concerning this service should be sent to the Strathprints administrator:
[email protected]
The Strathprints institutional repository (https://strathprints.strath.ac.uk) is a digital archive of University of Strathclyde research outputs. It has been developed to disseminate open access research outputs, expose data about those outputs, and enable the
rocessing Division
Dept.
of
Electronic ancl
Electrical Eng.
University
ofStrathclydle
Friedrich-Alexander
Universitat
Glasgow,
Scotland
Erlangen, ~ e ~ ~ a n y
Email: [email protected] uk Email: uhoppeQ1te.e-technik.uni-erlangen.de
TRACT
In this paper we introduce a recognition and reconstruction method for late auditory evoked potentials (AEPs) using wavelet analysis. AEPs are part of the Electroenceiphalo- gram (EEG) in reaction to acoustic s t i n n d and are used for diagnostic purposes. The decomposition of the EEG measurement data into subbands can yield a parameteriza- tion of the AEP using a sinall number of' significant coeffi- cients, which can be determined by surveying distributions
of the transform coefficients. This method is more reliable than traditional means, and additionally offers the possi-
bility of reconstructing potential AEPs by performing an inverse transform on significant coefficients.
1. ~~~~~~U~~~~~~
In audiometry, auditory evoked potentials (AEPs) are used
t o obtain an objective audiogram. AEPis form part of the Electroencephalogram (EEG) as reaction to an acoustic stimulus, and can therefore represent hearing ability inde- pendently of the active cooperation or !subj'ective impres-
sion of the experimentee [I]. Within the AEP, ordy the frequency specific late reactions from the cortex are of in- terest, appearing 20 ms to 400 ms after the stimulus has been given. The main inconvenience of late AEPs is the background noise in the EEG caused by other nervous pro- cesses in the cortex, resulting in an extremely poor SNR. Further problems are raised by the non-statbnarity of the REP, its dependence on the tone level and 'differences be- tween individuals. Referring to an objective audilogram, this objectivity is only related to the experimentee, as the data still has to be evaluated by an operator and thus a decision is based on his experience of recognizing certain features within the curves, and the quality of the data.
The main effort in research of late AEPs is therefore to find parameters and methods that help indicate the pres- ence of an AEP in the EEG. Traditional methods range from synchronous averaging and calculating of cross-corre- lations [l] to methods using Fourier coeiRicients, cro,ss-cor- relation coefficients of partial averages, power ratio' of the normal average compared to an average, where every sec- ond measurement is weighted with a minus sipp (response to noise ratio), and the cross-correlation of the ensembiie aver- age with a given pattern, as described in 130th et al. [2],[3].
Bartnilk e t al. [4] were the first to apply a discrete wave- let transform (DWT) to reconstruct evoked potentials. Hav- ing calculated the transform coefficients of a number of EEG measurements, they identify five coefficients with which a
reconsctruction of the sus1Jected contained evoked pokential
is then performed, and an intuitive comparison with the en- semble average is done. The main drawbacks of their work are the assumption that the basic parameters of the poten- tial can be. identified using always the same five coefficients,
a very smidl set of measurements to check the reliability of
their method, and no quantitative assessment of the recon- structed data.
Ba.sed on the idea of' Bartnik et al. of calculating the
DWT of EEG measurernents and on some knowledge of AEPs and, EEG measurements described in Sec. 2, we de- rive a method for identifying transform coefficients that are "significant" for an AEF>, where this significance is evalu- ated statistically [5]. The decision of whether an AEP is
contained in the EEG or not is then based on the presence of a n y significait coefficients. Afterwards, a reconstruction can be performed by applying an inverse DWT to the coef- ficients that, have been assigned significance. This is subject of Sec. 3, while Sec. 4 draws conclusions and discusses the practical .value of the presented method.
A late AEP appears as a low frequency wave of 3-8 Hz
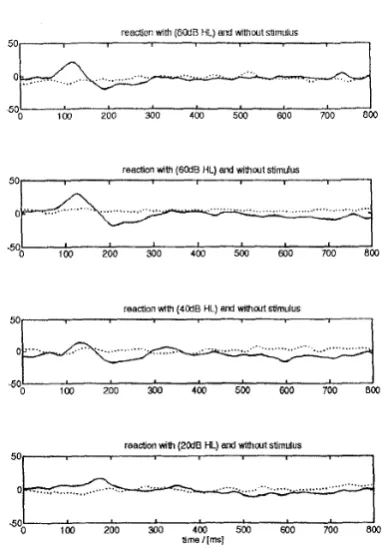
[2] in the EEG. Its maximum is usually around 100 ms after t,he stimulus, dtboiigh this latency varies for &fferent tone levels, and can even change slightly within a set of measurements. As the tone level approaches the hearing threshold, the latency becomes larger and the amplitude diminishes, as it can be seen in the ensemble-averaged EEG measurements Fig. 1, which correspond to a person with normal hearing.
The shape of the REP varies greatly between individu- als, particularly if their brains are not fully developed, eg
for children who show very large latencies. In the clinical practice, the majority of the cases exhibits an unusual AEP
patteirn that is difficult of detect for an operator, and thus a
r e a h n wim (60% HL) snd withcut stimulus
501 1
reacdon wim (4MB HL) ancl without stimulus 50
I
raactibn with (2CdE HL) & withcut stimulus
[image:3.617.102.295.94.369.2] [image:3.617.324.534.98.248.2]time/[ms]
Figure I: averages of 100 sweeps each, with (solid) and without (dotted) given stimulus (sine-burst of 1kHz).
The EEG for our work is a measured voltage between forehead and mastoid, which is pre-processed and sampled at 640 Hz. Synchronized to a stimulus, a sequence of 800 ms is recorded, yielding 512 samples. In the following sections, such a single synchronous sequence is termed sweep.
3. WAVELET ANALYSIS OF EEG
MEASUREMENTS
3.1. Applying the Wavelet Transform
A dyadic wavelet decomposition of sweeps uses Mallat’s pyramidal algorithm for multi-resolution analysis [6]. It is based on two sets of subspaces of L2(R), V,r; and 0 2 k r
where
. .
.VZk.+l 3 Vzk 3 v 2 k - 1 . . . and 0,;n
O p = 0, V i#
k E 2. V,k and 0 , k are mutually exclusive, VZk n 0 , k = 8, and their sum is dense in & k + l ,V2k U 0 , k =V Z k + l
,
Vk Ez. Furthermore,
V2kIk+oo
is dense in L2(R).Orthonormal bases for the spaces Vzk and 02r, are spanned
by wavelets $k,n(t) = 2 k ’ 2 $ ( 2 k ( t - - n ) ) and scaling functions
$ k + ( t ) = 2 ” I Z d ( P ( t - n)), respectively, for IC, n E Z.
A signal f ( t ) can be projected onto these subspaces of ILZ(R) by weighting the basis functions with coefficients a k ( n ) and - the wavelet coefficients - pk(n), which are calculated by scalar products of f ( t ) with $ k , n ( t ) and
& k p ( t )
,
respectively, yielding functions A 2 k f ( t ) and D,kf(t),Figure 2: pyramidal decomposition of a signal into coarser approximations A2k and details D2k (Mallat). The starting
sequence is A20 f( t).
where A,kf(t) E v z k is a coarse approximation of f ( t ) and D 2 k f ( t ) E 0 2 k is the detail information that is lost
when going from a less coarse approximation f ( t ) t o
A2*
f
( t ) .Mallat [6] derives an iterative computation of coeffi- cients: starting from a coefficient set c y o ( n ) of A , o f ( t ) , sub- sequently cyk(n) of coarser approximations can be obtained by lowpass filtering of the coefficients, while the wavelet coefficients p k - , ( n ) are yielded by a highpass filter oper- ation on c ~ k ( n ) . The filter Coefficients can be calculated in dependence on $ ( t ) and 4 ( t ) . The resulting pyramidal scheme for the computation of the wavelet coefficients is shown in Fig. 2. It can be implemented as a critically dec- imated octave filter bank. As the bases of V2k and 0 , k
are orthonormal, a unique inverse transform exists, which is calculated by going through the pyramidal algorithm in
a reverse direction.
A start sequence cro(n) of A , o f ( t ) should ideally be computed by scalar products of the continuous time signal, f ( t ) , with translated scaling functions q50,n(t-n>, n E Z. As
the time duration of $ ( f ) is comparably short to the wave lengths of interest, and because of
JTa
+(t)dt = 1 [7], we can intuitively view $ ( t ) as a Dirac impulse, such that the start sequence is simply the sampled discrete time versionSome problems arise, as the sweeps are finite intervals and important low frequency information is contained close to the beginning of a sweep. The analysis of the low fre- quencies requires a filter bank of considerable depth, such that with zero-padding most of the important features are distorted by transients. If the sweeps are extended periodi- cally, the filters a r e operated in steady state, distortions are
T R S ’ 9 6 475
To yield a qualitative measure for this intuitive differ- ence of distributions, we define a selectivity value. Based on two different conditional probability densities p(sla) and p(zlZ), where the random variable 5 is the value of the wavelet coefficient given that either a stimulus of a cer- tain level ( U ) or no stimulus (Q) has been presented to the expenmentee prior to recording a sweep, this value is cho- sen according to Fig. 4 . Assuming for the mean values
p+ >_ pzlx w.l.o.g., we measure the distributions P(zla) and 1 - P(zlZ) for every coefficient. By determining the intersection of both distributions, we find the optimum de- cision threshold zopt, at which we yield the total error to be
e = ( a +/3)/2, where a and ,f3 are the likelihoods for a false decision for a or Ti, under the assumption of equal likely Q and E. In case p r l a
<
ps[;;, the total error can be calculated from the intersection valiue e’ such that e = 1 - e’.The selectivity value now is this total minimum value, which covers the interval [0,0.5], with small values refer- ring to a good separability of the distribution, while values close to 01.5 indicate indifferent distributions. By setting a threshold for this selectivity value, wavelet coefficients can be distinguished by their relative frequencies to be “signif- icant” or “insig&cant” in contributing to an AEP. If the threshold is passed for any of the coefficients, an AEP is assumed in the EEG.
1st weffiaent
--1
2nd meffident
I --1
3rd coemaent
200 41m
--I
L. 6W 803x ->
[image:4.615.87.293.107.377.2] [image:4.615.326.509.352.500.2]X ->
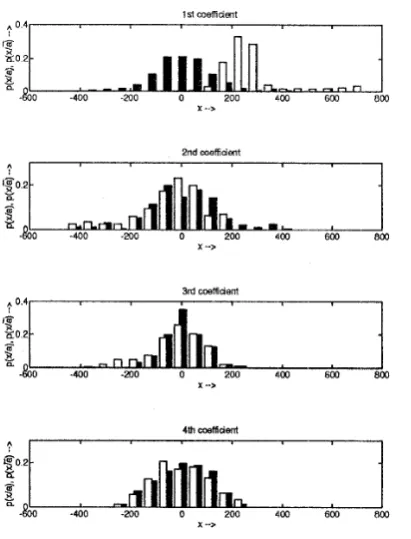
Figure 3: relative frequency distribution of wavelet coef- ficients of detail D2--7. The white bars refer to it given
stimulus, while filled bars mark sweeps without AEIP.
sweep sequence, although this imposes the restriction to use symmetric wavelets and hence linear phase filters only
[ 8 ] , and has slight implications for the linearity of the filter bank operation and the validity of Parseval’s Theorem [ 5 ] .
Apart from the symmetric wavelet described by MaUat [6],
symmetric biorthogonal wavelets listed in [El] and [‘3] have been used for the analysis, but however give poorer results.
3.2. P r o c e s s i n g of Transform Coeflicients
The reconstruction of single evoked potentials as proposed in [4] from certain transform coefficients proved useless for late AEPs because of their poor SNR. Flather than basing a method on a single sweep, we fall back upon the statistics of a number of successive sweeps.
Fig. 3 shows the relative frequency distribution of the four wavelet coefficients in detail D2-7 measured from 100 sweeps, where blanc and filled bars refer to sweeps wtth and without given stimulus, respectively. Obviously, the statis- tics of the first coefficient indicates a ‘difference between sweeps with a suspected AEP and sweeps that cannot con- tain a n AEP, while the distributions of the laker three coef- ficients are rather indifferent. It can therefore be concluded, that the first wavelet coefficient in contrilry to the others in
DZ-7 must be “significant” for an AEP.
Figure 4: two different probability densities (a) and the according distributions (b), from which the selectivity value is derived graphically.
3.3. Test R e s u l t s a n d R e c o n s t r u c t i o n
Tests on EEG measurement series obtained from 40 experi-
mentees have been carried ouh, of which about half the mea- surements have recorded the EEG without any given stim- ulus. Significant transform coefficients could almost only be found in the details D2-6 (4 coef., frequency band ap-
476 TFTS’ 96
response t o noise ratio
50
0
0.27
tone level 6odB(HL)
50
0
500 200 4M 6w 800
I
selectivity of wavelet coef.tone level 4MS(HL)
0.09
-7 I
lone level ZMB(HL)
5 0 ,
0
remnsrmciion
0
50
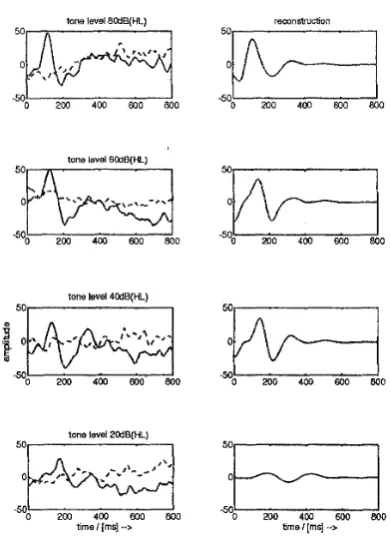
[image:5.614.96.292.108.378.2]0
Figure 5 : ensemble averages compared to reconstruction with relevant coefficients
4. C O N C L U S I O N
A new method for the recognition of late AEPs has been
presented. The DWT offers a good parameterization of
AEPs by a small number of coefficients, which is exploited to identify these coefficients by their distribution.
The examination of distributions includes 12 coefficients and is free of a n y assumptions concerning their distribu- tions or the latency of the AEP. The restriction to a lim-
ited frequency band is reasonable, as it has little effect on the recognition and improves speed greatly, such that data. can be evaluated on-line to the measurements. A new pos- sibility compared to other AEP indication methods is the reconstruction with significant coefficients by means of a n inverse transform.
Although an automatic recognition is still not possible,
as parameters like the threshold for decisions have to be chosen by an operator, as it has to be done with all tradi- tional means, the operator is given an additional support for his or her decision.
Current research examines the use of sequential testing
[lo]
to be included, ,which will add an analytic measure forthe statistical reliability and is thus expected to shorten the time of examinations, which would be very beneficial to patients.
5 . A C K N O W L E D G E M E N T S
The authors would like to thank T. Sporer, Lebrstuhl fiir Technische Elektronik, and M. Moser, Abteilung fiir Phoni- atrie und Padaudiologie, both a t Friedrich-Alexander Uni- versitat Erlangen-Niirnberg, for helpful comments, discus- sions, and technical support. This work is supported by a
grant from Friedrich-Alexander Universitat, Erlangen.
6. REFERENCES
G. H. Steeger. E i n Beitrag ZUF Verbesserung der Mes-
sung akustisch evozierter Potentiale variubler Latenz
im Elektroenzephalogramm des Menschen. Disserta-
tion, Universitat Erlangen-Niirnberg, Erlangen, 1979.
S. Hoth and C. Weber. “Kritische Wertung der
Horschwellenbestimmung mittels der Hirnrindenpo- tentiale, Teil 1”. Audiol. Akustik, pp.190-200, May 1990.
S. Hoth and 6. Weber. “Kritische Wertung der
Horschwellenbestimmung mittels der Hirnrindenpo- tentide, Teil 2”. Audiol. Akustik, pp.244-256, June 1990.
E. Bartnik, K. Blinowska, and P. Durka. “Single
evoked potential reconstruction by means of wavelet transform”. Biol. Cybern., 67:pp.175-181, 1992.
S.
Weii3. Rekonstruktion Akustisch Evozierter Poten-tiale. Diplomarbeit, Universitat Erlangen-Niirnberg, Erlangen, Dec. 1994.
S. G. Mallat. “A Theory for Multiresolution Signal
Decomposition: The Wavelet Representation”. IEEE
Trans. Pattern Anal. Muchine Intell., 11(7):pp.674- 692, July 1989.
P. Vaidyanathan. Multirate Systems and Filter Banks.
Pi-entice Hall, 1993.
I. Daubechies. Ten Lectures on Wavelets. SIAM,
Philadelphia, 1992.
M. Vetterli and C. Herley. “Wavelets and Filter Banks: Theory and Design”. IEEE Trans. SP, 40(9):pp.2207-
2232, Sept.1992.