Int. J. Electrochem. Sci., 12 (2017) 5604 – 5617, doi: 10.20964/2017.06.16
International Journal of
ELECTROCHEMICAL
SCIENCE
www.electrochemsci.org
Hierarchical Porous Carbon Microspheres Derived from
Biomass-Corncob as Ultra-High Performance Supercapacitor
Electrode
Lili Wang1, Yanting Li1, Kunlong Yang1, Wenqi Lu1, Jianguo Yu1, Jian Gao1, Gang Liao1, Yuning Qu1,*, Xiaofeng Wang2, Xifei Li3, Zhen Yin1,*
1
State Key Laboratory of Separation Membranes and Membrane Processes, School of Environment and Chemical Engineering, Tianjin Polytechnic University, 399 Binshui West Road, Tianjin 300387, P. R. China
2
State Key Laboratory of Inorganic Synthesis and Preparative Chemistry, College of Chemistry, Jilin University, Changchun 130012, P. R. China
3
Tianjin International Joint Research Centre of Surface Technology for Energy Storage Materials, College of Physics and Materials Science, Tianjin Normal University, Tianjin 300387, P. R. China
*
E-mail: [email protected], [email protected]
Received: 9 March 2017 / Accepted: 28 March 2017 / Published: 12 May 2017
The hierarchical porous carbon microspheres (HPCS) were obtained using corncob as precursor via a facile and cost-effective approach. The porous carbon microspheres exhibited regular spherical morphology, hierarchical porous, localized graphitization structure and the oxygen-containing functional groups on the surface of carbon spheres. The pore size and specific surface area could be tuned by the amount of KOH during the activation process. The porous carbon microspheres displayed maximum specific capacitance of 384.5 F/g at scan rate of 5 mV/s and ultra-high rate capacitance of 137.3 F/g at the current density of 100 A/g. The high capacitance retention of the porous carbon microspheres (over 97%, even with 5000 charge/discharge cycles) demonstrated its superior cycling stability. Moreover, high power density (62.9 kW/kg) and energy density (33.4 Wh/kg) could be achieved at 120 A/g. Hence, the ultrahigh specific capacitance and exceptional cyclic stability of the porous carbon microspheres indicate its significant potential application in the field of energy storage.
Keywords: Biomass, Carbon microspheres, Hierarchical pore, Supercapacitors
1. INTRODUCTION
fuels. Energy supply and environmental pollution have become two of the most significant challenges for sustainable development, especially for rapidly developing economies. In order to address these issues, the researchers have been striving to exploit clean and renewable resources, such as fuel cells [1,2] and solar cells, as well as developing environmentally-friendly, low-cost and advanced energy storage devices [3]. Most recently, supercapacitors have attracted increasing attention as alternative energy-storage systems due to their superior rate performance, high power densities, long-term cycling stability and good safety [4,5]. In general, for the supercapacitors, there have two different types, i.e. electrical double-layer capacitors (EDLCs) and pseudocapacitors. For the EDLCs, it has been widely used in portable electronic devices originating from their suitable pore size and high specific surface area [6,7]. Of course, the key factor of the EDLCs is the electrode materials. Carbon materials, such as graphene, carbon fibers and carbon spheres, are widely utilized as active electrode materials in EDLCs because of their non-toxicity, high chemical stability, high specific surface area and good electronic conductivity [8-10]. Among the above carbon materials, the porous carbon microspheres (PCS) have drawn extensive attention due to their unique properties, which can reduce the resistance of ion diffusion and the package porosity, thus benefiting the formation of ion buffer reservoirs and decrease of the ion diffusion distance [11,12]. Therefore, tremendous efforts have been devoted on the fabrication of PCS with regular geometry or tunable pore structure for high performance EDLCs.
In the present work, the carbon microspheres were prepared using corncob as carbon precursor via the low-temperature hydrothermal method, followed KOH activation in order to get the hierarchical porous structures. The carbon microspheres with tuned pore size exhibited the unique porous structure, rendering the carbon microspheres excellent supercapacitive properties. The electrochemical results showed the HPCS exhibited superior supercapacitive performance, i.e. high specific capacitance, ultra-high rate performance and outstanding cycling stability. Moreover, the fabricated symmertric supercapacitors with the porous carbon microspheres can also reveal high energy densities and power densities, confirming their potential application as electrode in capacitor device.
2. MATERIALS AND METHODS
2.1. Materials
Corncob were obtained from a corn mill nearby Tianjin. The corncob was sieved regular granules with the size of 120-150 μm and then dried at 90 oC overnight. H2SO4 and KOH were all of
analytical grade.
2.2. Preparation of HPCS
Firstly, the corncob were hydrolyzed with sulfuric acid (65 wt.%) with the ratio of corncob mass to the solution volume was 1:10 (g/mL). The hydrolysis reaction was carried out at 55 oC for 10 min. After above reaction, in order to obtain the solution with acid concentrations of 30%, water was added to the hydrolysis solution. After filtration, the filtrate was carbonized at 160 oC for 6 h to get carbon spheres by hydrothermal method. And then, the product were washed with distilled water until neutrality and dried at 110 oC for 12 h. The carbon spheres were pretreated in a tubular furnace at 500
o
C for 1 h under nitrogen atmosphere before activation. The pretreated carbon spheres were mixed with KOH in crucible, and the mass ratio of carbon spheres/KOH was 1:3, 1:4 and 1:5, then the mixture were heated up to 400 oC for 0.5 h, and then to 800 oC in furnace with nitrogen atmosphere for 1 h. Finally, the product was washed and dried to get the HPCS. Samples obtained at different mass ratio of carbon spheres/KOH were identified as HPCS-3, HPCS-4, and HPCS-5, respectively.
2.3. Materials characterization
Fisher Scientific K-Alpha spectrometer. The N2 adsorption-desorption isotherms were measured on
ASAP 2420 Micromeritics instrument.
2.4. Electrochemical Measurement
The preparation of working electrodes was similar to our previous work [30]. Briefly, the mass fraction of HPCS, polytetrafluoroethylene (PTFE, 60 wt%) and acetylene black were 80 wt%, 10 wt% and 10 wt% respectively, and then mixed in ethanol and ultrasonicated. Subsequently, slurry of the mixtures were pressed on the nickel foam. The obtained electrodes were dried at 110 oC for 12 h, and then soaked in 6 M KOH solution for 24 h. Finally, two electrodes were sandwiched into a coin cell (CR2032 type) for the electrochemical tests. The electrochemical tests, including cyclic voltammetry (CV), galvanostatic charge/discharge and electrochemical impedance spectroscopy (EIS) tests were carried out with a Zennium-IM6 electrochemical station. The EIS were conducted with frequency range between 1 Hz and 82.5 kHz, which were analyzed with Nyquist plots. The specific capacitance values (Cs, F/g) were estimated from CV curves by equation (1) [10]:
V m
Cs 4A (1)
where A is the integrating area of CV curves, m (g) represents total mass of the active materials, ΔV and υ are the potential window and scan rate, respectively.
For the two electrode cells, the specific capacitance values can be calculated from galvanostatic charge/discharge (GCD) with the equation (2) [10, 29]:
V m
t I Cs
4 (2)
Where I is the constant current (A), Δt is the discharge time (S), m is the whole mass (g) of electrode materials and ΔV is the voltage change during the discharge process (V).
The energy density (E) and power density (P) can be calculated from the specific capacitance values (Cs) with the following equations: [30-32]:
2
2 1
V Cs
E (3)
t E
P (4)
Where Cs is the specific capacitances, t is the discharge time, and ΔV is the voltage change subtracted the IR drop during the discharge process.
3. RESULTS AND DISCUSSION
3.1. Characterisation of the HPCS
carbon microspheres through hydrothermal carbonization. Finally, the hierarchical porous structures in carbon microspheres were formed after KOH activation process.
[image:5.596.93.506.307.652.2]Scheme 1. Schematic diagrams illustrate the preparation process of hierarchical porous carbon microspheres.
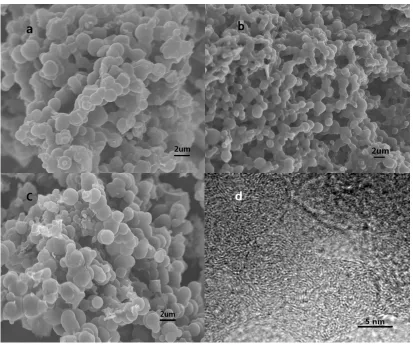
Figure 1. SEM images of (a) HPCS-3, (b) HPCS-4, (c) HPCS-5 and (d) HR-TEM image of HPCS-4.
HR-TEM image of the HPCS-4 (Fig. 1d) confirmed that the carbon spheres had developed pore structure and localized ordered structure of graphite. Obviously, the regular morphology, smooth surface, good liquidity, developed pores and localized graphite structure in carbon microspheres would enhance electrochemical performance of EDLCs due to the package porosity among the carbon spheres, which would reduce the resistance and distance of ion diffusion, facilitate the generation of ion buffer reservoirs.
10 20 30 40 50 60 70 80
2 Theta (degree)
HPCS-3 HPCS-4 HPCS-5 In te n sity ( a.u .)
a
400 600 800 1000 1200 1400 1600 1800 2000
b
In te n si ty (a.u .)Raman Shift (cm-1)
HPCS-3 HPCS-4 HPCS-5
0 400 800 1200
c
O1s C1s In te n sit y ( a .u .)Binding energy (eV)
HPCS-3 HPCS-4 HPCS-5
280 284 288 292
d
Raw intensity Peak sumBackground Peak graphite Peak -C-O Peak -C=O Peak -COOH In te n sit y ( a .u .)
Binding energy (eV)
Raw Intensity Peak Sum Background Peak 1
280 284 288 292
In te n sit y ( a .u .)
Binding energy (eV)
Raw intensity Peak sum Background Peak graphite Peak -C-O Peak -C=O Peak -COOH
e
280 284 288 292
f
Raw intensityPeak sum Background Peak graphite Peak -C-O Peak -C=O Peak -COOH In te n sit y ( a .u .)
Binding energy (eV)
Raw Intensity Peak Sum Background Peak 1
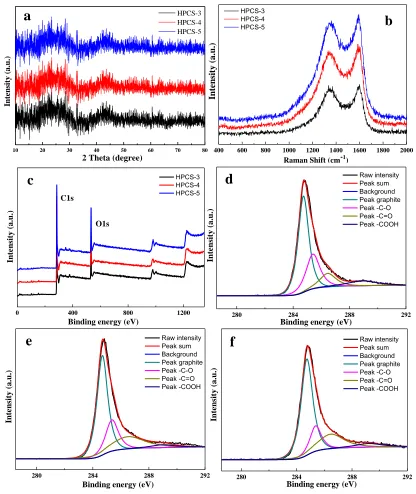
Figure 2. (a) XRD patterns, (b) Raman spectra and (c) XPS spectrum of the HPCS, and high resolution spectrum of C1s for (d) HPCS-3, (e) HPCS-4 and (f) HPCS-5.
[image:6.596.90.506.187.681.2]
be assigned to the (002) plane of graphite. The peak at around 44o belong to the (101) plane of graphitic layers [30]. Obviously, the intensity of these two peaks reduced with the increase of KOH amount, meaning the graphite layers could be destroyed seriously with more alkaline. Of course, it would create more pores in HPCS due to the etching reaction [33]. Meanwhile, the Raman characterization was adopted in order to further characterize the graphitization of the HPCS. Raman spectra of HPCS (Fig. 2b) displayed two typical peaks, i.e. the D-band located ~1,340 cm-1 and a G-band ~1,590 cm-1, ascribed to the vibration of disordered carbon atoms with defects and sp2-bonded carbon atoms in a two-dimensional hexagonal lattice, which were correspond to the disordered degree and graphitized degree, respectively. The intensity ratios of D band to G band (ID/IG) of HPCS-3,
HPCS-4 and HPCS-5 were 0.96, 0.93 and 0.94, respectively. The lower ID/IG ratio reveals a higher
graphitized degree for the HPCS-4 [34]. These results demonstrated that the excessive amount of KOH (1:5) would be harmful to the graphitization of carbon.
The surface property of HPCS was further analyzed by XPS spectra. The fully scanned spectrum of the HPCS exhibited two peaks at 284.4 eV and 532.9 eV (Fig. 2c), which correspond to C1s and O1s, respectively. The fitted high-resolution spectra of C1s for HPCS-3, HPCS-4 and HPCS-5 (Fig. 2d-f) can be deconvoluted into four components with the binding energy at about 284.6, 285.4, 286.5 and 289.0 eV, corresponding to graphite carbon, −C−O−, −C=O, and −COOH groups, respectively [35,36]. For HPCS-3, the mass percentage of graphite carbon, −C−O−, −C=O, and −COOH groups were 54.9, 25.9, 11.7 and 7.5, respectively; 54.9, 20.7, 21.0 and 3.4 % for HPCS-4, respectively; 59.5, 15.6, 20.1 and 4.8% for HPCS-5, respectively. The content of −C−O− and −C=O groups for HPCS-3, HPCS-4 and HPCS-5 were 37.6, 41.7 and 35.7%, respectively, indicating the maximum amount of oxygen-containing functional groups on the surface of HPCS-4 occurred after activation. These functional groups could improve the wettability of the carbon microshperes and lower the diffusion resistance of electrolytes [37].
0.0 0.2 0.4 0.6 0.8 1.0 0 100 200 300 400 500 600 700
0.4 0.6 0.8 1.0
550 560 570 580 590 600 610 A m o u n t o f a d so r b e d N 2 (cm
3/g)
Relati ve pressure, P/Po
HPCS-4
a
A m oun t of adsorbed N 2 (cm 3/g )Relati ve pressure, P/Po
HPCS-3 HPCS-4 HPCS-5
0 2 4 6 8
0.0 0.5 1.0 1.5 2.0 2.5 3.0 d V/ d D (cm
3 g -1nm -1)
Pore Width (nm)
[image:7.596.92.505.497.649.2]HPCS-3 HPCS-4 HPCS-5
b
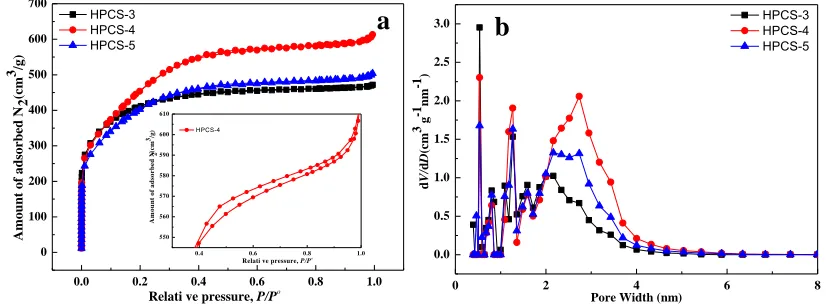
Figure 3. (a) N2 adsorption/desorption isotherms and (b) the pore size distribution curves of the HPCS.
Inset was the N2 adsorption/desorption isotherms at higher relative pressure (>0.4) for the
HPCS-4.
Fig. 3a should be classified into type I and IV [19]. The amount of adsorbed N2 rapidly increased even
at relative pressure lower than 0.1, confirming the existence of microporous structures in carbon microspheres due to the reaction between carbon and alkaline. At relative pressures larger than 0.1 to 0.3, the amount of adsorbed N2 rise smoothly. Moreover, a slight hysteresis loop displayed at larger
relative pressure of higher than 0.4, confirming the massive mesopores in the carbon microsphere [38], especially for the HPCS-4 (inset of Figure 3a). Furthermore, a slight increase of adsorbed amount observed at the relative pressure close to 1, meaning existence of macropores [30].
Table 1. Parameters of the pore structure of HPCS.
Sample
SBET
(m2/g)
Smicro
(m2/g)
Smecro
(m2/g)
Vtot
(cm3/g)
Vmicro
(cm3/g)
Vmecro
(cm3/g) D (nm)
HPCS-3 1419 521 493 0.729 0.297 0.254 2.05
HPCS-4 1652 733 586 0.948 0.416 0.385 2.31
HPCS-5 1440 594 428 0.771 0.318 0.267 2.17
Note: SBET: Specific surface area from multiple BET method.
Smicro, Vmicro : Micropore surface area and micropore volume from t-plot method.
Smeso, Vmicro : Mecropore surface area and mecropore volume from BJH method.
Vtot: Total pore volume at P/P0=0.99.
D: Average pore diameter.
3.2. Electrochemical performance
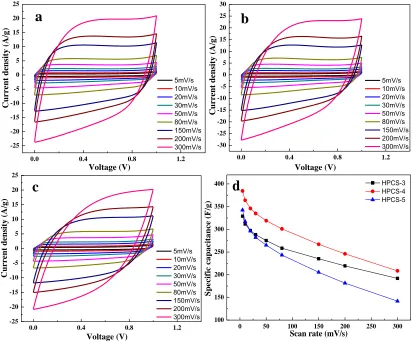
The cyclic voltammetry (CV), galvanostatic charge-discharge (GCD), and the electrochemical impedance spectroscopy (EIS) tests were carried out by a two-electrode system at room temperature to investigate the electrochemical performances of the porous carbon microspheres. The CV curves of HPCS were shown in Fig. 4a-c with different scan rates between 5 and 300 mV/s within the operating voltage of 0-1 V in KOH. All of the CV curves displayed good rectangular shape without obvious redox peaks, exhibiting the capacitive features of the electrochemical double layer. CVs of HPCS-3 and HPCS-4 maintained good rectangular-like shape at different scan rates (5-300 mV/s), indicating excellent rate capability and reversibility. As shown in Fig. 4d, the specific capacitance of HPCS-3, HPCS-4 and HPCS-5 were 328.9, 384.5 and 342.4 F/g at 5 mV/s, respectively. The specific capacitance would decline with the increase of scan rate. At 300 mV/s scan rate, the specific capacitance of HPCS-3, HPCS-4 and HPCS-5 decreased to 191.9, 208.3 and 141.6 F/g, respectively. Obviously, the HPCS-4 exhibited the largest specific capacitance from 5 to 300 mV/s, indicating quick ion diffusion into the electrochemically active surface and great capacitive behavior of electrode with fast charge-discharge operations mode [12], consistent with its pore structures.
0.0 0.4 0.8 1.2
-25 -20 -15 -10 -5 0 5 10 15 20 25 C u rr en t d en sit y ( A /g ) Voltage (V) 5mV/s 10mV/s 20mV/s 30mV/s 50mV/s 80mV/s 150mV/s 200mV/s 300mV/s
a
0.0 0.4 0.8 1.2 -30 -25 -20 -15 -10 -5 0 5 10 15 20 25 30
b
C u rr en t d en sit y ( A /g ) Voltage (V) 5mV/s 10mV/s 20mV/s 30mV/s 50mV/s 80mV/s 150mV/s 200mV/s 300mV/s0.0 0.4 0.8 1.2 -25 -20 -15 -10 -5 0 5 10 15 20 25
c
C u rr en t d en sit y ( A /g ) Voltage (V) 5mV/s 10mV/s 20mV/s 30mV/s 50mV/s 80mV/s 150mV/s 200mV/s 300mV/s0 50 100 150 200 250 300 100 150 200 250 300 350
400
d
HPCS-3HPCS-4 HPCS-5 S p e c if ic c a p a c it a n c e ( F /g )
[image:9.596.92.507.353.695.2]Scan rate (mV/s)
0 20 40 60 80 100 120 -0.2 0.0 0.2 0.4 0.6 0.8 1.0 1.2 Voltage (V)
Test time (s)
2A/g 5A/g 10A/g 20A/g 50A/g 80A/g 100A/g 120A/g 150A/g a
0 20 40 60 80 100 120 140 160 120 140 160 180 200 220 240 b S p ec if ic c a p a cit a n ce ( F /g )
Current density (A/g)
0 5000 10000 15000 20000 120 140 160 180 200 220 240 260
c
20A/g 10A/g 5A/g S p e c if ic c a p a c it a n c e ( F /g ) Cycle number 2A/g 5A/g 10A/g 20A/g 2A/g 10 100 0.1 1 10 100 dPower densidy (KW/kg)
Energy density (Wh/kg)
P-E
1.0 1.5 2.0 2.5 3.0 0.0 0.2 0.4 0.6 0.8 -Z '' /o h m Z'/ohm
Before GCD cycles After GCD cycles
e
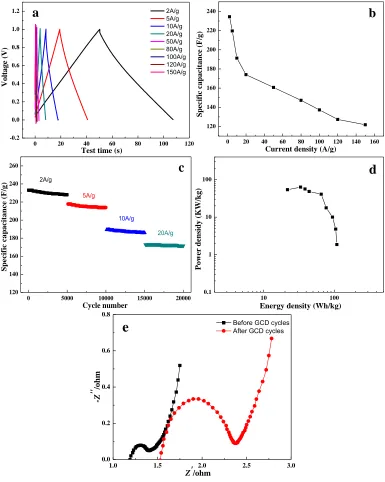
Figure 5. (a) The GCD curves of HPCS-4 at current densities of 2-150 A/g, (b) The specific capacitances of HPCS-4 at current densities of 2-150A/g, (c) The cycling stability of HPCS-4 at 2, 5, 10 and 20 A/g, (d) Ragone plots of HPCS-4 symmetric cell at current densities of 2-150 A/g and (e) Nyquist plots of HPCS-4 measured before and after GCD cycles.
[image:10.596.106.491.71.553.2]
of 137.3 F/g at 100 A/g, corresponding to 58.6% capacitance retention. A high specific capacitance of 121.8 F/g was still achieved even at a higher current density of 150 A/g, corresponding to high capacitance retention of 52.0%. In fact, at lower current density, the higher micropore surface area enhances charge accumulation and the ions have enough time to diffuse into the micropores, therefore the higher specific capacitance can be obtained. However, it was difficult for the ions to diffuse into the internal micropores at relatively high current densities, leading to a drop in the specific capacitance [44]. Although the specific capacitances of HPCS-4 slightly decreased with the increase of current densities, the higher specific capacitance of 137.3 and 121.8 F/g could be obtained even at the current density of 100 and 150 A/g, respectively. The main reason was that the abundant mesopores and small amount of macropores facilited the transport of ions through these pores to the surface micropores.
The continuously long-term cycling tests of HPCS-4 were carried out over 20000 GCD cycles, namely every 5000 cycles at four different current density (2, 5, 10 and 20 A/g), in order to investigate the rate performance with varied current densities. As shown in Fig. 5c, the specific capacitances of HPCS-4 at different current density of 2, 5, 10 and 20 A/g were 234.4, 219.6, 191.2 and 174.1 F/g, respectively, confirming the excellent rate performances of the carbon microspheres. A high capacity retention of over 97 % with 5000 GCD cycles at each current density revealed the good cycling stability of the carbon microspheres. Therefore, the porous carbon microsphere derived from biomass could be one of the most promising supercapacitor materials.
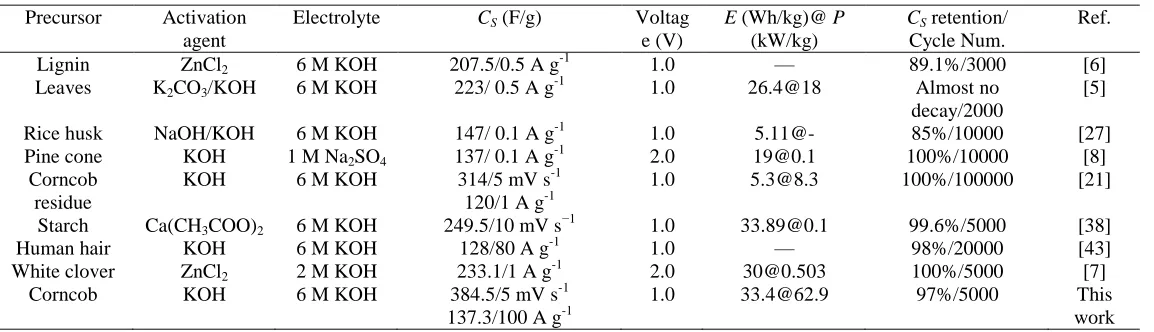
[image:11.596.15.592.589.755.2]Meanwhile, the energy density and power density of the supercapacitors assembled with HPCS-4 at various current densities (2-150 A/g) under working voltage of 1.0 V can be calculated from the GCD curves via the equations (3) and (4). The high energy density of 108.9 Wh/kg and power density of 1.86 kW/kg were obtained at 2 A/g current density (Fig. 5d). The energy density will decrease with the current density increasing, but the power density can raise. When the current density up to 50 A/g, the energy density and power density were 65.4 Wh/kg and 40.7 kW/kg, respectively. When the current density was increased to 120 A/g, the energy density could lower to 33.4 Wh/kg, however, the power density raise to 62.9 kW/kg. In addition, it is worth to note that the energy density and power density of supercapacitors using HPCS-4 as the electrodes exhibited much higher value than that of recently reported supercapacitors (Table 2).
Table 2. Comparison of carbon materials for supercapacitor electrodes.
Precursor Activation
agent
Electrolyte CS (F/g) Voltag
e (V)
E (Wh/kg)@ P
(kW/kg)
CS retention/
Cycle Num.
Ref.
Lignin ZnCl2 6 M KOH 207.5/0.5 A g-1 1.0 — 89.1%/3000 [6]
Leaves K2CO3/KOH 6 M KOH 223/ 0.5 A g-1 1.0 26.4@18 Almost no
decay/2000
[5]
Rice husk NaOH/KOH 6 M KOH 147/ 0.1 A g-1 1.0 5.11@- 85%/10000 [27]
Pine cone KOH 1 M Na2SO4 137/ 0.1 A g-1 2.0 [email protected] 100%/10000 [8]
Corncob residue
KOH 6 M KOH 314/5 mV s-1
120/1 A g-1
1.0 [email protected] 100%/100000 [21]
Starch Ca(CH3COO)2 6 M KOH 249.5/10 mV s−1 1.0 [email protected] 99.6%/5000 [38]
Human hair KOH 6 M KOH 128/80 A g-1 1.0 — 98%/20000 [43]
White clover ZnCl2 2 M KOH 233.1/1 A g
-1
2.0 [email protected] 100%/5000 [7]
Corncob KOH 6 M KOH 384.5/5 mV s-1
137.3/100 A g-1
1.0 [email protected] 97%/5000 This
EIS test was further performed to investigate the charge transport and ion diffusion of the electrode materials. The Nyquist plots of the symmetrical two-electrode cell assembled with HPCS-4 was shown in Fig. 5e before and after the GCD cycles. The nearly vertical lines in low frequency region suggested a short Warburg diffusion region and excellent capacitive property of HPCS-4 [19]. In the high-frequency region, the semicircle corresponded to the interfacial charge transfer resistance (Rct). The internal resistance (Rs) was represented by the intercept points with real axis, including the
contact resistance between electrode materials and electrolyte, inherent resistance of materials, and ionic resistance. The Rct values can be obtained from the EIS data fitting via ZSimpWin. The Rct
values before and after the GCD cycles were 0.2585 Ω and 0.7558 Ω, respectively, indicating the low resistance and good electrical conductivity of the porous carbon microspheres. The Rs values before and after the GCD cycles were 1.184 Ω and 1.561 Ω, respectively. The slight increase of the Rs value suggested the declined compact degree between the current collector and the electrode material along with the cycles [38]. Hence, the outstanding capacitive performance of HPCS can be ascribed to the combined structure advantages of regular morphology with smooth surface, certain amount of oxygen-containing functional groups, high surface area, hierarchical pores deriving from the KOH activation. Hence, the biomass-corncob derived carbon microspheres possessed superior supercapacitors performances, which could be an ideal candidate for supercapacitor electrode material.
4. CONCLUSION
One simple and cost-effective hydrothermal carbonization procedure coupling with KOH activation process has been developed to fabricate the carbon microspheres with hierarchical porous structures (HPCS) based on the biomass-corncob. The HPCS possessed unique regular spherical morphology, oxygen-containing functional groups and developed hierarchical pore structure with micropores, mesopores and macropores. Meanwhile, the obtained HPCS exhibited superior capacitive performance with high specific capacitance, ultra-high rate capability and superior long-term cycle stability through controllable alkaline activation process. Furthermore, the enhancement of power density and energy density of HPCS would satisfy the increasing demands of energy storage devices. Hence, the development of porous carbon microspheres with high capacity derived from crude biomass-corncob is significantly promising for future design of biomass-derived carbons in specific energy applications. In addition, our work would pave the way for utilization in large-scale and high value added conversion of biomass waste in industry.
ACKNOWLEDGMENTS
References
1. Z. Yin, L. Lin, D. Ma, Catal. Sci. Technol. 4 (12) (2014) 4116-4128.
2. Z. Yin, H. Zheng, D. Ma, X. Bao, J. Phys. Chem. C 113 (3) (2009) 1001-1005. 3. J. Deng, M. Li, Y. Wang, Green Chem. 18 (2016) 4824-4854.
4. L. Zhang, Y. Jiang, L.Wang, C. Zhang, S. Liu, Electrochim. Acta 196 (2016) 189-196. 5. Y. Li, Y. Pi, L. Lu, S. Xu, T. Ren, J. Power Sources 299 (2015) 519-528.
6. L. Li, X. Wang, S. Wang, Z. Cao, Z. Wu, H. Wang, Y. Gao, J. Liu, Electroanalysis 28 (2016) 243-248.
7. G. Ma, Z. Zhang, K. Sun, H. Peng, Q. Yang, F. Ran, Z. Lei, RSC Adv. 5 (2015) 107707-107715. 8. A. Bello, N. Manyala, F. Barzegar, A. A. Khaleed, D. Y. Momodu, J. K. Dangbegnon, RSC Adv. 6
(2016) 1800-1809.
9. Y. K. Lv, L. H. Gan, M. X. Liu, W. Xiong, Z. J. Xu, D. Z. Zhu, D. S. Wright, J. Power Sources 209 (2012) 152-157.
10. I. M. D. Salas, Y. N. Sudhakar, M. Selvakumar, Appl. Surf. Sci. 296 (2014) 195-203. 11. J. Zhang, J. Zhou, D. Wang, L. Hou, F. Gao, Electrochim. Acta 191 (2016) 933-939.
12. W. Lu, M. Liu, L. Miao, D. Zhu, X. Wang, H. Duan, Z. Wang, L. Li, Z. Xu, L. Gan, Electrochim. Acta 205 (2016) 132-141.
13. J. Liu, T. Yang, D. Wang, G. Lu, D. Zhao, S. Qiao, Nat. Commun. 4 (2013) 2798-2804. 14. A.B. Fuertes, P. Valle-Vigón, M. Sevilla, Chem. Commun. 48 (2012) 6124-6126.
15. M. Liu, J. Qian, Y. Zhao, D. Zhu, L. Gan, L. Chen, J. Mater. Chem. A. 3 (2015) 11517-11526. 16. J. Choma, D. Jamioła, K. Augustynek, M. Marszewski, M. Gao, M. Jaroniec, J. Mater. Chem. 22
(2012) 12636-12642.
17. L. Pang, B. Zou, Y. Zou, X. Han, L. Cao, W. Wang, Y. Guo, Colloid. Surface. A. 504 (2016) 26-33.
18. L. Yao, G. Yang, P. Han, Z. Tang, J. Yang, J. Power Sources 315 (2016) 209-217. 19. S. Du, L. Wang, X. Fu, M. Chen, C. Wang, Bioresour. Technol. 139 (2013) 406-409.
20. Y. Fan, P. Liu, Z. Yang, T. Jiang, K. Yao, R. Han, X. Huo, Y. Xiong, Electrochim. Acta 163 (2015) 140-148.
21. W. Qu, Y. Xu, A. Lu, X. Zhang, W. Li, Bioresour. Technol. 189 (2015) 285-291. 22. L. Mao, L. Zhang, N. Gao, A. Li, Green Chem. 15 (2013) 727-737.
23. Y. Li, T. Wang, X. Yin, C. Wu, L. Ma, H. Li, Y. Lv, L. Sun, Renew. Energy 35 (2010) 583-587. 24. H. Ma, J. Li, W. Liu, M. Miao, B. Cheng, S. Zhu, Bioresour. Technol. 190 (2015) 13-20.
25. R. Farma, M. Deraman, A. Awitdrus, I.A. Talib, E. Taer, N.H. Basri, Bioresour. Technol. 132 (2013) 254-261.
26. W. T. Huang, H. Zhang, Y. Q. Huang, W. K. Wang, S. C. Wei, Carbon 49 (2011) 838-843. 27. E. Y. L. Teo, L. Muniandy, E. Ng, F. Adam, A. R. Mohamed, R. Jose, K. Chong, Electrochim.
Acta 192 (2016) 110-119.
28. H. Peng, G. Ma, K. Sun, Z. Zhang, Q. Yang, Z. Lei, Electrochim. Acta 190 (2016) 862-871. 29. K. Huang, M. Li, Z. Chen, Y. Yao, X. Yang, Electrochim. Acta 158 (2015) 306-313.
30. Y. Zhang, M. Jia, H. Gao, J. Yu, L. Wang, Y. Zou, F. Qin, Y. Zhao, Electrochim. Acta 184 (2015) 32-39.
31. G.A. Ferrero, M. Sevilla, A.B. Fuertes, Carbon 88 (2015) 239-251.
32. C.W. Lee, S. B. Yoon, H. K. Kim, H.C. Youn, J. Han, K. C. Roh, K. B. Kim, J. Mater. Chem. A 3 (2015) 2314-2322.
33. J. Wang, S. Kaskel, J. Mater. Chem. 22 (2012) 23710-23725.
38. Y. Zhang, M. Jia, J. Yu, J. Fan, L. Wang, Y. Zou, Y. Zhao, J Solid State Electrochem 20 (2016) 733-741.
39. C. Largeot, C. Portet, J. Chmiola, P.L. Taberna, Y. Gogotsi, P. Simon, J. Am. Chem. Soc. 130 (2008) 2730-2731.
40. L. Eliad, G. Salitra, A. Soffer, D. Aurbach, J. Phys. Chem. B 105 (2001) 6880-6887.
41. Y. F. Zhao, W. Ran, J. He, Y. F. Song, C. M. Zhang, D. B. Xiong, F. Gao, J. Wu, Y.Xia, ACS Appl. Mater. Interfaces 7 (2015) 1132-1139.
42. C. Zhang, W. Lv, Y. Tao, Q.H. Yang, Energy Environ. Sci. 8 (2015) 1390-1403.
43. W. J. Qian, F. X. Sun, Y. H. Xu, L. H. Qiu, C. H. Liu, S. D. Wang, F. Yan, Energy Environ. Sci. 7 (2014) 379-386.
44. Z. Qiao, M. Chen, C. Wang, Y. Yuan, Bioresour. Technol. 163 (2014) 386-389.