Illusory Correlation: Interplay of Evaluative Group
Impression and Item-specific Episodic Memory
Auretta Sonia Kummar
Supervisor: Dr Dirk Van Rooy
Submitted in partial fulfilment of the requirements for the Honours program in Psychology in the Research School of Psychology, The Australian National University.
October 2014
Statement of Shared Data
Findings from the current study were obtained in collaboration with the study by Alex Roach, whose study was also conducted in partial fulfillment of the requirements for the Honours program in Psychology in the Research School of Psychology at the Australian National University. Whilst the current study was interested in the different mechanisms that lead up to Illusory Correlation (IC), the study conducted by my colleague
investigated the IC trend by manipulating the number of statements presented to participants. As such, participants were presented with three different blocks of statements: Block 1 (9 statements), followed by Block 2 (36 statements) and finally, Block 3 (54 statements). After each block, participants engaged in a Trait Rating task and a Group Assignment task. The current study however, is specific to the findings of these tasks in Block 2 only. Thus, the Group Assignment task in Block 2 varied from that in Block 1 and 3, such that, it included decoy statements, which were required for the analysis of item-specific episodic memory in the current study and not in the study conducted by my colleague. The Trait Rating task was the same across all three blocks. In short, only data collected from the second part of this three-part experiment
Acknowledgements
In my journey with Psychology, this year has indeed been one of the most
challenging years. Having said that, it has nonetheless been a rewarding experience and I could not have done it without a few people, whom I must mention.
First and foremost, to my thesis supervisor - Dr Dirk Van Rooy, thank you for your guidance, during which I have been challenged to uptake responsibilities
independently and have come to push myself beyond the usual boundaries. I also wish to thank Eric Tran, for playing the role of my ‘Second Thesis Supervisor,’ and for always providing enlightening feedback whenever I was in doubt.
To my esteemed colleague and partner in crime, Alex Roach. Without a doubt, this whole thesis process has been that much more enjoyable having had been able to share this ride through Illusory Correlation with you!
I would also like to specially thank Dr Dev RoyChowdhury, for being a good friend and mentor. Our numerous conversations on Psychology and life in general have opened my eyes to the infinite limits into, which I can further pursue my relationship with Psychology.
To my parents, Danny and Ananthi Kummar, no words would suffice in expressing how grateful I am for the uncountable sacrifices you have made in turning my childhood dream of Psychology into a reality. To my sister, Michelle, thank you for always believing in me and for inspiring me to be everything and more.
A big thank you to my fantastic group of friends both here and in Malaysia, especially: ‘my sisters from another mother’ - Shekinah Grace and Ayswaria Kumar; and ‘the brothers I never had’ – Bryan Neo and Luke Wright; for lifting up my spirits whenever the going got tough!
Table of Contents
Statement of Shared Data ... i
Acknowledgements ... iii
Table of Contents ... iv
Table of Tables ... vi
Table of Figures ... vi
Abstract ... vii
Introduction ... 1
Distinctiveness Based Model ... 2
Availability and Memory... 3
Exemplar Based Memory ... 4
Information Loss Account ... 5
Differentiation Approach ... 6
Attention Theory ... 7
Multiple Component Model ... 9
Current Study ...12
Method ...17
Participants ...17
Design ...17
Materials ...17
Procedure ...19
Trait rating task ...19
Group assignment task. ...19
Data Analyses ...20
Evaluative group impression. ...20
Item-specific episodic memory. ...22
Results ...25
Evaluative Group Impression ...25
Trait rating ...25
Group assignment ...27
Item-specific Episodic Memory ...29
Group assignment latency ...29
Group assignment accuracy ...35
Signal detection analysis ...38
Discussion ...38
Evaluative Group Impression ...39
Item-specific Episodic Memory ...43
General Discussion ...46
Limitations ...51
Future Research...51
Conclusion ...52
References ...54
Appendix A ...62
Appendix B ...63
Appendix C ...64
Appendix D ...65
Appendix E ...66
Table of Tables
Table 1 Distribution of Stimulus Statements in Hamilton & Gifford (1976) ... 2
Table 2 Design of the Current Study ...13
Table 3 Distribution of Statements in the Current Study ...18
Table 4 Results from 2 X 2 Repeated Measures ANOVA: Trait Rating ...26
Table 5 Results from 2 X 2 Repeated Measures ANOVA: Group Assignment a ...29
Table 6 Interaction of Common Trait with Trait in 2 X 2 X 2 Mixed ANOVAs ...31
Table 7 Results from 2 X 2 X 2 Mixed ANOVA: Latency – Overall Assignment ...32
Table 8 Results from 2 X 2 Mixed ANOVAs: Overall Assignment – Simple Main Effects ...33
Table 9 Results from 2 X 2 X 2 Mixed ANOVA: Latency – Accurate Assignment ...34
Table 10 ...34
Results from 2 X 2 Mixed ANOVAs: Accurate Assignment – Simple Main Effects ...34
Table 11 Results from 2 X 2 X 2 Mixed ANOVA: Latency – Inaccurate Assignment ...35
Table of Figures Figure 1. Multiple Component Model ...10
Figure 2. Strength of Group-Trait evaluative links. ...15
Figure 3. Predicted results of IC as measured through evaluative measures...21
Figure 4. Predicted results for group assignment accuracy. ...23
Figure 5. Predicted results for memory sensitivity as measured using a multilevel Signal Detection Analysis. ...25
Figure 6. Results from the Trait Rating task. ...27
Figure 7. Interaction of Group with Trait on accuracy scores. ...37
Figure 8. Results found on the evaluative links of IC. ...41
Abstract
Illusory Correlation (IC) is the perception that two events are associated with each other, when in reality they are not. The current study tested predictions of the Multiple
Component Model (MCM) regarding the role different types of information (i.e., evaluative and item-specific information) play in producing the IC effect. The current study extended previous experiments on IC, particularly that by Van Rooy,
Vanhoomissen and Van Overwalle (2013), in using two independent trait dimensions (i.e., Common Trait and Rare Trait), rather than the traditionally used one evaluative dimension (i.e., frequent, desirable vs. infrequent, undesirable behaviours). The MCM predicted that, judgements based on evaluative information, would result in an
association between the majority group and the common trait (Majority-Common Trait), whereas the minority group would be associated with the rare trait (Minority-Rare Trait). For judgements based on item-specific episodic memory, the MCM predicted enhanced memory amongst participants for Minority-Rare Trait statements. Partial support was found for both predictions: Participants did develop a Majority-Common Trait association, but no particular association was formed with the minority group. Additionally, participants did show enhanced memory for Minority-Rare Trait
statements. However, they also showed unexpected enhanced memory for Majority-Rare Trait statements. Together, the current results further elucidate the interplay of
Introduction
“Why do they hate us?” He paused. “We didn't do anything wrong.”
-Shannon Thompson, November Snow
The social environment, in which we live in, is one that is complex with various events occurring at once; and as social beings, we find ourselves in a meaning seeking pursuit of these events. In doing so however, we sometimes perceive two events to be associated with each other when in reality, they are not. This inaccurate perception, which stems from the field of Social-Cognitive Psychology is termed, Illusory
Correlation (IC, Chapman, 1967). For instance, the fear of approaching someone due to the perception that members of his community are involved in violent criminal acts, is an example of IC. Deriving from this same logic, IC has been suggested to contribute towards stereotyping (Hamilton & Gifford, 1976), minority discrimination (Hamilton & Gifford, 1976) and including, inaccurate clinical diagnoses (Chapman & Chapman, 1967; Dawes, 1989).
Table 1
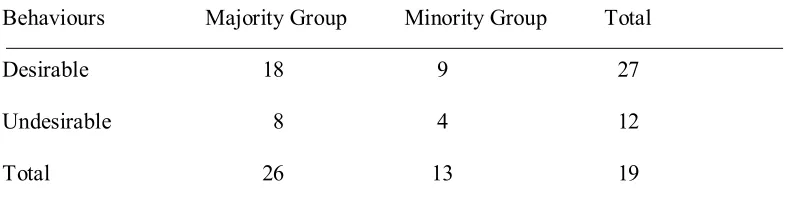
Distribution of Stimulus Statements in Hamilton & Gifford (1976)
Over the years, the research area on IC has extended such that various theories and models have been proposed with the aim of explaining the mechanims that underlie and thus, cause the IC effect. Yet, there is still a lack of definitive conceptual
understanding of this phenomenon. Hence, these theories and models are first explored in respect to the development of the current study.
Distinctiveness Based Model
The dominant theory used in explaining the IC effect is the Distinctiveness Based Model (DBM), proposed by Hamilton and Gifford (1976). This model assumes that the co-occurrence of two distinctive items leads to the perception that they are associated, whereby distinctiveness refers to infrequent occurring items. Specifically, this model suggests that when two distinctive items co-occur (i.e., minority groups and infrequent undesirable behaviours), they are salient to perceivers, which leads to better encoding of these items in memory, and therefore the idea that they are correlated (Hamilton & Gifford, 1976).
Various studies have been able to provide empirical support for this model. In particular, studies have found participants to over attribute infrequent, undesirable behaviours to the minority group (Johnson & Mullen, 1994), spend more time reading statements of undesirable behaviours engaged by members of the minority group (Stroessner, Hamilton & Mackie, 1992), recall more infrequent, undesirable behaviours Behaviours Majority Group Minority Group Total
Desirable 18 9 27
Undesirable 8 4 12
of the minority group (Hamilton, Dugan & Trolier, 1985) and were faster in assigning undesirable behaviours to the minority group (Johnson & Mullen, 1994; McConnell, Sherman & Hamilton, 1994a). Further support for the DBM were found by studies, which revealed a significant correlation between the extent of IC and the assignment latencies for the infrequent, undesirable behaviours of the minority group (Johnson & Mullen, 1994) and also with the recall of infrequent, undesirable behaviours of the minority group (Hamilton et al., 1985).
Despite the numerous empirical support for the DBM, Fiedler (1991) raised the argument that the DBM’s assumption on what is ‘distinctive’ might be confounded with infrequency, which could have impacted the results obtained. This was demonstrated in a study by Risen, Gilovich and Dunning (2007), whereby a single, unusual behaviour by a member of a minority group was found to be more memorable than other types of behaviours; thus, causing an IC. Nevertheless, the DBM has led to the emphasis of frequent and/or infrequent events in the formation of IC.
Availability and Memory
Extending from this idea, Manis, Shedler, Jonides and Nelson (1993) found that, availability has consequences in judgments that are dependent on the recall of the overall evaluation of a category but not on judgments that are dependent on the recall of the items that makes up the category. This suggests the availability account to have implications on IC from an evaluative perspective, neglecting item-specific memory. Exemplar Based Memory
On the contrary, Smith (1991) showed that the IC effect can be accounted for by a purely memory based model (see Hintzman, 1984; 1986), which excludes assumptions of biased attention on encoding. According to Smith (1991), memory responses are proportional to the algebraic sum of memory traces that correspond to the valence of each behaviour for each group, and not the proportion of desirable and undesirable behaviours across the groups. Thus, Smith (1991) suggested that participants would show greater liking for Majority Group A due to its larger difference in desirable and undesirable behaviours (i.e., 18 desirable – 8 undesirable = 10) than in Minority Group B (i.e., 9 desirable – 4 undesirable = 5).
As assumed, results from the study by Smith (1991) found behaviours associated with the majority group to be rated more positively in comparison to behaviours
associated with the minority group. Further support for this model comes from the study by Shavitt, Sanbonmatsu, Smittipatana and Posovac (1999), which showed greater favourability for Majority Group A when the difference in desirable and undesirable behaviours between the majority and minority group became increasingly larger.
Information Loss Account
Similar to the model proposed by Smith (1991), Fiedler (1991; 1996) introduced an Information Loss Account (ILA) of the IC effect. According to the ILA, group judgments are based on the aggregation of memory traces that correspond to the valence of the behaviour, and that this aggregation is sensitive to the size of the group.
Specifically, due to the larger amount of information related to the majority group, the extended aggregation of frequent, desirable and infrequent, undesirable behaviours serves to cancel out error variance (i.e., information loss) and as such, perceptions of desirable-to-undesirable ratio are less biased and more accurate for the majority group. However, with the minority group of which, there is less information about, there is greater error variance and thus, greater difficulty in detecting the dominance of the frequent, desirable behaviour (Fiedler, 1991; 1996; Fiedler, Russer & Gramm, 1993). In other words, the ILA assumes the IC effect to be due to the better extraction of
information related to the majority group, and poorer processing of infrequent, undesirable minority behaviour (Fiedler, 1991; 1996; Fiedler et al., 1993; Fiedler, Kemmelmeier & Freytag, 1999).
Assumptions of the ILA are empirically supported with findings from studies (Fiedler, 1991; Fiedler et al., 1993), which showed information processing amongst participants to be superior for frequent items (i.e., desirable, majority behaviours) but impaired for infrequent items (i.e., undesirable, minority behaviours). Added support for the ILA comes from the study by Shavitt et al. (1999), whereby the majority group was judged more favourably even when both the majority and minority groups were
Differentiation Approach
According to the Differentiation Approach (DA) as proposed by McGarty, Haslam, Turner and Oakes (1993) the IC effect is in fact, not illusory, but one that occurs due to real differences between the majority and minority groups. Particularly, the DA assumes that the greater number of positive behaviours versus negative
behaviours belonging to the majority group (i.e., 18 desirable – 8 undesirable = 10) than to the minority group (i.e., 9 desirable – 4 undesirable = 5) is of a real difference, which perceivers then attenuate, thus producing the IC effect. It is further assumed that the attenuation of evaluative differences between groups is the result of a perceiver’s need to distinguish one group from another (Berndsen, McGarty, van der Pligt & Spears, 2001; Haslam, McGarty & Brown, 1996; McGarty et al., 1993).
Empirical support for this approach comes from a non-typical study of IC
(McGarty et al., 1993), whereby participants were not shown stimulus information about groups and desirability of behaviours. Instead, participants were merely told that there were twice as many statements about Majority Group A than Minority Group B, and that half of the statements implied desirable behaviours performed by Majority Group A. Results of their study found that, the mere information on the distribution of behaviour between the groups was able to produce IC effects, whereby results obtained
predominantly found undesirable behaviours to be overrepresented in the minority group.
Attention Theory
Stemming from the idea of differentiation, The Attention Theory (AT; Sherman et al., 2009) was based on the Attention Theory Model of Category Learning (Krushke, 1996; 2001; 2003). In their study (Sherman et el., 2009), a modified paradigm of the IC was introduced. Here, instead of measuring IC on one evaluative dimension (i.e., desirability of behaviour), IC was measured on two evaluative dimensions (i.e., friendliness and intelligence). More specifically, instead of describing members of a majority group and a minority group with commonly occurring desirable behaviours and rarely occurring undesirable behaviours, members of both groups were described with a commonly occurring trait (e.g., intelligence) and a rarely occurring trait (e.g.,
friendliness).
It was reasoned that studies, which test IC on a single evaluative dimension fall short in illustrating the full mechanics of IC. This is because, when judgments are made on a single evaluative dimension, it is uncertain as to whether perceivers were assuming the majority group to be more positive than the minority group, the minority group to be more negative than the majority group or if both these assumptions were being made (Sherman et al., 2009).
As such, the AT (Sherman et al., 2009) instead suggests perceivers to first form an association between the majority group and the common trait as both the majority group and the common trait occur more frequently. Then, to distinguish the minority group from the majority group, attention is shifted to the rare trait in the minority group, which then forms an association between the minority group and the rarely occurring trait.
components of the DBM and the DA, whereby like the DA, the AT assumes perceivers to differentiate the minority group from the majority group. But unlike the DA, the AT assumes that differentiation occurs by the subsequent learning of the minority group after the majority group, and not through exaggerated real group differences (Sherman et al., 2009). On the other hand, like the DBM, the AT can account for the greater attention given to the infrequent behaviours performed by the minority group. However, unlike the DBM, the basis for this special attention is assumed to be contextual distinctiveness rather than numerical distinctiveness.
Findings from the study by Sherman et al. (2009) supported the AT such that participants associated the majority group with the commonly occurring trait (Majority-Common Trait) and the minority group with the rarely occurring trait (Minority-Rare Trait). Their results, however also showed the Minority-Rare Trait association to have a greater effect compared to the marginally reliable Majority-Common Trait association. Differences between these associations were justified to be due to the special attention paid to the rare traits in the minority group (Sherman et al., 2009). This suggestion of differential strengths between the Majority-Common Trait and Minority-Rare Trait associations can be related with the findings of Sherman, Hamilton and Roskos-Ewolden (1989), whereby, it was found that when a third group, C was introduced into the
context, only judgments on Minority Group B were affected, without any effects on the judgments of Majority Group A. Nevertheless, the marginally significant Majority-Common Trait association, as found in Sherman et al. (2009) bears with it a need to further investigate the differences between the Majority-Common Trait and Minority-Rare Trait associations and how they may play different roles in producing the IC effect.
would not be able to justify the Majority-Common Trait association, and vice versa with the suggestions put forward by Rothbart (1981). On the other hand, the DA, which looks at the actual difference in number of frequent and infrequent behaviours between the majority and minority groups, would be able to account for IC when they are presented on a single evaluative dimension, but not when they are presented on two separate dimensions as it would not be logical for a perceiver to find the difference in number of friendly and intelligent members in a majority and minority group (Sherman et al., 2009). Nevertheless, a model proposed by Van Rooy, Van Overwalle, Vanhoomissen, Labiouse and French (2003) might be able to predict comparable results when IC is presented on two evaluative dimensions.
Multiple Component Model
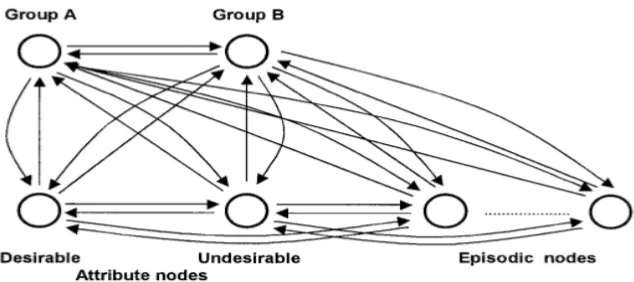
The Multiple Component Model (MCM; Van Rooy et al., 2003) states that, in a typical IC experiment, perceivers will create a mental representation linking (i.e., associating) a social group with an overall evaluative impression, and with item-specific behavioural information. More specifically, as perceivers process behavioural statements about the two groups, they incrementally develop prototypes of both the majority and minority group. Each prototype contains evaluative (i.e., desirable or undesirable) information and item-specific information (i.e., an episodic trace). This is illustrated in Figure 1. Therefore, the simultaneous encoding of evaluative information and item-specific information leads to the development of evaluative and episodic links respectively 1.
1
Figure 1. Multiple Component Model
Links are simultaneously formed, whereby evaluative links extend from the groups to the attribute nodes, whereas episodic links extend from the groups to the episodic nodes. Reprinted from “A Recurrent Connectionist Model of Group Biases,” by D. Van Rooy, F. Van Overwalle, T. Vanhoomissen, C. Labiouse and R. French, 2003, Psychological Buletin, 110(3), p. 539. Copyright 2003 by the American Psychological Association, Inc.
Reprinted with permission.
Learning is assumed to be driven by a connectionist learning algorithm (i.e., the delta algorithm by McClelland and Rumelhart, 1988), which exhibits two key emergent properties: The acquisition and competition properties. The acquisition property refers to the fact that, with every statement presented, the prototype becomes more established and more clearly encoded in memory. For instance, each time information describes a member of Majority Group A performing a desirable behaviour (“John, member of group A, helps an old lady across the street”), the association between Majority Group A and a desirable evaluation will become stronger.
Group A as well. Thus, each piece of behavioural information is encoded by two links: Its evaluative meaning ("the behaviour is good") and its unique item-specific episodic meaning ("helps an old lady across the street"). Because of this semi-distributed
representation, the MCM makes different predictions for judgments based on evaluative versus specific information. On judgments that do not rely on the retrieval of item-specific information (i.e., evaluative ratings of the groups, assignment of behaviours to groups), the MCM predicts an evaluative bias in favour of the majority group, due to the acquisition property, such that there is simply more information linking the majority
group with positive behaviour in a typical IC design.
Support for the MCM has been demonstrated in a study by Van Rooy et al. (2013), which found evidence for a dual, evaluative and episodic links of IC. Specifically, it was found through evaluative links, that as group size decreased, IC increased as indicated through increasingly negative judgments of smaller groups. However, item-specific episodic memory was enhanced as group size decreased, with better memory for
infrequent, undesirable behaviours over the frequent, desirable behaviours.As such, this study provided novel support for a number of previous studies (Hamilton et al., 1985; Johnson & Mullen, 1994; McConnell et al., 1994a), which showed infrequent, undesirable behaviours of the minority group to be enhanced in memory.
In addition, Van Rooy et al. (2013) demonstrated that, although item-specific episodic memory can contribute to a number of empirical findings associated to IC (i.e. better retrieval of undesirable minority behaviours), it is not necessary for IC to occur. Thus, their study provides clear support for previous studies, which have already suggested, but failed to clearly demonstrate, that enhanced memory for specific items is not a necessary precondition for an IC to occur (McConnell, Sherman & Hamilton, 1994b; McGarty et al., 1993).
The authors additionally argue that this can explain the contradictory findings in the IC literature. Specifically, it is argued that studies that did find evidence of enhanced memory for infrequent items (Hamilton & Gifford, 1976; Johnson & Mullen, 1994; Smith, 1989; Stronessner et al., 1992) may have used measures that tapped into the episodic links of information, whereas those that failed to find such findings (Fiedler 1991; 1996; Klauer & Meiser, 2000; Sanbonmatsu, Shavitt, Sherman & Roskos-Ewoldsen, 1987) may have measured IC at its evaluative links.
Current Study
been specifically tested on IC designs using a single evaluative dimension (i.e., desirable vs. undesirable behaviours). Therefore, the current study aims to test the predictions of the MCM for a design in which two evaluative dimensions (i.e., friendliness and intelligence) are used rather than one as in previous studies. The researchers of the current study chose to focus on the MCM, not because it is superior to other accounts, but rather because it generates specific predictions about how evaluative and item-specific information will interact to produce IC effects in a design where two independent traits are used.
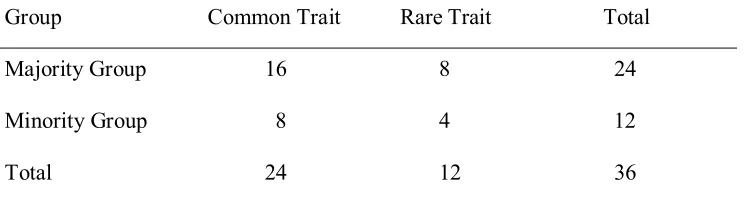
[image:23.612.117.490.503.606.2]It is expected that the MCM would be able to account for IC when measured on two evaluative dimensions as evaluative links are assumed to be connected to two separate attribute nodes (i.e., one for desirable behaviours and another for undesirable behaviours) rather than one bipolar node (see Figure 1). This can thus, be directly applied to an IC paradigm similar to that used in the study by Sherman et al. (2009), as each attribute node would be able to represent each independent trait. Table 2 represents the design of the current study.
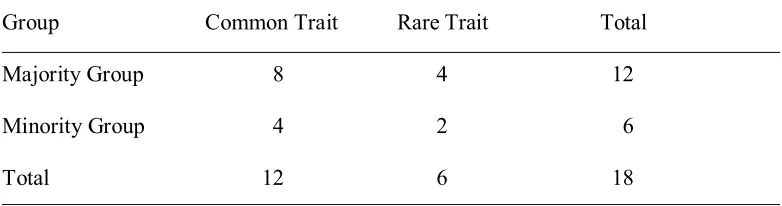
Table 2
Design of the Current Study
Group Common Trait Rare Trait Total Majority Group 16 8 24
Minority Group 8 4 12
Total 24 12 36
same distribution of evidence (i.e., 2:1 common to rare traits). This design will allow the current study to test a number of novel predictions by the MCM regarding the
competition between the evaluative and episodic links that arise from using two independent, rather than one evaluative trait dimension. More specifically, the MCM predicts that competition or blocking will not only occur between different types of links (i.e. evaluative vs. episodic), but also within similar links. Particularly, between the Common Trait and Rare Trait evaluative links. Based on this assumption, the MCM predicts that:
HI. Majority Group A will be more strongly associated with the Common Trait in comparison to Minority Group B as measured through evaluative measures.
H2. Minority Group B will be more strongly associated with the Rare Trait in comparison to Majority Group A as measured through evaluative measures.
These predictions result from the interaction between the acquisition and competition properties. Because most of the information presented shows Majority Group A to be associated with the Common Trait, perceivers will associate the Common Trait more strongly associated with Majority Group A, compared to Minority Group B. Also, due to its competition property, the MCM predicts that the Majority-Common Trait evaluative link will block the development of the Majority-Rare Trait evaluative link. This same competition property is at work for Minority Group B, whereby the Minority-Common Trait evaluative link will block the development of the Minority-Rare Trait evaluative link.
However, this blocking effect will be stronger for Majority Group A compared to Minority Group B, simply because the Majority-Common Trait evaluative link is
Minority Group B will thus be more strongly associated with the Rare Trait in comparison to Majority Group A as measured through evaluative measures.
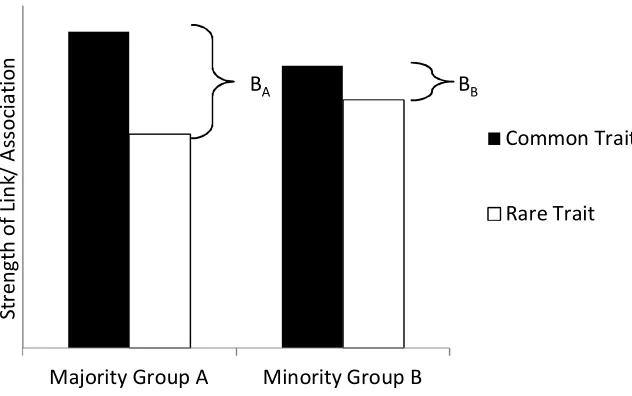
Figure 2. Strength of Group-Trait evaluative links.
BA and BB = Blocking effect within Majority Group A and Minority Group B,
respectively. The blocking of the Rare Trait by the Common Trait is greater in Majority Group A than in Minority Group B. Thus, the Rare Trait is more strongly linked to Minority Group B than Majority Group A.
As explained earlier, the strength of episodic links is inversely related to that of evaluative links. In other words, the stronger an evaluative link, the weaker is its corresponding episodic link. For instance, the stronger evaluative links for Majority Group A will block the development of episodic links for behaviours performed by members of Majority Group A. This thus leads to greater episodic links for behaviours performed by Minority Group B. However, because the evaluative link of the Minority-Common Trait is stronger than that of the Minority-Rare Trait, less blocking occurs for
Majority Group A Minority Group B
Common Trait
Rare Trait
the episodic link encoding Rare Trait behaviours of Minority Group B. Therefore, this generates the third and final hypothesis:
H3. In comparison to Majority Group A, Minority Group B behaviours would be more enhanced in memory, with memory advantage for Rare Trait behaviours over Common Trait behaviours.
To properly test the MCM predictions regarding item-specific episodic memory, a novel multilevel approach to signal detection analysis is applied, which has been shown to be more reliable than other methods of analysis (see Van Rooy et al., 2013). This analysis will enable us to reliably test the MCM prediction regarding enhanced behavioural memory in judgments driven by item-specific information, and this quite independently from the bias apparent in judgments based on evaluative information.
Besides that, the current study intends to investigate the findings of Sherman et al. (2009) from the perspective of the MCM. Specifically, whilst the AT assumes perceivers to engage in an attention shifting mechanism, it does not offer an explanation in terms of the cognitive processes that may underlie it. Instead, through the current study, it is expected that the acquisition and competition property of the MCM would be able to do so. Furthermore, as the assumptions of the AT are restricted to the allocation of attention, it can make no predictions on memory. Thus, the use of the MCM in the current study would also enable aspects of the IC effect, which went undetected by the AT (Sherman et al., 2009), to be identified in the current study.
Method Participants
The study was conducted with 98 participants (17 males, 81 females), aged 16-54 (M = 22.82, SD = 6.76), who were recruited from the Australian National University and the general public. Participants were either financially reimbursed or rewarded with Psychology Research Credit, which was in partial fulfilment of their Psychology course. This sample size was determined based on a priori power analysis (Faul, Erdfelder, Lang & Buchner, 2007), with expected power to be comparable to that found in Sherman et al. (2009) and Van Rooy et al. (2013).
Design
This study had a 2 (Group) X 2 (Trait) Within-Subjects design. The two levels of the independent variable (IV), Group were Majority Group A and Minority Group B; whereas the two levels of the IV, Trait were Common Trait and Rare Trait. As such, each participant viewed Common and Rare Trait statements belonging to both Majority Group A and Minority Group B.
Materials
In total, each participant viewed 36 statements as past studies have established that empirical phenomena associated with IC peaks between 36-48 statements (Mullen
& Johnson, 1990; Murphy, Schmeer, Vallée-Tourangeau, Mondragón & Hilton 2011) 2. The 36 statements were made up of 18 statements that were presented twice to ensure that episodic traces of the statements were clearly encoded in memory. Previous studies have shown that by presenting the statements twice, it assures strong memory
performance that allows reliable analysis (Van Rooy et al., 2013). Table 3 shows the
2
distribution of Common and Rare Trait statements between Majority Group A and
Minority Group B that were presented to each participant. As illustrated, the ratios of
Common and Rare Trait statements, both between and within groups were 2:1. Thus,
[image:28.612.89.480.215.318.2]there was no actual relationship between Trait and Group.
Table 3
Distribution of Statements in the Current Study
Group Common Trait Rare Trait Total
Majority Group 8 4 12
Minority Group 4 2 6
Total 12 6 18
The statements used (see Appendix A) were adapted (with permission) from Studies 2 and 5 from Sherman et al. (2009). A number of statements were modified to make them more meaningful to an Australian sample (i.e. “scored highly on the GAMSATS” was changed to “scored highly on the Year 12 HSC exams”). A number of
additional statements were also created and tested in a preliminary study, where
participants were asked to rate the ‘friendliness’ and ‘intelligence’ of a list of statements on a 10-point scale. Past studies have shown that typical IC effects are more likely to occur when participants are presented with statements of moderate valence (Hamilton & Sherman, 1989). Thus, statements rated as moderately (i.e., 5.0 < M < 7.0) ‘friendly’ and ‘intelligent’ were used in the current study.
In addition, the assignment of these ‘friendly’ and ‘intelligent’ statements as Common and Rare Traits were counterbalanced across subjects. Finally, the presentation of the statements was controlled by a custom-made computer code in Inquisit
(Millisecond, 2012). Procedure
Participants first read an Information Sheet (see Appendix C) and were seated individually in front of a desktop computer. They read instructions (see Appendix D) informing them that they were participating in a study on group perception, which were similar instructions used in previous IC experiments (see Van Rooy et al., 2013). Each statement remained on the computer screen until the participant pushed the space bar, or for a maximum of five seconds 3. After viewing all 36 statements, participants
completed two tasks. A previous study (Van Rooy et al., 2013) and our own pilot showed no order effects in regards to how the tasks were presented, and as such, they were not counterbalanced. At the end of the procedure, participants provided consent for the use of their data (see Appendix E) and were debriefed (see Appendix F).
Trait rating task. Participants were instructed to rate on four, 10-point scales, the extent to which they judged Majority Group A and Minority Group B to be ‘friendly’ and ‘intelligent’. On each scale, higher scores indicated higher perception of
‘friendliness’ or ‘intelligence’ respectively, with lower scores indicating lower perception of ‘friendliness’ or ‘intelligence’ respectively.
Group assignment task. All 18 statements (i.e., no repetition of statements) were presented again, without indicating group membership. For example, “MN, a member of Group ____, grasps new concepts easily.” In addition, 18 decoy statements, which participants had not seen before, were also presented. All 18 decoy statements
3
were of neutral meaning (Appendix B). For instance, “DL, a member of group ____, bought a new suit to wear to the office.” Together, all 36 statements were presented one at a time, in a random order. For each of the statements, participants were instructed to indicate if the statement belonged to Group A, by pressing on the ‘z’ key, or to Group B, by pressing on the ‘m’ key, or to neither by pressing on the space bar.
Data Analyses
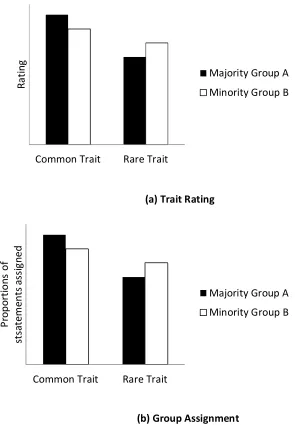
Figure 3. Predicted results of IC as measured through evaluative measures.
(a) Participants would rate Majority Group A higher on the Common Trait, in
comparison to Minority Group B, whereas Minority Group B would be rated higher on the Rare Trait, in comparison to Majority Group A. (b) A greater proportion of Common Trait statements would be assigned to Majority Group A, in comparison to Minority Group B; whereas, a greater proportion of Rare Trait statements would be assigned to Minority Group B, in comparison to Majority Group A.
Common Trait Rare Trait
R
a
ti
n
g
Majority Group A
Minority Group B
(a) Trait Rating
Common Trait Rare Trait
P ro p o rt io n s o f s t s a te m e n t s a s s ig n e d
Majority Group A
Minority Group B
Item-specific episodic memory. Latency scores from the group assignment task were analysed as a measure of participants’ episodic memory. Specifically, latency scores refer to the time taken to assign a statement to a group, whereby faster assignment of a statement to a group, indicates stronger memory for the link between that statement (i.e., Common or Rare Trait) and that group (i.e., A or B).
As in the study by McConnell et al. (1994a), latency scores were analysed in terms of overall assignment (i.e., regardless if the statement was assigned to the accurate group), accurate assignment (i.e., statement was assigned to its source group) and inaccurate assignment (i.e., statement was not assigned to its source group). It has been suggested (McConnell et al., 1994a) and thus, was predicted in the current study that if participants demonstrated enhanced memory for Rare Trait behaviours belonging to Minority Group B, participants would have faster latency scores for these items in the overall assignment and in the accurate assignment, but not in the inaccurate assignment. Also, faster latency scores for Rare Trait behaviours belonging to Minority Group B, in both the accurate and inaccurate assignment were determined to indicate bias amongst participants in indiscriminately assigning all Rare Trait behaviours to Minority Group B (McConnell et al., 1994a). Latency scores in the current study were analysed using the ANOVA.
A number of researchers (i.e. Fiedler, 1993; Klauer & Meiser, 2000; Van Rooy et al., 2013) have raised the issue of response bias in the Group Assignment task and therefore, have suggested that a measure of participants’ accuracy at the group
assignment task should instead be used to determine true memory. As such, participants’ accuracy in assigning statements to its source group (i.e., group assignment accuracy) was also analysed as a dependent variable.
modelled with the following multilevel logistic regression (Baayen, Davidson & Bates, 2008; Wright & London, 2009):
logit(Pr[Accuracyij]) = β0j + β1Groupj,
[image:33.612.172.458.251.419.2]whereby, Accuracyij refers to accuracy on the ith trial for the jth participant, β0j is the intercept and β1Groupj is a vector coding for the source group a statement is originally from (see also Van Rooy et al., 2013). Predicted results on the accuracy of group assignment are illustrated in the following Figure 4.
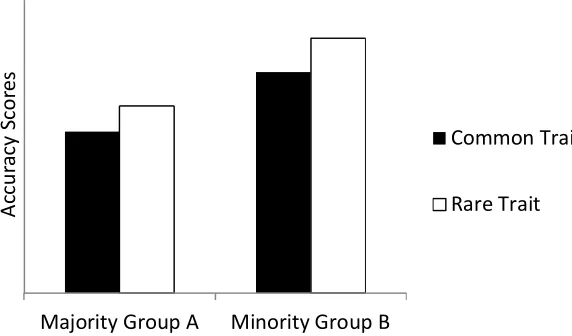
Figure 4. Predicted results for group assignment accuracy.
It was predicted that participants would be more accurate in assigning Minority Group B statements in comparison to Majority Group A statements, with higher accuracy in assigning Rare Trait statements than Common Trait statements to Minority Group B. This higher accuracy in assigning Rare Trait statements to Minority Group B would thus, indicate greater memory for Rare Trait behaviours of Minority Group B.
Additionally, a multilevel model approach to Signal Detection Analysis (SDA), which was developed by Van Rooy et al. (2013) to determine memory sensitivity, was also used. An advantage of using a SDA is its ability to distinguish mere guessing bias from true memory (Meiser, 2003). Moreover, by applying a multilevel model towards SDA, it has been argued to be a more accurate measure of memory in comparison to
Majority Group A Minority Group B
A
cc
u
ra
cy
S
co
re
s
Common Trait
threshold models (Klauer & Meiser, 2000) and analysing aggregate level data (DeCarlo, 1998; Wright & London, 2009) such as the traditional ANOVA, which could yield spurious results (Jaeger, 2008).
For this analysis, a binary dependent variable was created such that participants’ responses corresponded to whether he or she had categorized a statement in the group assignment task as ‘Old’ (i.e., statement was presented before) or as ‘New’ (i.e., decoy statement). Specifically, the assignment of a statement to either Group A or Group B would indicate ‘Old’, whereas, the assignment of a statement as neither would indicate ‘New’. ‘Old’ and ‘New’ responses were respectively coded as 1 and 0. It was expected that memories would vary amongst participants, and thus, the following multilevel logistic regression was modelled (Baayen et al., 2008; Wright & London, 2009):
logit(Pr[SaysOldij])= β0j + β1OldItemj,
with responseij referring to the response on ith trial for the jth participants, β0j referring to the intercept and β1OldItemj as a measure of accuracy (see also Van Rooy et al., 2013). The coefficient of ‘OldItem’ (i.e., whether an item was previously presented) is an indirect measure of memory sensitivity and its interaction with other variables (i.e., Group and Trait) indicates whether these other variables moderated accuracy (Wright & London, 2009). For instance, to test if Trait (i.e., Common vs. Rare) moderated
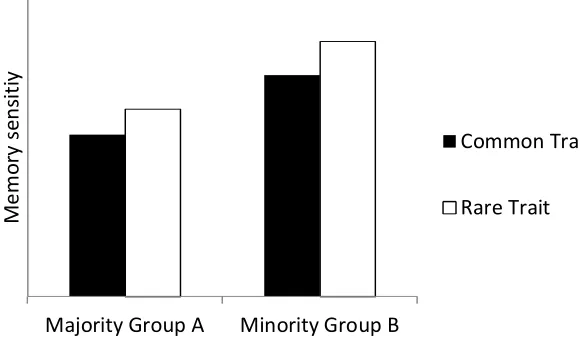
Figure 5. Predicted results for memory sensitivity as measured using a
multilevel Signal Detection Analysis.
It was predicted that participants would say ‘Old’ to more statements from Minority Group B than Majority Group A, and to more Rare Trait statements than Common Trait statements; indicating better memory for Rare Trait behaviours of Minority Group B.
Results Evaluative Group Impression
Trait rating. A 2 (Common Trait: Friendly vs. Intelligent) X 2 (Trait: Common vs. Rare) X 2 (Group: A vs. B) ANOVA, with repeated measures on the last two variables found that there were no significant differences in the data collected when the Common Trait was ‘friendly’ or ‘intelligent’ 4. As such, the main analysis on Trait Rating was conducted using a 2 (Trait: Common vs. Rare) X 2 (Group: A vs. B) Repeated Measures ANOVA (see Table 4).
4
Common Trait: Friendly vs. Intelligent, was included as a between-subjects,
independent variable to determine if there was a significant effect of counterbalancing ‘friendly’ and ‘intelligent’ statements as the Common Trait.
Majority Group A Minority Group B
M
e
m
o
ry
s
e
n
s
it
iy
Common Trait
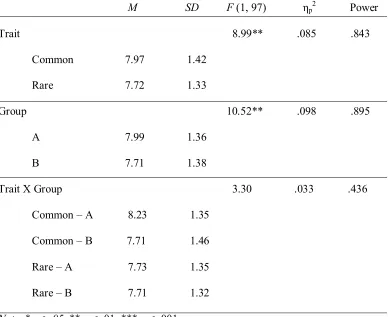
Table 4
Results from 2 X 2 Repeated Measures ANOVA: Trait Rating
M SD F (1, 97) ηp2 Power Trait 8.99** .085 .843
Common 7.97 1.42 Rare 7.72 1.33
Group 10.52** .098 .895 A 7.99 1.36
B 7.71 1.38
Trait X Group 3.30 .033 .436 Common – A 8.23 1.35
Common – B 7.71 1.46 Rare – A 7.73 1.35 Rare – B 7.71 1.32 Note. *p < .05, ** p < .01, *** p < .001
A significant main effect for Trait was found, such that the Common Trait was generally rated higher in comparison to the Rare Trait. The main effect of Group was also significant, whereby Majority Group A was rated higher in comparison to Minority Group B. Also, the interaction between Trait and Group revealed a marginally
effect size, d = .32 5. There were no significant differences in ratings of Majority Group A and Minority Group B on the Rare Trait, t(97) = 0.13, p > .05. These analyses suggest the significant main effects of Trait and Group to be mainly attributed to Majority Group A being rated significantly higher on the Common Trait (see Figure 6).
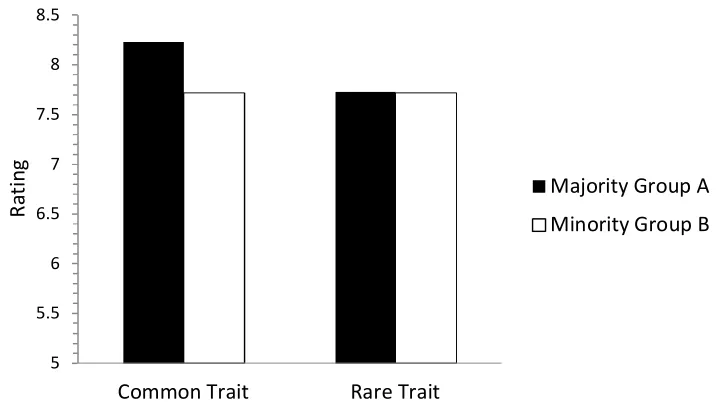
Figure 6. Results from the Trait Rating task.
Whilst there were no differences in the ratings of Majority Group A and Minority Group B on the Rare Trait, Majority Group A was rated higher on the Common Trait in
comparison to Minority Group B. Thus, suggesting the Majority-Common Trait association to be the strongest amongst the evaluative links.
Group assignment. Analyses on the Group Assignment task were conducted excluding individual responses that had response latencies greater than three standard deviations from the overall mean latency (M = 2.76, SD = 2.12), in line with
5 Reported effect sizes in the current study are based on Cohen’s (1988, p. 284 - 287) guidelines, where d = .2 - small effect, d = .5 - moderate effect and d = .8 - large effect.
5 5.5 6 6.5 7 7.5 8 8.5
Common Trait Rare Trait
R
a
ti
n
g
Majority Group A
recommended exclusion criteria (Field, 2013) and the study by McConnell et al., (1994a). As such, a total of 24 responses (1.36%) were not included in this analysis.
A 2 (Common Trait: Friendly vs. Intelligent) X 2 (Trait: Common vs. Rare) X 2 (Group: A vs. B) ANOVA, with repeated measures on the last two variables found no significant effect of the Common Trait being ‘friendly’ or ‘intelligent’. Note however, that Levene’s test of Individual Differences was not assumed for the Rare Trait statements that were assigned to Minority Group B (p < .05).
Table 5
Results from 2 X 2 Repeated Measures ANOVA: Group Assignment a
M SD F (1, 97) ηp2 Power Trait .59 .006 .118
Common .47 .22 Rare .48 .24
Group 89.49*** .480 1.000 A .58 .21
B .37 .20
Trait X Group 2.80 .028 .381 Common – A .60 .18
Common – B .34 .17 Rare – A .55 .23 Rare – B .40 .22
Note.a Proportion of statements assigned was calculated using number of Common (or
Rare) statements assigned, divided by total number of Common (or Rare) statements. *p < .05, ** p < .01, *** p < .001
On the whole, results from the Group Assignment task resemble closely to that of the Trait Rating task, whereby the main effect of Group was found to be significant. However, an additional result demonstrated though the Trait Rating task, is the interaction of Majority Group A with the Common Trait. The implications of these combined results will be further explored in the discussion section.
Item-specific Episodic Memory
Also, test of normality on the latency scores found the distribution of latency scores to be significantly positively skewed, Zskewness = 25.7, and thus, non-normal, D(1740) = .125, p < .001. Therefore, analyses on the latency scores of group assignment were conducted using its log transformation, which improved normality, D(1740) = .031, p = .001 and reduced skewness, Zskewness = -8.83.
Table 6
Interaction of Common Trait with Trait in 2 X 2 X 2 Mixed ANOVAs
M SD dferror F
Overall Assignment 81 24.32*** Friendly
Common .42 .12 Rare .33 .17 Intelligent
Common .34 .17 Rare .37 .18
Accurate Assignment 69 12.50** Friendly
Common .40 .12 Rare .32 .17 Intelligent
Common .33 .18 Rare .36 .19
Inaccurate Assignment 17 7.86** Friendly
Common .46 .15 Rare .31 .22 Intelligent
As some participants had assigned, all Common Trait (or all Rare Trait) statements to a particular group, mean latency scores could not be calculated for those participants, and thus, there were missing values for some of the stimulus categories (i.e., Majority-Common Trait, Majority-Rare Trait, Minority-Common Trait, Minority- Rare Trait). Therefore, the analysis on overall assignment was conducted with N = 83 rather than 98. Also, Levene’s test of Individual Differences in the analysis of overall assignment was not assumed for Common Trait statements that were assigned to Majority Group A (p < .05).
[image:42.612.90.482.502.713.2]Specific to the overall assignment (see Table 7), a significant main effect for Trait was obtained but not for Group. Particularly, it was found that participants were faster in the assignment of Rare Trait statements than Common Trait statements. Besides that, due to the significant interaction effect of Group and Trait, analyses of simple main effects were subsequently conducted using two separate, 2 (Common Trait: Friendly vs. Intelligent) X 2 (Group-Trait: Group-Common vs. Group-Rare) Mixed ANOVAs for Majority Group A and Minority Group B respectively (see Table 8).
Table 7
Results from 2 X 2 X 2 Mixed ANOVA: Latency – Overall Assignment
M SD F (1, 81) ηp2 Power
Group .01 .000 .051
A .36 .16 B .36 .17
Trait 8.00** .090 .798 Common .38 .15
Rare .35 .18
Table 8
Results from 2 X 2 Mixed ANOVAs: Overall Assignment – Simple Main Effects
M SD dferror F ηp2 Power Majority Group A 90 27.66*** .235 .999
Common .39 .16 Rare .32 .18
Minority Group B 87 .14 .002 .065 Common .37 .15
Rare .37 .18
Note. *p < .05, ** p < .01, *** p < .001
Results showed that participants were significantly faster in assigning Rare Trait statements than Common Trait statements to Majority Group A. Simple main effects conducted with Minority Group B however, found no significant differences in the response latencies for the assignment of Rare and Common Trait statements.
When analyses were specific to correctly assigned responses (N= 71, see Table 9), a significant interaction of Trait and Group was similarly found. Again, further tests using two separate, 2 (Common Trait: Friendly vs. Intelligent) X 2 (Trait: Group-Common vs. Group-Rare) Mixed ANOVAs showed participants to have been
Table 9
Results from 2 X 2 X 2 Mixed ANOVA: Latency – Accurate Assignment
M SD F (1, 69) ηp2 Power Group .04 .001 .054
A .35 .17 B .35 .17
Trait 1.73 .024 .254 Common .36 .16
Rare .34 .18
Group X Trait 17.12*** .199 .983 Note. *p < .05, ** p < .01, *** p < .001
Table 10
Results from 2 X 2 Mixed ANOVAs: Accurate Assignment – Simple Main Effects
M SD dferror F ηp2 Power Majority Group A 90 30.48*** .253 1.000
Common .39 .16 Rare .31 .18
Minority Group B 73 2.04 .027 .292 Common .34 .15
Rare .37 .20 Note. *p < .05, ** p < .01, *** p < .001
Finally, analysis specific to inaccurate assigned responses (N = 19, see Table 11) found only the main effect of Trait to be significant, whereby participants were
[image:44.612.89.490.426.607.2]Table 11
Results from 2 X 2 X 2 Mixed ANOVA: Latency – Inaccurate Assignment
M SD F (1, 17) ηp2 Power
Group .06 .003 .056
A .39 .22 B .40 .20
Trait 5.13* .232 .570
Common .43 .19 Rare .36 .22
Group X Trait .05 .003 .055 Note. *p < .05, ** p < .01, *** p < .001
To summarize, a significant interaction effect of Trait with Group was found in the overall and accurate assignment, but not in the inaccurate assignment. This would then suggest the found interaction of Majority-Rare Trait to not be due to a biased assignment of Rare Trait statements to Majority Group A, but rather as a result of enhanced memory for this association. Although rarely found in the research literature on IC, this significant Majority-Rare Trait association was found to occur with large effect sizes and power (see Tables 9 and 11). The implications of this finding are further considered in the discussion section.
as a measure of accuracy. The generalized linear mixed model was fit using the Laplace method of approximation, which is the default in the Ime4 package (Bates, Maechler & Dai, 2008).
The restricted model was firstly defined with only Participants as a random factor. Then, by adding the terms, Trait and Group into the model, it significantly increased the fit of the model, X2(2) = 17.48, p < .001. Results from the analysis demonstrated better accuracy for Majority Group A, β1 = -.48, p < .001, with no significant differences for the Trait term.
Subsequently, the interaction term of Group with Trait was added into the model, which significantly improved the fit of the model, X2(1) = 10. 13, p < .01. By
Figure 7. Interaction of Group with Trait on accuracy scores.
Whilst no significant differences were found for the accuracy in assigning Rare Trait and Common Trait statements to Majority Group A, Rare Trait statements were found to be assigned more accurately to Minority Group B than Common Trait statements.
As such,further analysis using a binomial logistic regression was conducted to determine the significance of accuracy for each Group with Trait as the predictor. Results showed that the odds of a participant accurately assigning a statement to Majority Group A is not significantly different when the statement is of a Rare Trait or of a Common Trait, Exp(B) = 1.299, CI95 [.992, 1.700], p > .05. Conversely, the odds of a participant accurately assigning a statement to Minority Group B is .65 times higher when the statement is of a Rare Trait than when it is of a Common Trait, CI95 [.450, .938], p < .05. These results hence suggest better accuracy for Rare Trait statements belonging to Minority Group B.
Thus far, it is apparent that results obtained from the analysis of group
assignment accuracy are the reverse to that found from the analysis of group assignment 0
0.1
0.2
0.3
0.4
0.5
0.6
0.7
0.8
0.9 1
Majority Group A Minority Group B
A
cc
u
ra
cy
Common Trait
latency scores. Inferences drawn from these combined results are further explored in the discussion section.
Signal detection analysis. Neutral statements (i.e., decoy items) were included in the Group Assignment task to determine participants’ ability in distinguishing an ‘Old’ item (i.e., statement was presented before) from decoy items as a measure of memory sensitivity (see also Van Rooy et a., 2013). As with the analysis on Group Assignment accuracy, the Laplace model was used to fit the models.
Expectedly, results from this analysis revealed participants to have said “Old” more often towards statements they have seen before, in comparison to decoy
statements, β = 7.06, p < .001. Further analyses however, found no significant memory advantage for Group (p > .05) or Trait (p > .05). Instead, results obtained showed close to perfect performance amongst participants, such that hit rates (i.e., correctly assigned statements) were almost 1 for every participant. This therefore, suggests a ceiling effect, which implications would be further considered in the discussion section.
Discussion
The aim of the current study was to further test the MCM (Van Rooy et al., 2003) predictions regarding the use of evaluative and item-specific information in an IC design using two independent trait dimensions, rather than one evaluative dimension.
Specifically, where past research (Van Rooy et al., 2013) investigated the competition property between the evaluative and episodic links within the MCM, the current study allowed the testing of a number of novel predictions by the MCM regarding the competition between similar links, more particularly between the evaluative links encoding the Common and Rare Trait behaviours. The focus thus is on how the different types of information (i.e., evaluative and item-specific) work together and/or
Evaluative Group Impression
The current study firstly hypothesized that Majority Group A would be more strongly associated to the Common Trait in comparison to Minority Group B, and that this would be apparent in measures thought to rely on evaluative information. Results from the Trait Rating task provided clear support for this hypothesis, while results from the Group Assignment task provided partial support.
Firstly, results from both the Trait Rating and Group Assignment tasks found evidence for the main effect of Group, such that Majority Group A was found to have greater association to both the Common and Rare Trait in comparison to Minority Group B. Results from the Trait Rating task however, additionally found Majority Group A to be associated to the Common Trait. As such, the combination of results from the Group Assignment and Trait Rating tasks in respect to the first hypothesis, suggest an overall greater learning of Majority Group A, with the propensity to associate Majority Group A with the Common Trait.
The second hypothesis stated that the Rare Trait would be more strongly associated with Minority Group B in comparison to Majority Group A; as a result from the greater blocking of the Majority-Common Trait evaluative link on the Majority-Rare Trait evaluative link. There was very little support for this hypothesis, such that
associations formed with Majority Group A was consistently stronger than that of Minority Group B.
Overall, the combined results in respect to hypotheses one and two suggest that participants were able to develop an accurate impression of Majority Group A, but not of Minority Group B. More particularly, results from both the Trait Rating and Group Assignment task suggest participants to have learnt the true associations between
that this confusion about Minority Group B, together with the more established Majority–Common Trait association (as found in the Trait Rating task), led to the “illusory correlation” between Majority Group A and the Common Trait.
The results also suggest that the expected competition effects between the Common Trait and the Rare Trait, which would have resulted in a stronger Minority-Rare Trait evaluative link, did not occur. A possible explanation is that the Majority– Common Trait link blocked the development of all other links in the evaluative network. In other words, participants developed stereotypical impressions in which Majority Group A was clearly associated to the Common Trait, and discarded any information regarding Minority Group B that attenuated this impression. Hence, the blocking effect amongst evaluative links predominantly occurred between Groups.
These findings thus partly support the MCM (Van Rooy et al., 2003), as information about Majority Group A blocked all information associated with Minority Group B due to its relatively greater statistical frequency. However, contrary to
Figure 8. Results found on the evaluative links of IC.
BG = Blocking effect of Majority Group A on Minority Group B.
As there is greater information on Majority Group A, its evaluative links are stronger; thus, blocking those of Minority Group B. At the same time, a slight blocking effect of Majority-Common Trait on Majority-Rare Trait was found, whilst no such blocking effect had occurred between the Minority-Common Trait and Minority-Rare Trait. Therefore, evaluative links of IC were found to be predominantly based on the majority group than the minority group.
In the study by Van Rooy et al. (2013) its findings on the evaluative links of IC demonstrated increased association of a group with the infrequent, undesirable
behaviours as group size decreased (Van Rooy et al., 2013). However, because this finding was determined based on evaluative judgments on desirability, which is one-dimensional, it is difficult to determine if one group was perceived to be more desirable than the other, less desirable than the other or both. More specifically, the prototype of Group-Behaviour links would have been unclear. Thus, the perceived IC between a
Majority Group A Minority Group B
Common Trait
Rare Trait
minority group and the rarely occurring undesirable behaviours, would have masked the IC between a majority group and the commonly occurring desirable behaviours.
On the contrary, in the current study where evaluative group impressions were measured on two evaluative dimensions (i.e., friendliness and intelligence), partial support was found for the Majority-Common Trait association, but not for the Minority-Rare Trait association. This would thus, imply the findings on evaluative group
impression in the study by Van Rooy et al. (2013) to mean that a group is perceived as more desirable with increasing group size. This is in contrast to the proposed
interpretation that a group is increasingly perceived as undesirable, as group size decreases (Van Rooy at al., 2013).
The obtained current set of results also has implications for other accounts of IC. Firstly, our results are partially consistent with those of Sherman et al. (2009). In their study, the results from the Trait Rating task only found significant results for the Rare Trait, in that participants associated the Rare Trait more with the minority group as compared to the majority group. Our results however, found a significant difference for the Common Trait, in that participants associated the Common Trait more strongly with the majority group as compared with the minority group. Perhaps somewhat ironically, our findings on the evaluative links, are more consistent with the AT (Sherman et al., 2009), whereby the AT predicts learning to first occur for the majority group, leading to a representation of the majority group in terms of its typical features (i.e., Common Trait). Results from the current study provide support for this.
to the greater availability of information regarding the commonly occurring behaviour of the majority group (Rothbart, 1981). The finding of a Majority-Common Trait
association as an evaluative link is also supported by a past study (Manis et al., 1993), which similarly found the more available information (i.e., Majority-Common Trait) to have implications from an evaluative perspective.
Item-specific Episodic Memory
In terms of encoding item-specific information within the MCM, it was predicted that enhanced memory would occur for Minority Group B in comparison to Majority Group A, with advantage in memory for Rare Trait behaviours over Common Trait behaviours. Amongst the three analyses on item-specific episodic memory, only those from participants’ accuracy in the Group Assignment task were found to support this hypothesis. In addition, analysis of the group assignment latency scores found results that contradicted this hypothesis. Specifically, participants were shown to have assigned Rare Trait statements to Majority Group A significantly faster than Common Trait statements; whereas they showed no significant differences in the time taken to assign Common and Rare Trait statements to Minority Group B. This suggests that, contrary to predictions, participants appeared to show superior item-specific memory for Majority-Rare Trait behaviours.
Associations found through the analysis of latency scores in an ‘overall
As such, in addition to the traditional reaction time (i.e., latency scores) analysis, we also applied a multilevel analysis to group assignment data, which has been argued to be more reliable (Van Rooy et al., 2013). Consistent with MCM predictions, this
analysis showed that assignment accuracy for the Minority-Rare Trait association was greater than for the Minority-Common Trait association. Whereas with Majority Group A, the accuracy in assigning Common and Rare Trait statements were not found to be significantly different. However, a multilevel approach to signal detection analysis failed to provide any conclusive evidence. A closer inspection of the number of ‘hits’ (i.e., accurately discriminate ‘Old’ items’ from decoy items) to ‘misses’ (i.e., inaccurately discriminate between ‘Old’ items and decoy items) showed that participants
demonstrated almost perfect performance, with a very high number of ‘hits’. This
suggests that the failure to find any actual differences in item-memory was largely due to a ceiling effect. We discuss possible reasons under Limitations.
In sum, findings on item-specific episodic memory were thus contradictory: While the analysis on latency scores suggests superior memory for the Majority-Rare Trait association, the accuracy analysis on group assignment however, suggests it to be the Minority-Rare Trait association. As such, in respect to item-specific episodic memory, the proposed hypothesis is partially supported.
The finding of a Minority-Rare Trait association as an episodic link provides support for the MCM, which assumes the Minority-Rare Trait association to be the strongest amongst the episodic links of IC. This finding is also in line, with Van Rooy et al. (2013), which used a similar accuracy analysis on group assignment; and also with the Distinctiveness Based Model (DBM; Hamilton & Gifford, 1976), which assumes enhanced encoding of co-occurring infrequent items (i.e., minority group, rare traits).
literature on IC. Previous studies have typically found a Minority-Rare Trait association (Johnson & Mullen, 1994; McConnell et al., 1994a). Although inconstant with previous studies, the large effect size for this result in our study suggests that this is in fact a genuine effect that warrants further investigation, particularly as previous studies used the classic one-dimensional IC design.
It is difficult to provide a coherent explanation for the contrary results in terms of item-specific memory. However, it is possible that, in the current design with two separate dimensions, perceivers more efficiently encoded in memory distinct (i.e., rarely occurring) characteristics of both the majority and minority group. This is consistent with the MCM prediction that stronger evaluative links for Common Trait behaviours (due to its greater statistical frequency) leads to weaker evaluative links for Rare Trait behaviours and thus, stronger episodic links for Rare Trait behaviours. The apparently contradictory results (i.e., Majority-Rare and Minority-Rare) however, might arise from the different measures tapping into different levels of information used to form a
judgment: When memory was measured through a relatively more reliable analysis (i.e., group assignment accuracy), the resulting Minority-Rare Trait episodic link
General Discussion
Overall, via the evaluative links of IC, results of the current study found evidence of a Majority-Common Trait association; whereas in terms of the episodic links of IC, the results were less straightforward – with an accuracy analysis confirming MCM predictions, while latency analysis provided mixed support.
The assumed principle of the competition property between the evaluative and episodic links is supported, such that stronger evaluative links block its corresponding episodic links. When results are specific to evaluative information, it appears that, as predicted by the MCM, the stronger evaluative links for Majority-Common Trait did indeed block the development of other links in the network (see Figure 8). As a result, the weaker evaluative links for Rare Trait behaviours led to the stronger development of its corresponding episodic links, as demonstrated through the findings of the Minority-Rare and Majority-Minority-Rare episodic links in the current study (see Figure 9). Overall, our results thus suggest, that when forming an overall evaluative group impression,