Astronomy
&
Astrophysics
https://doi.org/10.1051/0004-6361/201834353© ESO 2019
Upper limits on CH
3
OH in the HD 163296 protoplanetary disk
Evidence for a low gas-phase CH
3OH-to-H
2CO ratio
M. T. Carney
1, M. R. Hogerheijde
1, V. V. Guzmán
2,3, C. Walsh
4, K. I. Öberg
5, E. C. Fayolle
6, L. I. Cleeves
7,
J. M. Carpenter
2, and C. Qi
51 Leiden Observatory, Leiden University, PO Box 9513, 2300 RA Leiden, The Netherlands
e-mail:[email protected]
2 Joint ALMA Observatory (JAO), Alonso de Córdova 3107, Vitacura, Santiago de Chile, Chile
3 Instituto de Astrofísica, Ponticia Universidad Católica de Chile, Av. Vicuña Mackenna 4860, 7820436 Macul, Santiago, Chile 4 School of Physics and Astronomy, University of Leeds, Leeds LS2 9JT, UK
5 Department of Astronomy, Harvard University, Cambridge, MA 02138, USA
6 Jet Propulsion Laboratory, California Institute of Technology, 4800 Oak Grove Drive, Pasadena, CA 91109-8099, USA 7 University of Virginia, Charlottesville, VA 22904, USA
Received 1 October 2018 / Accepted 9 January 2019
ABSTRACT
Context. Methanol (CH3OH) is at the root of organic ice chemistry in protoplanetary disks. Its connection to prebiotic chemistry and
its role in the chemical environment of the disk midplane make it an important target for disk chemistry studies. However, its weak emission has made detections difficult. To date, gas-phase CH3OH is detected in only one Class II disk, TW Hya.
Aims. We aim to constrain the methanol content of the HD 163296 protoplanetary disk.
Methods. We used the Atacama Large Millimeter/submillimeter Array (ALMA) to search for a total of four CH3OH emission lines
in bands six and seven toward the disk around the young Herbig Ae star HD 163296. The disk-averaged column density of methanol and its related species formaldehyde (H2CO) were estimated assuming optically thin emission in local thermodynamic equilibrium.
We compared these results to the gas-phase column densities of the TW Hya disk.
Results. No targeted methanol lines were detected with Keplerian masking in the image plane nor with matched filter analysis in the uvplane individually nor after line stacking. The 3σdisk-integrated intensity upper limits are<51 mJy km s−1for the band six lines
and<26 mJy km s−1for the band seven lines. The band seven lines provide the strictest 3σupper limit on disk-averaged column density
withNavg<5.0×1011cm−2. The methanol-to-formaldehyde ratio is CH3OH/H2CO<0.24 in the HD 163296 disk compared to a ratio
of 1.27 in the TW Hya disk.
Conclusions. The HD 163296 protoplanetary disk is less abundant in methanol with respect to formaldehyde compared to the disk
around TW Hya. Differences in the stellar irradiation in this Herbig Ae disk as compared to that of a disk around a T Tauri star likely influence the gaseous methanol and formaldehyde content. Possible reasons for the lower HD 163296 methanol-to-formaldehyde ratio include: a higher than expected gas-phase formation of H2CO in the HD 163296 disk, uncertainties in the grain surface formation
efficiency of CH3OH and H2CO, and differences in the disk structure and/or CH3OH and H2CO desorption processes that drive the
release of the molecules from ice mantles back into the gas phase. These results provide observational evidence that the gas-phase chemical complexity found in disks may be strongly influenced by the spectral type of the host star.
Key words. astrochemistry – protoplanetary disks – submillimeter: stars
1. Introduction
Methanol is an astrobiologically relevant molecule because it acts as a precursor to more complex organic molecules (COMs) that may develop into amino acids and other building blocks of life (Öberg et al. 2009; Herbst & van Dishoeck 2009). Main-taining an understanding of methanol chemistry through the numerous stages of star and planet formation is essential to make predictions on the molecular complexity available for incor-poration into extrasolar planetary bodies (e.g., Drozdovskaya et al. 2014). The CH3OH molecule is regularly detected in the earlier, embedded stages of star formation both in the solid phase through ice absorption (Grim et al. 1991; Skinner et al. 1992; Dartois et al. 1999; Pontoppidan et al. 2004; Bottinelli et al. 2010; Kristensen et al. 2010; Shimonishi et al. 2010;
Boogert et al. 2015) and in the gas phase (Friberg et al. 1988;
van Dishoeck et al. 1995;Graninger et al. 2016;Lee et al. 2017). These observations provide evidence for the presence of CH3OH ices in cold molecular clouds and protostellar envelopes.
gas phase (Aikawa et al. 2003;Öberg et al. 2010,2017;Qi et al. 2013;van der Marel et al. 2014;Loomis et al. 2015;Carney et al. 2017). However, because of the much higher methanol bind-ing (desorption) energy (e.g., Edes of ∼2000 K for H2CO and ∼5500 K for CH3OH in mixtures of water ice;Collings et al. 2004;Garrod & Herbst 2006), methanol is expected to be frozen out over a much larger region of the disk than formaldehyde.
Variation in the formaldehyde and methanol content across protoplanetary disks may point to differences in their formation processes. Formaldehyde can be formed in the gas phase and on grain surfaces, therefore a lower than expected methanol-to-formaldehyde ratio could be due to a more efficient gas-phase pathway to form H2CO (Fockenberg & Preses 2002;Atkinson et al. 2006), less efficient conversion of H2CO into CH3OH on grain surfaces than expected, or lower than expected CH3OH photodesorption rates and/or immediate UV photodissociation of gas-phase CH3OH (Bertin et al. 2016;Cruz-Diaz et al. 2016). The HD 163296 (MWC 275) system is an ideal testbed in which to explore chemical processing in protoplanetary disks, in particular for organics. It is an isolated Herbig Ae pre-main sequence (PMS) star with spectral type A2Ve at an age of
∼5 Myr (Alecian et al. 2013). The star is surrounded by a
large, bright protoplanetary disk containing a significant reser-voir of gas that extends out to ∼550 AU in the gas based on
CO measurements (de Gregorio-Monsalvo et al. 2013). The disk has an inclination of 44◦, a position angle of 133◦, and a total
mass of Mdisk ≈ 0.09M based on physical models (Qi et al.
2011;Rosenfeld et al. 2013). At such an inclination, the vertical structure as well as the radial structure can be inferred directly from the molecular line emission maps (Rosenfeld et al. 2013;
Flaherty et al. 2015).
Recent measurements of the stellar parallax by Gaia put
the HD 163296 system at a distance of d=101±1 pc (Gaia Collaboration 2018), significantly closer than previous distance estimates of 122 pc (van den Ancker et al. 1998)1. While the new distance will affect the stellar parameters, this work adopts the previously reported values for stellar mass (2.3M;Qi et al.
2011) and distance (d=122 pc). The analysis presented here
focuses on the disk-averaged molecular column density ratios of methanol and formaldehyde within the same disk. The column density is derived from the disk-integrated line flux, therefore the updatedGaiadistance measurements will affect the line flux
similarly for molecular species within the same disk, and the effect of the new distance is canceled out.
The proximity and size of the disk combined with the high total luminosity of the Herbig Ae PMS star provides a unique opportunity to fully resolve the location of the CO snow line, that is, the midplane radius beyond which gas-phase CO will freeze out into ice (Qi et al. 2011,2015;Mathews et al. 2013). Current estimates byQi et al.(2015) place the CO snow line at a midplane radius of 90 AU, corresponding to a gas and dust temperature of
∼24 K in this disk. Recent work has revealed that the disk
con-sists of several rings and gaps in the millimeter dust and in the gas (Isella et al. 2016), while the CO gas shows asymmetries at specific velocities (Pinte et al. 2018;Teague et al. 2018), both of which may be indicative of planet-disk interaction from embed-ded forming planets. Given its large radial extent of∼550 AU and
1 The updated distanced=101±1 pc results in a stellar luminosity of
∼23L, which is 30% lower than the previous estimate (Alecian et al.
2013). Applying the adjusted luminosity value to the H–R diagram used byAlecian et al.(2013) to determine the age of the system and stellar mass results in an updated age of∼9 Myr and an adjusted stellar mass closer to 2.1M.
resolved, relatively close-in CO snow line position, HD 163296 is one of the best candidates to probe the formation of organics that require the freeze-out of abundant volatiles such as CO.
This paper presents observations from the Atacama Large Millimeter/submillimeter Array (ALMA) of the CH3OH molecule toward HD 163296. Section2 describes the observa-tions and data reduction. Results including the upper limits on the methanol content of the HD 163296 disk and a comparison to the TW Hya disk are described in Sect.3. In Sect.4we dis-cuss the implications of the upper limits and the detectability of methanol in disks similar to HD 163296. Section5presents the conclusions of this work.
2. Observations and reduction
HD 163296 (J2000: RA = 17h56m21.280s, Dec =
–21◦57022.44100) was observed with ALMA in band six and
band seven during Cycle 4 under project 2016.1.00884.S. Band six and band seven are receivers operating in the 211–275 GHz and 275–373 GHz range, respectively. Band six observations were done with the ALMA 12-m array on 2016 November 11, 2016 December 01, and 2017 March 15 with 42 antennas. Band seven observations were carried out with the Atacama Compact Array (ACA) on 2016 October 05, 08, 13, 26 using 10 of the 7-m ACA antennas, and with the ALMA 12-m array on 2017 April 13 using 45 antennas. In total, four transitions of CH3OH were targeted across the two bands with the frequency domain mode (FDM) correlator setting: two CH3OH 505–404 (A/E) lines2 in band six at 241.791 and 241.700 GHz with a frequency (velocity) resolution of 244 kHz (0.303 km s−1); and in band seven,
CH3OH 211–202(A) at 304.208 GHz and CH3OH 110–101(A) at 303.367 GHz with a frequency (velocity) resolution of 141 kHz (0.139 km s−1). All CH3OH lines were in the upper side band (USB) of their execution blocks. The lower side band (LSB) contained observations of the continuum, C17O J=2−1, CN
J=2−1, and CH3CNJ=13−12 in band six, and the continuum,
DCN J=4−3, and four H2CO lines in band seven which will
be presented in Guzmán et al. (in prep.). Table 1 summarizes the observational parameters for each CH3OH line and the continuum.
Band six observations were obtained over three execution blocks with 6.05 s integration steps and 68 min total time on-source. System temperatures varied from 60–140 K and the average precipitable water vapor varied from 1.5–2.3 mm. J1924-2914 was the bandpass calibrator and Titan was the flux calibra-tor for all execution blocks. The average flux values for Titan were: 1.15 Jy in the USB and 1.01 Jy in the LSB for 2016 Novem-ber 11 and DecemNovem-ber 01; 0.963 Jy in the USB and 0.846 Jy in the LSB for 2017 March 15. The gain calibrator was differ-ent for each execution block: J1745-2900 on 2016 November 11, J1742-1517 on 2016 December 01, and J1733-1304 on 2017 March 15. The derived flux values for J1745-2900, J1742-1517, and J1733-1304 were 3.29, 0.212, and 1.47 Jy, respectively. All measurement sets were subsequently concatenated and time binned to 30 s integration time per visibility for imaging and analysis.
Band seven observations were obtained with the 12-m array over three execution blocks with 6.05 s integration steps and
2 As a methyl group molecule, methanol exists in three forms with
dif-ferent hydrogen spin symmetry properties. The A-type form has a total spin 3/2, while the E-type form is degenerate havingEaandEbvarieties
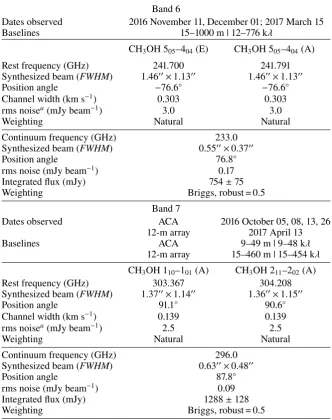
Table 1.HD 163296 observational parameters.
Band 6
Dates observed 2016 November 11, December 01; 2017 March 15
Baselines 15–1000 m | 12–776 kλ
CH3OH 505–404(E) CH3OH 505–404(A)
Rest frequency (GHz) 241.700 241.791
Synthesized beam (FWHM) 1.4600×1.1300 1.4600×1.1300
Position angle −76.6◦ −76.6◦
Channel width (km s−1) 0.303 0.303
rms noisea(mJy beam−1) 3.0 3.0
Weighting Natural Natural
Continuum frequency (GHz) 233.0
Synthesized beam (FWHM) 0.5500×0.3700
Position angle 76.8◦
rms noise (mJy beam−1) 0.17
Integrated flux (mJy) 754±75
Weighting Briggs, robust = 0.5
Band 7
Dates observed ACA 2016 October 05, 08, 13, 26
12-m array 2017 April 13
Baselines ACA 9–49 m | 9–48 kλ
12-m array 15–460 m | 15–454 kλ
CH3OH 110–101(A) CH3OH 211–202(A)
Rest frequency (GHz) 303.367 304.208
Synthesized beam (FWHM) 1.3700×1.1400 1.3600×1.1500
Position angle 91.1◦ 90.6◦
Channel width (km s−1) 0.139 0.139
rms noisea(mJy beam−1) 2.5 2.5
Weighting Natural Natural
Continuum frequency (GHz) 296.0
Synthesized beam (FWHM) 0.6300×0.4800
Position angle 87.8◦
rms noise (mJy beam−1) 0.09
Integrated flux (mJy) 1288±128
Weighting Briggs, robust = 0.5
Notes. Flux calibration accuracy is taken to be 10%. Table2shows details for the line transition data.(a)Noise levels are per image channel.
105 min total time on-source. Data was also obtained with the ACA over four execution blocks with 10.1 s integration steps and 184 min total time on-source. System temperatures varied from 80–150 K and the average precipitable water vapor varied from 0.5–1.1 mm. J1924-2914 was the bandpass calibrator for all exe-cution blocks. Titan, Neptune, J1733-1304, and J1751+0939 were used as flux calibrators. The average flux values were: Titan – 1.96 Jy in the USB and 1.82 Jy in the LSB for 2017 April 13; Neptune – 22.5 Jy in the USB and 21.2 Jy in the LSB for 2016 October 08, 26; J1733-1304 – 1.32 Jy (2017 April 13), 1.14 Jy (2016 October 13) in the USB and 1.36 Jy (2017 April 13), 1.18 Jy (2016 October 13) in the LSB; J1751+0939 – 1.58 Jy in the USB and 1.60 Jy in the LSB for 2016 October 05. The gain calibrators were J1733-1304 for the 12-m array data and J1745-2900 for the ACA data. The derived flux value for J1733-1304 was 1.36 Jy (2017 April 13) and the values for J1745-2900 were 3.2 Jy (2016 October 05, 08, 13), and 4.6 Jy (2016 October 26). All measurement sets were subsequently concatenated and time binned to 30 s integration time per visibility for imaging and analysis.
natural weighting for each continuum-subtracted CH3OH line with a uv taper to achieve a 100 beam in order to increase the
sensitivity.
This paper also makes use of Submillimeter Array (SMA) H2CO data for the HD 163296 disk (Qi et al. 2013), ALMA H2CO data for the HD 163296 disk (Carney et al. 2017), ALMA H2CO data for the TW Hya disk (Öberg et al. 2017), and ALMA CH3OH data for the TW Hya disk (Walsh et al. 2016). The following software and coding languages are used for data analysis: theCASApackage version 4.7.2 (McMullin et al. 2007) andPYTHON.
3. Results
No methanol lines listed in Table 1 are detected in the disk around HD 163296 neither individually nor after line stack-ing. In this section, we first describe the stacking and masking methods used to maximize the S/N to attempt to extract the disk-integrated intensity of the CH3OH lines. The method used to estimate the column density and abundance of methanol in the HD 163296 disk is then described. A comparison is presented between the CH3OH and H2CO content in the disks around HD 163296 and TW Hya based on data taken from the litera-ture. Finally, model spectra of the band seven CH3OH lines are created for HD 163296 and compared to the sensitivity of the observations.
3.1. Line extraction
We attempted to extract the targeted CH3OH lines from the CLEAN image cubes using a circular aperture with an 800
diam-eter centered on the source, which yielded no detections (Fig.1). To increase the S/N we repeated this analysis after stacking the CH3OH lines using different line stacking schemes. We further attempted to increase the S/N of the CH3OH data by applying masking techniques: Keplerian masking in the image plane, and matched filter analysis in theuvplane to search for any signal in the raw visibilities.
3.1.1. Line stacking
Stacking was done for band six and band seven lines separately, and then again for both bands together. The band seven lines are more easily excited due to their lower upper energy (Eu<22 K)
values compared to the band six lines (Eu>34 K; Table2), thus band seven observations should be sensitive to lower CH3OH column densities and should be easier to detect. We note that the level populations are likely to be in local thermodynamic equi-librium (LTE) for the expected methanol emitting region where gas densities in the disk are high (&107 cm−3), thus we do not
expect the critical density of the lines to influence the amount of line emission (Table2).
First, we stacked the lines in the image plane by adding together the integrated intensity maps (v=2.4–9.2 km s−1) cre-ated from the CH3OH continuum-subtracted and uv-tapered CLEAN image cubes. Second, we stacked in the uv plane by concatenating ALMA measurement sets prior to imaging. Stack-ing in the uv plane was done using the CASA cvel function, which was used to regrid the velocity axis of line data and has the option to combine visibility data for multiple lines. Foruv
stacking across all bands, the band seven lines were regridded to 0.303 km s−1 channels to match the channel width of the band
six lines. Methanol remains undetected after implementing the stacking methods described above.
0
2
4
6
8
10 12
Velocity [km
/
s]
0
100
200
300
400
500
600
700
800
Flux
Densit
y
[mJy]
CH
3OH
110−101A
211−202A
504−404E
504−404A
Circular aperture
Keplerian mask
to attempt to extract the
disk-Fig. 1.Spectra at the expected velocity of CH3OH line emission in the
HD 163296 disk showing non-detections from aperture-masked image cubes using an 800 diameter circular aperture (black) and
Keplerian-masked image cubes (magenta). The two bottom spectra are observed in band seven in 0.139 km s−1channels while the two top spectra are in
band six in 0.303 km s−1channels. The horizontal gray dashed line
rep-resents the spectrum baseline, which is offset by 200 mJy for each line. The vertical red dashed line shows the systemic velocity at 5.8 km s−1
(Qi et al. 2011).
3.1.2. Keplerian masking in the image plane
For maximum S/N in the image plane, we applied a Keplerian mask to the CLEAN image cube for each CH3OH line (Carney et al. 2017;Salinas et al. 2017) to exclude noisy pixels that are not associated with the emission expected from a disk in Keplerian rotation. The mask is based on the velocity profile of a rotat-ing disk, which is assumed to be Keplerian around a central stellar mass of M=2.3 M (Alecian et al. 2013). A subset of
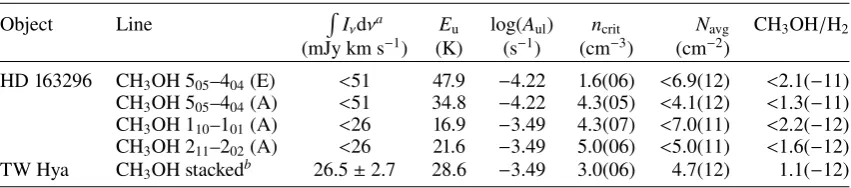
[image:4.595.315.549.82.452.2]Table 2.Disk-averaged column density and abundance of CH3OH in HD 163296 and TW Hya.
Object Line R
Iνdνa Eu log(Aul) ncrit Navg CH3OH/H2 (mJy km s−1) (K) (s−1) (cm−3) (cm−2)
HD 163296 CH3OH 505–404(E) <51 47.9 −4.22 1.6(06) <6.9(12) <2.1(−11) CH3OH 505–404(A) <51 34.8 −4.22 4.3(05) <4.1(12) <1.3(−11) CH3OH 110–101(A) <26 16.9 −3.49 4.3(07) <7.0(11) <2.2(−12) CH3OH 211–202(A) <26 21.6 −3.49 5.0(06) <5.0(11) <1.6(−12)
TW Hya CH3OH stackedb 26.5±2.7 28.6 −3.49 3.0(06) 4.7(12) 1.1(−12)
Notes. The disk-averaged column density is calculated using Eq. (1) withTex= 25 K. The formata(b) translates to a×10b. Flux errors are
dominated by systematic uncertainties, taken to be 10%.(a)Upper limits are derived at the 3σlevel using the HD 163296 Keplerian mask (Sect.3). (b)The stacked detection consists of three CH3OH transitions: CH3OH 211–202 (A) at 304.208 GHz, CH3OH 312–303 (A) at 305.472 GHz, and
CH3OH 413–404(A) at 307.166 GHz. Excitation parameters for the CH3OH 312–303(A) line are used to calculate column density. References.Rabli & Flower(2010);Walsh et al.(2016).
Upper limits on the integrated intensity for each CH3OH line were calculated using the projected Keplerian mask (x, y, vK) derived for the HD 163296 disk. To obtain the strictest upper limits on the integrated line intensity, we included only the posi-tions and velocities associated with the disk. Therefore, the mask cube contains pixels set equal to unity for (x, y, vK) positions only, and all other pixels are set to zero. The upper limit is set at 3σ where σ=δv√Nσrms, δv is the velocity channel width in km s−1,Nis the number of independent measurements
con-tained within the projected Keplerian mask, andσrmsis the rms noise per channel in mJy beam−1(Table1). To account for
cor-related noise within the size of the beam, we summed over all (x, y, vK) pixel positions and divide by the number of pixels per beamnppb, to getN= Σ(x, y, vK)/nppb, the number of inde-pendent measurements over the integrated Keplerian mask. The disk-integrated upper limits for each CH3OH line are listed in Table2.
3.1.3. Matched filter analysis in theuvplane
To maximize the S/N in theuvplane, we applied a matched filter to the CH3OH line visibility data (Loomis et al. 2018). In this technique, a template image cube is sampled inuvspace to obtain a set of template visibilities that act as the filter. The filter is then cross-correlated with a set of low S/N visibilities (in this case, the CH3OH data) in an attempt to detect any signal that is co-spatial with the template emission. Loomis et al. (2018) andCarney et al.(2017) have published positive detections using the matched filter technique for CH3OH and H2CO, which can provide an improvement in S/N of >50–500% over the traditional aperture masking, depending on the spectral resolution of the observed visibilities.
We used the H2CO 303–202detection toward the HD 163296 disk reported inCarney et al. (2017) as the template emission profile under the assumption that CH3OH and H2CO reside in similar regions. The emission morphologies will be domi-nated primarily by Keplerian rotation, therefore a high degree of co-spatiality is expected. The H2CO line was re-imaged with CLEAN to achieve a spatial and spectral resolution equal to the observed CH3OH lines. Channels with H2CO emission (v=1.6−10 km s−1) are sampled inuvspace using thePYTHON
vis_sample3 routine. The matched filter was run for the CH3OH line visibility data individually and after line stacking. 3 vis_sample is publicly available at https://github.com/ AstroChem/vis_sample or in the Anaconda Cloud at https:// anaconda.org/rloomis/vis_sample
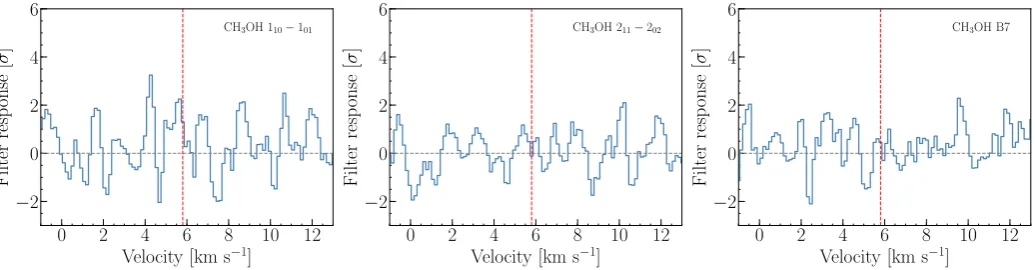
Figure2shows the spectrum that is produced by the matched filter analysis for the band seven CH3OH data. The filter response in units ofσis the measure of the S/N of the cross-correlation between the CH3OH line visibility data and the filter derived from the template H2CO emission. A correlation between the CH3OH data and the filter would result in a peak at the source velocity. No such feature is seen in the filter response spectrum of any CH3OH lines in the HD 163296 disk, suggesting that the detection threshold for methanol is well below the sensitivity achieved in our ALMA observations. The matched filter anal-yses confirm the non-detection of CH3OH found during analysis in the image plane. The same analysis for the band six lines also results in no detection, which is expected given that the band seven lines should be brighter.
3.2. CH3OH column density and abundance upper limits
We calculated the disk-averaged column density of CH3OH based on the integrated line intensity upper limit, an assumed excitation temperature, and the total disk mass. Following the formula used by Remijan et al.(2003) and Miao et al. (1995) for optically thin emission in local thermodynamic equilibrium (LTE), we can estimate the column density
N=2.04
R
Iνdv
θaθb
Qrotexp(Eu/Tex)
ν3hSulµ2i ×1020cm
−2, (1)
whereR
Iνdvis the integrated line intensity in Jy beam−1km s−1,
θa and θb correspond to the semi-major and semi-minor axes of the synthesized beam in arcseconds, Tex is the excitation
temperature in K, and νis the rest frequency of the transition in GHz. The partition function (Qrot), upper energy level (Eu,
in K), and the temperature-independent transition strength and dipole moment (Sulµ2, in debye2) for CH3OH are taken from the
Cologne Database for Molecular Spectroscopy (CDMS;Müller et al. 2005).
Methanol is expected to form primarily in ice in cold regions of protoplanetary disks, where gas densities are higher (∼109 cm−3;Walsh et al. 2014) than the critical density of the
observed CH3OH transitions (106−107 cm−3; Rabli & Flower 2010). Recent physical models of the HD 163296 disk have gas densities >106 cm−3 in the regionz/r<0.4 (Qi et al. 2011;
de Gregorio-Monsalvo et al. 2013;Rosenfeld et al. 2013), where
zandrare the disk height and radius, respectively. In recent
0 2 4 6 8 10 12 Velocity [km s−1]
−2
0 2 4 6
Filter
resp
onse
[
σ
]
CH3OH 110−101
0 2 4 6 8 10 12
Velocity [km s−1]
−2
0 2 4 6
Filter
resp
onse
[
σ
]
CH3OH 211−202
0 2 4 6 8 10 12
Velocity [km s−1]
−2
0 2 4 6
Filter
resp
onse
[
σ
]
[image:6.595.41.559.82.217.2]CH3OH B7
Fig. 2.Matched filter results for the band seven CH3OH lines in the HD 163296 disk using the H2CO emission as a template. A peak>3σat the
source velocity (v=5.8 km s−1; red dashed line) would signify a positive detection of methanol. The band seven lines should be the strongest in our
sample, but there is no evidence of CH3OH in the matched filter for the band seven individual lines nor the band seven stacked lines.Left panel:
CH3OH 110–101(A) line.Middle panel: CH3OH 211–202(A) line.Right panel: stacked band seven CH3OH lines.
0.2<z/r<0.3, which all fit the data equally well. These models all have methanol present atz/r<0.3, suggesting that emission is arising from dense regions within the disk. Under these condi-tions, LTE is a reasonable assumption, and thusTexis expected to equal the kinetic temperature of the gas.
Assuming optically thin emission, the disk-averaged column density can be used to estimate the total number of CH3OH molecules in the disk N(CH3OH)=Navg(a×b), where (a×b)
is the total emitting area of the disk. Assuming the total disk mass is primarily molecular hydrogen, we can estimate the total number of H2moleculesN(H2)=Mdisk/mH2, wheremH2 is the molecular hydrogen mass. The CH3OH emitting area was set to a=b=700 based on the H2CO emission diameter in the HD 163296 disk (Carney et al. 2017), assuming a similar chem-ical origin and distribution. The total disk mass is ∼0.09 M
based on models of CO observations (Qi et al. 2011;Rosenfeld et al. 2013). Table2shows the disk-averaged column density and abundance for the single temperature assumptionTex= 25 K in
LTE, which is approximately the same as the excitation tem-perature found for H2CO in the HD 163296 disk (Qi et al. 2013; Carney et al. 2017). The CH3OH 211–202 (A) line pro-vides the strictest upper limit on the methanol column density and abundance in HD 163296, with Navg . 5.0×1011 cm−2
and CH3OH/H2.1.6×10−12, based on its disk-integrated line intensity upper limit and assuming an excitation temperature of
Tex=25 K. TableA.1shows the disk-averaged column density
and abundance for a range of LTE excitation conditions with
Tex= 25, 50, and 75 K. The abundances do not vary withTex
by more than a factor of 2–3 in the most extreme cases.
3.3. CH3OH and H2CO in HD 163296 and TW Hya
We estimated the fraction of methanol relative to formaldehyde in the HD 163296 disk, based on our upper limits for CH3OH, and in the TW Hya disk, the only Class II protoplanetary disk for which there is a gas-phase methanol detection (Walsh et al. 2016). Integrated line intensities for H2CO detections in HD 163296 and TW Hya were taken from the literature, and their disk-averaged column densities and abundances were derived in the same manner as described in Sect.3.2to ensure consistency when comparing the H2CO and CH3OH content. The TW Hya disk mass is 0.05 M based on observations of
the HD molecule (Bergin et al. 2013). The emitting area for H2CO in TW Hya was set toa=b=300 based on the diameter
of emission observed by Öberg et al. (2017). The same 300
emitting area was used for CH3OH in TW Hya. Table3shows the calculated column densities and abundances for the H2CO observations.
For HD 163296, the CH3OH 211–202 (A) line was used to calculate the methanol-to-formaldehyde ratio as it gives the strictest upper limits on the methanol abundance. For TW Hya, we obtained the integrated line intensity of the stacked methanol detection byWalsh et al.(2016), assumed that the majority of emission is due to the strongest individual line (CH3OH 312– 303 (A) at 305.473 GHz with Eu= 28.6 K:Walsh et al. 2014; Loomis et al. 2018), and used the excitation parameters of that line with Eq. (1) to derive the TW Hya CH3OH column density and abundance, and subsequently the methanol-to-formaldehyde ratio for the disk.
Results for CH3OH/H2CO in TW Hya and HD 163296 can be found in Table 3. Ratios calculated with the H2CO 312–211 line should be representative of the true methanol-to-formaldehyde ratio since the H2CO 312–211 upper energy level (Eu), Einstein A coefficient (Aul), and critical density (ncrit) are similar to that of the band seven methanol lines observed in these disks. Thus, we obtain CH3OH/H2CO < 0.24 for HD 163296 and 1.27 for TW Hya, which suggests that the disk around HD 163296 is less abundant in methanol relative to formaldehyde compared to the TW Hya disk.
3.4. Model CH3OH spectra for HD 163296
In addition to the extraction methods described in previous sections, we also attempted a forward modeling approach to interpret the CH3OH non-detections toward HD 163296. We modeled the HD 163296 CH3OH band seven spectra using a parameterized disk structure and radiative transfer methods in order to compare the modeled emission to the noise level in the Keplerian-masked image cubes. We adopted the physical struc-ture and the abundance strucstruc-ture of the model used byCarney et al.(2017) to reproduce ALMA observations of H2CO in the HD 163296 disk, then scaled the CH3OH abundance with respect to the H2CO abundance. The Line Modeling Engine (LIME; Brinch & Hogerheijde 2010) 3D radiative transfer code was run in LTE with 10000 grid points at the source distance of the original Qi et al. (2011) physical model (d=122 pc) to
cre-ate synthetic images of the CH3OH observations. The synthetic images were continuum-subtracted, sampled inuvspace with the
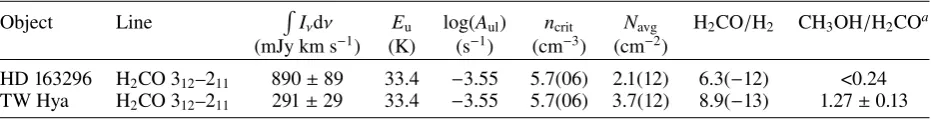
Table 3.Disk-averaged column density and abundance of H2CO in HD 163296 and TW Hya.
Object Line R
Iνdν Eu log(Aul) ncrit Navg H2CO/H2 CH3OH/H2COa (mJy km s−1) (K) (s−1) (cm−3) (cm−2)
HD 163296 H2CO 312–211 890±89 33.4 −3.55 5.7(06) 2.1(12) 6.3(−12) <0.24
TW Hya H2CO 312–211 291±29 33.4 −3.55 5.7(06) 3.7(12) 8.9(−13) 1.27±0.13
Notes.The disk-averaged column density was calculated using Eq. (1) withTex= 25 K. The formata(b) translates toa×10b. Flux errors are
dominated by systematic uncertainties, taken to be 10%.(a)Ratios are determined using the CH
3OH disk-integrated column density from Table2.
HD 163296: based on the strictest upper limit from the CH3OH 211–202(A) line. TW Hya: based on the stacked CH3OH detection. References.Wiesenfeld & Faure(2013);Qi et al.(2013);Öberg et al.(2017).
Figure 3 shows the disk-integrated model spectra for the CH3OH band seven lines for a range of methanol-to-formaldehyde ratios, as indicated by the legend. The spectra show that a line should have been detected in the disk around HD 163296 for CH3OH/H2CO≈ 0.2 for the most sensitive case (stacked band seven lines). This result is consistent with the upper limit on this ratio derived from the integrated intensity of the Keplerian mask cube as presented in Sect.3.3.
4. Discussion
The results presented in Table 3 suggest that the HD 163296 disk has a lower overall gas-phase methanol content with respect to formaldehyde than the TW Hya disk. In this section we dis-cuss possible reasons for a lower methanol-to-formaldehyde ratio in HD 163296, as well as a brief assessment of the observing time needed to detect the low predicted abundances of gas-phase methanol in this disk.
4.1. CH3OH/H2CO in HD 163296 and TW Hya
It should be noted that there are uncertainties on the order of a factor of a few when deriving the methanol-to-formaldehyde ratio as described in this work. Namely, the column density cal-culation for the methanol detection in TW Hya is a result of three stacked line transitions rather than a single common transition as for H2CO observed in both disks. The CH3OH 312–303(A) line at 305.473 GHz is the strongest methanol line observed in TW Hya, but it is not the sole contributor to the detected line emis-sion. However, even if all three lines are equally strong and the 305.473 GHz line contributes only 33% to the total stacked line intensity, then the inferred TW Hya value for CH3OH/H2CO of 0.42 is still higher than our upper limit for HD 163296 of <0.24. Matched filter analysis of the TW Hya CH3OH detections (e.g., Fig. 7 inLoomis et al. 2018) shows that the CH3OH 312–303(A) line is indeed stronger than the other two band seven lines used byWalsh et al.(2016) for line stacking, suggesting that a contribution of ∼50% to the stacked emission is a reasonable
estimate.
Modeling by Willacy (2007) explores complex gas-grain chemical models of protoplanetary disks including H2CO and CH3OH with the following desorption processes: thermal des-orption, desorption due to cosmic-ray heating of grains, and photodesorption. Their models, based on the UMIST Database for Astrochemistry network, show that outer disk abundances should give CH3OH/H2CO ≈ 0.04, which is lower than both the ratio found for TW Hya and the upper limit on the ratio found for HD 163296. However, these models neglect radical– radical pathways to form larger complex organic molecules. Gas-grain chemical models bySemenov & Wiebe(2011) based
on the Ohio State University (OSU) network predict low col-umn densities of methanol ice due to the high diffusion barrier used in the grain-surface chemistry, which highlights the impor-tance of the assumed chemical parameters in these models. Their models and work byFuruya & Aikawa (2014) show that pro-duction of CH3OH is sensitive to turbulent mixing and that the abundance of gas-phase CH3OH, and thus the methanol-to-formaldehyde ratio, will increase when turbulent mixing is strong. The HD 163296 disk has a low degree of turbulence .0.05 cs (Flaherty et al. 2015,2017), while the TW Hya disk has similar low values of.0.05–0.10cs (Flaherty et al. 2018),
suggesting vertical mixing is not strong in these disks.
Other recent work byWalsh et al.(2014) based on the OSU network investigates the production of complex molecules in disks, including H2CO and CH3OH, using an extensive full chemical network with chemical ingredients similar to the previ-ously mentioned works. Their models include two-body, X-ray, and cosmic ray reactions and photoreactions in the gas phase and on grain surfaces as all as gas-grain reactions (e.g., freeze-out and photodesorption) around a T Tauri-like PMS star. The mod-els in that work show that their outer disk (R=250 AU) hosts a
large methanol and formaldehyde ice reservoir with a sufficient number of these molecules released into the gas phase to give CH3OH/H2CO≈0.33. Subsequent work byWalsh et al.(2015)
examines molecular complexity across different luminosities (M dwarf, T Tauri, Herbig Ae/Be) for the inner disk following a similar modeling approach. The authors find that molecular organics like H2CO and CH3OH contribute to the disk gas-phase carbon and oxygen reservoir for the cooler PMS stars, but not for the warmer Herbig Ae/Be PMS stars. These modeling results perhaps point to important differences in how these two molecules are formed in T Tauri disks versus Herbig Ae/Be disks.
The underlying physical structure in the TW Hya disk and the HD 163296 disk might explain the observed discrepancy between their methanol-to-formaldehyde ratios. Recent observa-tions of submillimeter and scattered light in these disks highlight important differences in their dust structure. The micron-sized dust observed in scattered light is highly coupled to the gas and traces the surface layers of the disk, while millimeter-sized dust has mostly decoupled from the gas and settled toward the disk midplane (Dullemond & Dominik 2004; D’Alessio et al. 2006;Williams & Cieza 2011). The TW Hya disk was observed with ALMA in the band six continuum at 850 µm and with VLT/SPHERE in H-band at 1.62 µm (Andrews et al. 2016;
0
2
4
6
8
10
12
Velocity [km s
−1]
−
10
0
10
20
30
40
50
Flux
Densit
y
[mJy]
CH3OH 110−101
CH3OH/H2CO
1.0 0.8 0.6 0.4 0.2 0.1 0.02
0
2
4
6
8
10
12
Velocity [km s
−1]
−
10
0
10
20
30
40
50
Flux
Densit
y
[mJy]
CH3OH 211−202
CH3OH/H2CO
1.0 0.8 0.6 0.4 0.2 0.1 0.02
0
2
4
6
8
10
12
Velocity [km s
−1]
−
10
0
10
20
30
40
50
Flux
Densit
y
[mJy]
CH3OH B7
CH3OH/H2CO
1.0 0.8 0.6 0.4 0.2 0.1 0.02
[image:8.595.59.270.78.595.2]warmer Herbig Ae
Fig. 3. Model CH3OH spectra at different methanol-to-formaldehyde
abundance ratios (colored dashed lines) compared to the ALMA CH3OH non-detections after Keplerian masking (gray) in the
HD 163296 disk. Given the sensitivity levels achieved, the ALMA observations should be sensitive to the presence of methanol in the disk for CH3OH/H2CO&0.2 based on the stacked band seven lines.Top panel: CH3OH 110–101(A) line.Middle panel: CH3OH 211–202(A) line. Bottom panel: stacked band seven CH3OH lines.
ALMA 1.3 mm observations of the HD 163296 disk show that no scattered light is observed beyond the innermost millimeter dust ring, suggesting that the surface layers of the outer disk are relatively flat and may be shadowed by the innermost dust ring (Muro-Arena et al. 2018;Guidi et al. 2018). Ultraviolet radia-tion from the central star can release molecular ices back into the gas phase via UV photodesorption (Öberg et al. 2009,2015;
Huang et al. 2016), which may be suppressed if the HD 163296 outer disk is shadowed.
Alternatively, both disks may have a similar degree of UV irradiation, but as a Herbig Ae star HD 163296 will have a harder UV spectrum than TW Hya, which is dominated by Lyman-αemission (e.g., Fig. 1 inWalsh et al. 2015). The UV photodesorption rate of methanol ice is a strong function of pho-ton energy and absorption cross section (Cruz-Diaz et al. 2016), and therefore will depend on the shape of the radiation field as well as the strength (Bertin et al. 2016). A harder, stronger Her-big Ae radiation field will lead to more CH3OH fragmentation upon photodesorption and thus methanol ice will be converted into other gas-phase species which could go on to seed H2CO formation in the gas phase.
Another possibility is that the HD 163296 disk formed from a protostar that did not inherit a large amount of methanol ice. Perhaps during formation, temperatures remained too warm for CO freeze-out needed to produce the high methanol-to-formaldehyde ice ratios seen in ISM ices. Chemical models with some methanol already formed at earlier stages (Walsh et al. 2014) host a more abundant methanol ice reservoir than mod-els which start from atomic abundances, which have orders of magnitude lower methanol ice abundances (e.g.,Molyarova et al. 2017).
While both formaldehyde and methanol are thought to be formed via hydrogenation of CO ices (Watanabe & Kouchi 2002), formaldehyde can also be formed in the gas phase. Recent chemical models by Agúndez et al.(2018) that do not include grain-surface chemistry are able to reproduce observed column densities of H2CO, but not CH3OH, in the outer regions of T Tauri and Herbig Ae/Be disks. Reactions between CH3 and atomic oxygen can occur in the disk surface layers where oxygen-bearing species are photodissociated (Fockenberg & Preses 2002; Atkinson et al. 2006). This reaction, however, has not been shown to contribute significantly to the H2CO abundance in recent chemical models of disks around T Tauri stars (Walsh et al. 2014). The contribution may be larger in warmer, strongly irradiated disks around Herbig Ae/Be stars. Ion-molecule chem-istry – which has a large influence on the gas-phase reservoir in the intermediate layers of protoplanetary disks – involving for example HCO+, H3O+, and H+
3 may also contribute to the overall gas-phase H2CO abundance (Vasyunin et al. 2008). It may be that the HD 163296 disk is particularly rich in H2CO formed in the gas phase, thus reducing its overall methanol-to-formaldehyde ratio. However, results from a recent analysis using the ortho-to-para ratio of H2CO as a tool to investigate its chemical origins are consistent with significant grain-surface formation and subsequent desorption (Guzmán et al. 2018). Detailed chemical models of the HD 163296 protoplanetary disk beyond the scope of this work are required to test and quan-tify the importance of the production and destruction routes for H2CO and CH3OH discussed here.
4.2. Detectability of methanol
We can estimate the required ALMA observing time for a 3σ
detection of CH3OH in the HD 163296 disk given a range of CH3OH/H2CO values consistent with our upper limit of<0.24. We considered methanol abundances relative to formaldehyde of 0.20, 0.10, 0.05, as these would be below our current 3σ
respectively. Because the telescope sensitivity is inversely pro-portional to the square root of the observing time,σS∝1/√t,
the time required to realize these increases in sensitivity would multiply by factors of 2.25, 6.25, and 25, respectively. Based on the band seven observations presented here with 105 min of total on-source time, these factors translate to total on-source times of
∼4,∼11,∼44 h for methanol at 20, 10, and 5% of the
formalde-hyde content in HD 163296, respectively. The detection of 10% methanol relative to formaldehyde is a clear practical limit for the HD 163296 disk based on these required integration times.
Disk size has a significant effect on methanol detectability. Using our HD 163296 model, we decreased the outer radius of the disk and scaled the disk physical structure (i.e., gas den-sity and temperature) proportionally to test the effect of disk size on the band seven methanol line strengths for Herbig disks similar to HD 163296. The LIME models were rerun for an outer disk radius fromRout=100–600 AU in steps of 50 AU for CH3OH/H2CO = 0.10. The disk-integrated line intensity for the band seven CH3OH lines decreases by one order of magnitude for disks with Rout= 250 AU and by more than two orders of
magnitude for disks withRout= 100 AU. It is highly unlikely that methanol will be detected within an observing time of<20 h in most disks smaller than∼300 AU, considering the difficulty in
detecting methanol relative to formaldehyde at the<25% level in the HD 163296 disk, which has a radius of∼550 AU and a
proximity closer than most nearby star-forming regions. These results depend on the assumption that CH3OH shares the same extended emitting area as H2CO.
It may be that the methanol lines targeted in this work are not suitable candidates for disks around Herbig Ae/Be stars. The choice to target these four CH3OH lines with ALMA in band six and band seven was motivated by the chemical modeling of a disk around a T Tauri star (Walsh et al. 2014) and by the methanol detection in the disk around TW Hya, also a T Tauri star (Walsh et al. 2016). Disks around Herbig Ae/Be stars are warmer, with a larger thermally desorbed inner reservoir due to the stronger stel-lar radiation. There is a potential reservoir of hot methanol in the inner disk atmosphere, similar to the hot water reservoir already observed in disks around less luminous T Tauri stars (Carr & Najita 2008;Salyk et al. 2008). Such emission could be compact yet still accessible in Herbig Ae/Be disks.
In summary, the CH3OH lines in ALMA band seven pre-sented here should be detectable in disks with CH3OH/H2CO as low as∼10% within realistic observing times, but only in disks
with similar mass, size, distance, and H2CO abundance as those found in the HD 163296 disk.
5. Conclusions
This paper presents ALMA observations targeting two CH3OH lines in band six and two CH3OH lines in band seven in the protoplanetary disk around HD 163296. We determine upper limits on the abundance of methanol likely to be present in the HD 163296 disk and compare to TW Hya, currently the only Class II disk with a positive detection of gas-phase methanol. The conclusions of this work are as follows:
– None of the four CH3OH lines are detected in the disk around HD 163296 individually nor after line stacking. Upper limits on the integrated intensity at the 3σ level are <51 mJy km s−1 for band six lines and <26 mJy km s−1 for band seven lines. Neither aperture masking in the image plane, Keplerian masking in the image plane, nor matched filter analysis in theuvplane recover any methanol emission,
indicating that our calculated 3σ upper limits are highly robust.
– The CH3OH 211–202 (A) line provides the strictest upper limit on the disk-averaged column density and abundance of methanol in the HD 163296 disk, withNavg<5.0×1011cm−2
and CH3OH/H2.1.6×10−12at the 3σlevel.
– The upper limit on the methanol-to-formaldehyde ratio in the HD 163296 disk is CH3OH/H2CO<0.24 at the 3σlevel. This ratio is lower than that of the TW Hya disk at CH3OH/H2CO = 1.27±0.13, indicating that the HD 163296 disk has a low amount methanol with respect to formalde-hyde relative to the TW Hya disk.
– Possible explanations for the lower methanol-to-formaldehyde ratio in HD 163296 include: a low amount of gas-phase methanol is desorbed from icy grains at the disk midplane due to the flatter, shadowed disk geometry as seen in recent images taken by VLT/SPHERE; differences in the desorption processes in the HD 163296 disk compared to the TW Hya disk; and a higher-than-expected gas-phase formaldehyde abundance, as H2CO may also be formed in the gas phase in the disk upper layers.
– To detect methanol at the 3σlevel in the HD 163296 disk, we estimate that it is necessary to increase the total on-source observing time with the full ALMA 12-meter array up to 4 h to be sensitive to CH3OH/H2CO≈20% and up to 11 h to be
sensitive to CH3OH/H2CO≈10%. These estimates apply to other Herbig Ae/Be disks with masses, sizes, and distances similar to that found for the HD 163296 disk.
Acknowledgements.The authors acknowledge support by Allegro, the European
ALMA Regional Center node in The Netherlands, and expert advice from Luke Maud. M.T.C. and M.R.H. acknowledge support from the Netherlands Organisation for Scientific Research (NWO) grant 614.001.352. V.V.G. acknowl-edges support from the National Aeronautics and Space Administration under grant No. 15XRP15 20140 issued through the Exoplanets Research Program. C.W. acknowledges financial support from the University of Leeds and fund-ing from STFC (grant number ST/R000549/1). This paper makes use of the following ALMA data: ADS/JAO.ALMA#2016.1.00884.S and #2013.1.01268.S. L.I.C. acknowledges the support of NASA through Hubble Fellowship grant HST-HF2-51356.001-A awarded by the Space Telescope Science Institute, which is operated by the Association of Universities for Research in Astronomy, Inc., for NASA, under contract NAS 5-26555. ALMA is a partnership of ESO (rep-resenting its member states), NSF (USA) and NINS (Japan), together with NRC (Canada), NSC and ASIAA (Taiwan), and KASI (Republic of Korea), in coop-eration with the Republic of Chile. The Joint ALMA Observatory is operated by ESO, AUI/NRAO and NAOJ.
References
Agúndez, M., Roueff, E., Le Petit, F., & Le Bourlot, J. 2018,A&A, 616, A19 Aikawa, Y., Momose, M., Thi, W.-F., et al. 2003,PASJ, 55, 11
Alecian, E., Wade, G. A., Catala, C., et al. 2013,MNRAS, 429, 1001 Andrews, S. M., Wilner, D. J., Zhu, Z., et al. 2016,ApJ, 820, L40
Atkinson, R., Baulch, D. L., Cox, R. A., et al. 2006,Atm. Chem. Phys., 6, 3625 Bergin, E. A., Cleeves, L. I., Gorti, U., et al. 2013,Nature, 493, 644
Bertin, M., Romanzin, C., Doronin, M., et al. 2016,ApJ, 817, L12
Boogert, A. C. A., Gerakines, P. A., & Whittet, D. C. B. 2015,ARA&A, 53, 541 Bottinelli, S., Boogert, A. C. A., Bouwman, J., et al. 2010,ApJ, 718, 1100 Brinch, C., & Hogerheijde, M. R. 2010,A&A, 523, A25
Carney, M. T., Hogerheijde, M. R., Loomis, R. A., et al. 2017,A&A, 605, A21 Carr, J. S., & Najita, J. R. 2008,Science, 319, 1504
Collings, M. P., Anderson, M. A., Chen, R., et al. 2004,MNRAS, 354, 1133 Cruz-Diaz, G. A., Martín-Doménech, R., Muñoz Caro, G. M., & Chen, Y.-J.
2016,A&A, 592, A68
Cuppen, H. M., van Dishoeck, E. F., Herbst, E., & Tielens, A. G. G. M. 2009, A&A, 508, 275
D’Alessio, P., Calvet, N., Hartmann, L., Franco-Hernández, R., & Servín, H. 2006,ApJ, 638, 314
Drozdovskaya, M. N., Walsh, C., Visser, R., Harsono, D., & van Dishoeck E. F. 2014,MNRAS, 445, 913
Dullemond, C. P., & Dominik, C. 2004,A&A, 421, 1075
Flaherty, K. M., Hughes, A. M., Rosenfeld, K. A., et al. 2015,ApJ, 813, 99 Flaherty, K. M., Hughes, A. M., Rose, S. C., et al. 2017,ApJ, 843, 150 Flaherty, K. M., Hughes, A. M., Teague, R., et al. 2018,ApJ, 856, 117 Fockenberg, C., & Preses, J. M. 2002,J. Phys. Chem. A, 106, 2924
Friberg, P., Madden, S. C., Hjalmarson, A., & Irvine, W. M. 1988,A&A, 195, 281
Furuya, K., & Aikawa, Y. 2014,ApJ, 790, 97
Gaia Collaboration (Brown, A. G. A., et al.) 2018,A&A, 616, A1 Garrod, R. T., & Herbst, E. 2006,A&A, 457, 927
Graninger, D. M., Wilkins, O. H., & Öberg, K. I. 2016,ApJ, 819, 140
Grim, R. J. A., Baas, F., Geballe, T. R., Greenberg, J. M., & Schutte, W. A. 1991, A&A, 243, 473
Guidi, G., Ruane, G., Williams, J. P., et al. 2018,MNRAS, 479, 1505 Guzmán, V. V., Öberg, K. I., Carpenter, J., et al. 2018,ApJ, 864, 170 Herbst, E., & van Dishoeck, E. F. 2009,ARA&A, 47, 427
Huang, J., Öberg, K. I., & Andrews, S. M. 2016,ApJ, 823, L18 Isella, A., Guidi, G., Testi, L., et al. 2016,Phys. Rev. Lett., 117, 251101 Kristensen, L. E., van Dishoeck, E. F., van Kempen, T. A., et al. 2010,A&A, 516,
A57
Lee, C.-F., Li, Z.-Y., Ho, P. T. P., et al. 2017,ApJ, 843, 27
Loomis, R. A., Cleeves, L. I., Öberg, K. I., Guzman, V. V., & Andrews, S. M. 2015,ApJ, 809, L25
Loomis, R. A., Öberg, K. I., Andrews, S. M., et al. 2018,AJ, 155, 182 Mathews, G. S., Klaassen, P. D., Juhász, A., et al. 2013,A&A, 557, A132 McMullin, J. P., Waters, B., Schiebel, D., Young, W., & Golap, K. 2007, in
Astro-nomical Data Analysis Software and Systems XVI, eds. R. A. Shaw, F. Hill, & D. J. Bell,ASP Conf. Ser., 376, 127
Miao, Y., Mehringer, D. M., Kuan, Y.-J., & Snyder, L. E. 1995,ApJ, 445, L59 Molyarova, T., Akimkin, V., Semenov, D., et al. 2017,ApJ, 849, 130
Müller, H. S. P., Schlöder, F., Stutzki, J., & Winnewisser, G. 2005,J. Mol. Struct., 742, 215
Muro-Arena, G. A., Dominik, C., Waters, L. B. F. M., et al. 2018,A&A, 614, A24
Öberg, K. I., Garrod, R. T., van Dishoeck, E. F., & Linnartz, H. 2009,A&A, 504, 891
Öberg, K. I., Qi, C., Fogel, J. K. J., et al. 2010,ApJ, 720, 480 Öberg, K. I., Furuya, K., Loomis, R., et al. 2015,ApJ, 810, 112 Öberg, K. I., Guzmán, V. V., Merchantz, C. J., et al. 2017,ApJ, 839, 43 Pinte, C., Price, D. J., Ménard, F., et al. 2018,ApJ, 860, L13
Pontoppidan, K. M., van Dishoeck, E. F., & Dartois, E. 2004,A&A, 426, 925 Qi, C., D’Alessio, P., Öberg, K. I., et al. 2011,ApJ, 740, 84
Qi, C., Öberg, K. I., & Wilner, D. J. 2013,ApJ, 765, 34 Qi, C., Öberg, K. I., Andrews, S. M., et al. 2015,ApJ, 813, 128 Rabli, D., & Flower, D. R. 2010,MNRAS, 406, 95
Remijan, A., Snyder, L. E., Friedel, D. N., Liu, S.-Y., & Shah, R. Y. 2003,ApJ, 590, 314
Rosenfeld, K. A., Andrews, S. M., Hughes, A. M., Wilner, D. J., & Qi, C. 2013, ApJ, 774, 16
Salinas, V. N., Hogerheijde, M. R., Mathews, G. S., et al. 2017,A&A, 606, A125 Salyk, C., Pontoppidan, K. M., Blake, G. A., et al. 2008,ApJ, 676, L49 Semenov, D., & Wiebe, D. 2011,ApJS, 196, 25
Shimonishi, T., Onaka, T., Kato, D., et al. 2010,A&A, 514, A12
Skinner, C. J., Tielens, A. G. G. M., Barlow, M. J., & Justtanont, K. 1992,ApJ, 399, L79
Teague, R., Bae, J., Bergin, E. A., Birnstiel, T., & Foreman-Mackey, D. 2018, ApJ, 860, L12
van Boekel, R., Henning, T., Menu, J., et al. 2017,ApJ, 837, 132
van den Ancker, M. E., de Winter, D., & Tjin A Djie, H. R. E. 1998,A&A, 330, 145
van der Marel, N., van Dishoeck, E. F., Bruderer, S., & van Kempen, T. A. 2014, A&A, 563, A113
van Dishoeck, E. F., Blake, G. A., Jansen, D. J., & Groesbeck, T. D. 1995,ApJ, 447, 760
van ’t Hoff, M. L. R., Tobin, J. J., Trapman, L., et al. 2018,ApJ, 864, L23 Vasyunin, A. I., Semenov, D., Henning, T., et al. 2008,ApJ, 672, 629 Walsh, C., Millar, T. J., Nomura, H., et al. 2014,A&A, 563, A33 Walsh, C., Nomura, H., & van Dishoeck E. 2015,A&A, 582, A88 Walsh, C., Loomis, R. A., Öberg, K. I., et al. 2016,ApJ, 823, L10 Watanabe, N., & Kouchi, A. 2002,ApJ, 571, L173
Watanabe, N., Shiraki, T., & Kouchi, A. 2003,ApJ, 588, L121 Wiesenfeld, L., & Faure, A. 2013,MNRAS, 432, 2573 Willacy, K. 2007,ApJ, 660, 441
Appendix A: Molecular abundances for different
Tex
Here the disk-averaged column densities and abundances are shown for CH3OH and H2CO in the disk around HD 163296 and the disk around TW Hya for different excitation tem-peratures Tex. The method used is described in Sect. 3.2.
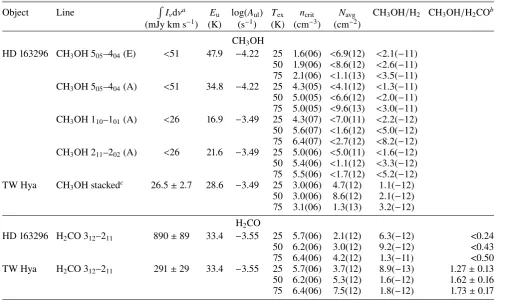
[image:11.595.49.556.217.519.2]Equation (1) assumes optically thin emission and LTE exci-tation conditions. The exciexci-tation temperature Tex was set to 25, 50 and 75 K, indicating different regions of the disk from which the emission lines may originate. At most, dif-ferences of factors 2–3 are seen in the disk-averaged col-umn density and abundance for the values of Tex explored here.
Table A.1.Disk-averaged column density and abundance of CH3OH and H2CO in HD 163296 and TW Hya for varyingTex.
Object Line R
Iνdνa Eu log(Aul) Tex ncrit Navg CH3OH/H2 CH3OH/H2COb (mJy km s−1) (K) (s−1) (K) (cm−3) (cm−2)
CH3OH
HD 163296 CH3OH 505–404(E) <51 47.9 −4.22 25 1.6(06) <6.9(12) <2.1(−11) 50 1.9(06) <8.6(12) <2.6(−11)
75 2.1(06) <1.1(13) <3.5(−11)
CH3OH 505–404(A) <51 34.8 −4.22 25 4.3(05) <4.1(12) <1.3(−11)
50 5.0(05) <6.6(12) <2.0(−11)
75 5.0(05) <9.6(13) <3.0(−11)
CH3OH 110–101(A) <26 16.9 −3.49 25 4.3(07) <7.0(11) <2.2(−12) 50 5.6(07) <1.6(12) <5.0(−12)
75 6.4(07) <2.7(12) <8.2(−12)
CH3OH 211–202(A) <26 21.6 −3.49 25 5.0(06) <5.0(11) <1.6(−12) 50 5.4(06) <1.1(12) <3.3(−12)
75 5.5(06) <1.7(12) <5.2(−12)
TW Hya CH3OH stackedc 26.5±2.7 28.6 −3.49 25 3.0(06) 4.7(12) 1.1(−12)
50 3.0(06) 8.6(12) 2.1(−12)
75 3.1(06) 1.3(13) 3.2(−12)
H2CO
HD 163296 H2CO 312–211 890±89 33.4 −3.55 25 5.7(06) 2.1(12) 6.3(−12) <0.24
50 6.2(06) 3.0(12) 9.2(−12) <0.43
75 6.4(06) 4.2(12) 1.3(−11) <0.50
TW Hya H2CO 312–211 291±29 33.4 −3.55 25 5.7(06) 3.7(12) 8.9(−13) 1.27±0.13
50 6.2(06) 5.3(12) 1.6(−12) 1.62±0.16
75 6.4(06) 7.5(12) 1.8(−12) 1.73±0.17
Notes. The formata(b) translates toa×10b. Flux errors are dominated by systematic uncertainties, taken to be 10%.(a)Upper limits are derived
at the 3σlevel using the HD 163296 Keplerian mask (Sect.3).(b)Ratios are determined using the CH
3OH disk-integrated column density from
Table2. HD 163296: based on the strictest upper limit from the CH3OH 211–202(A) line. TW Hya: based on the stacked CH3OH detection.(c)The
stacked detection consists of three CH3OH transitions: CH3OH 211–202(A) at 304.208 GHz, CH3OH 312–303(A) at 305.472 GHz, and CH3OH