Rochester Institute of Technology
RIT Scholar Works
Theses Thesis/Dissertation Collections
5-1-2007
Printability and environmental testing using
silver-based conductive flexographic ink printed on a
polyamide substrate
Kathryn Cole
Follow this and additional works at:http://scholarworks.rit.edu/theses
This Thesis is brought to you for free and open access by the Thesis/Dissertation Collections at RIT Scholar Works. It has been accepted for inclusion
Recommended Citation
Printability and Environmental Testing using Silver-based Conductive Flexographic Ink Printed on a Polyamide Substrate
by Kathryn O. Cole
A thesis submitted in partial fulfillment of the requirements for the degree of Master of Science
in the School of Print Media
in the College of Imaging Arts and Sciences of the Rochester Institute of Technology
May 2007
School of Print Media Rochester Institute of Technology
Rochester, New York
Certificate of Approval
Printability and Environmental Testing using Silver-based Conductive Flexographic Ink Printed on a Polyamide Substrate
This is to certify that the Master’s Thesis of
Kathryn O. Cole
has been approved by the Thesis Committee as satisfactory for the thesis requirement for the Master of Science degree
at the convocation of
May 2007
Thesis Committee:
Primary Thesis Advisor
Secondary Thesis Advisor
Thesis Consultant
Graduate Thesis Coordinator
Graduate Program Coordinator
Permission to Reproduce Thesis
Title of Thesis: Printability and Environmental Testing using Silver-based Conductive
Flexographic Ink Printed on a Polyamide Substrate
I, Kathryn O. Cole, hereby grant permission to the Wallace Memorial Library of R.I.T. to
reproduce my thesis in whole or in part. Any reproduction will not be for commercial use
or profit.
In loving memory of PFC David Michael Cole, Sr.
Whose fatherly guidance and encouragement
Acknowledgements
I would like to thank all who were involved in the journey of this thesis project.
Successful completion of my academic career would not have been possible without your
guidance and support.
My advisors, Dr. Scott Williams and Professor Deanna Jacobs for all of your
patience, expert knowledge and direction, without which I would have been lost in this
process. It was an honor to work with you both.
Omnova Solutions, Inc. for providing funding that allowed me to conduct such
professional-quality research.
Bob Sullivan and DuPont Packaging for the supply of the substrate used in this
project.
Kevin Landolt who has been more than a peer mentor and friend. Without your
continued love, support and encouragement I would not have made it to this point. I
thank you with all of my heart.
Finally, to all of my friends and collogues who have and will continue to support
Table of Contents
List of Tables ...viii
List of Figures... ix
Abstract ... xi
Chapter 1: Introduction... 1
Introduction ... 1
Statement of the Problem ... 2
Reason for Interest... 2
Chapter 2: Theoretical Basis... 3
Ink Principles ... 3
Determination of Ink Testing... 3
Substrate Principles ... 4
Nylon Substrates... 4
Print Production Principles ... 5
Color Space... 5
Rheology... 5
Surface Tension... 6
Packaging Principles ... 7
Primary Packaging... 7
Secondary Packaging... 7
Role of Nylon in Packaging... 8
Other Principles ... 8
Definition of Ohms/square... 8
Determination of Acceptable Resistance Limitation... 9
Notations ... 9
Chapter 3: Literature Review... 10
Introduction ... 10
RFID Technology Basics ... 10
History of RFID ... 12
Overview of Conductive Inks ... 15
Printed RFID and Packaging... 16
Conclusion... 17
Chapter 4: Research Statement... 19
Materials ... 20
Substrate... 20
Ink... 23
Printing ... 24
Print Samples... 27
Environmental Exposure ... 28
Control Set... 28
Environmental Conditions... 29
Ink Testing Procedures ... 34
Conductivity... 34
Density and Color... 35
Adhesion... 36
Abrasion... 38
Creasing... 40
Data Analysis ... 41
Limitations ... 41
Chapter 6: Results ... 43
Control Sets ... 43
Treatment of Control Sets... 43
Discussion of Treatment of Control Sets... 43
Test A – Conductivity ... 48
Discussion of Conductivity... 48
Test B – Density and Color ... 52
Density Test... 52
Discussion of Density... 52
Color Test... 56
Discussion of Color Test... 56
Delta E Comparison... 61
Test C– Adhesion ... 62
Discussion of Adhesion... 62
Test D – Abrasion ... 68
Discussion of Abrasion... 69
Test E – Creasing... 75
Determination of Acceptable Ink Film Thickness... 76
Chapter 7: Summary and Conclusions ... 78
Heat Set... 78
Freeze and Vacuum Set... 79
Rain Set... 79
Control Sets... 80
Creasing Test... 81
Summary ... 81
List of Tables
Table 1: List of units used in experiment... 9
Table 2: Brand description of RFID tags ... 12
Table 3: Print sample labels used ... 27
Table 4: Delta E values for Control Sets vs. Environmental Condition Sets ... 61
List of Figures
Figure 1: FTIR spectrum of nylon substrate sample and background air sample ... 22
Figure 2 (a),(b): RK K Printing Proofer, EP 5102/2 Rev.K anilox plate ... 25
Figure 3: Acceptable quality reference print... 26
Figure 4: Heat Set print samples mounted to chip board ... 29
Figure 5: Heat Set prints placed in Fisher Scientific Isotemp Oven ... 30
Figure 6: Heat Set samples after removal from environmental condition ... 30
Figure 7: Vacuum environment created with the use of a household vacuum ... 32
Figure 8: Rain Condition environment... 33
Figure 9: Rain Set prints after removal from environmental condition ... 33
Figure 10: Rain Set print after one hour acclimation period... 34
Figure 11: Print sample attached to table surface while tape is placed on to printed patch... 37
Figure 12: Use of rubber roller to remove air bubbles from under tape ... 37
Figure 13: Removal of tape from print sample ... 38
Figure 14: Nylon covered weight being released down inclined plane ... 39
Figure 15: Use of digital multimeter to obtain resistance measurement for each patch ... 39
Figure 16: Creasing of print sample ... 40
Figure 17: Placement of weights on print sample ... 41
Figure 18: Resistance Comparison of Control Set #1-4... 44
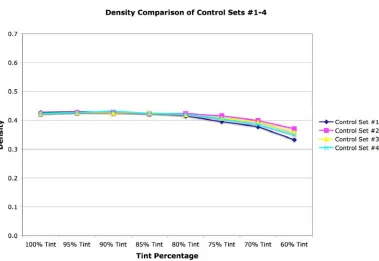
Figure 19: Density Comparison of Control Sets #1-4 ... 44
Figure 20: L* and a*, b* Comparison of Control Sets #1-4 ... 45
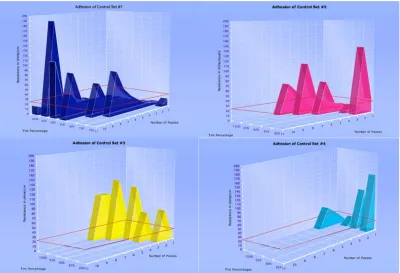
Figure 21: Adhesion Comparison of Control Sets #1-4 ... 46
Figure 22: Abrasion Comparison of Control Sets #1-4... 46
Figure 23: Resistance Comparison of Control Set #1 vs. Heat Set ... 50
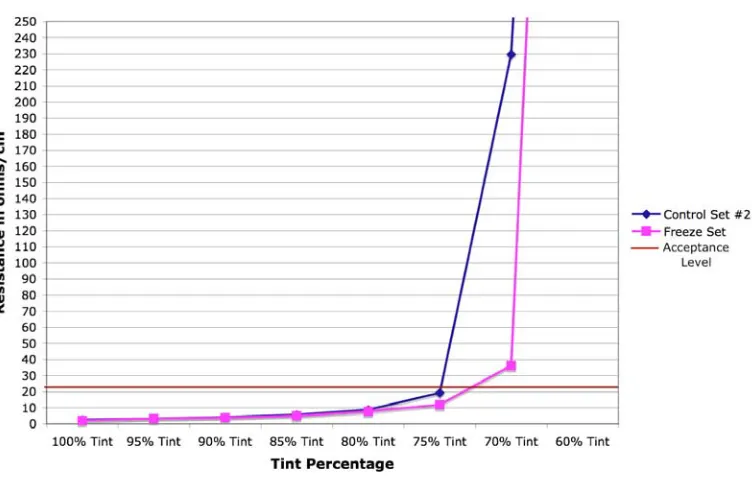
Figure 24: Resistance Comparison of Control Set #2 vs. Freeze Set... 50
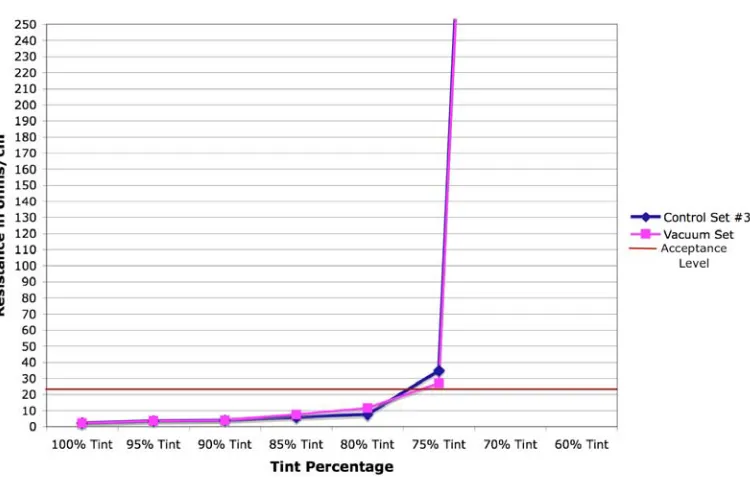
Figure 25: Resistance Comparison of Control Set #3 vs. Vacuum Set... 51
Figure 26: Resistance Comparison of Control Set #4 vs. Rain Set ... 51
Figure 27: Density Comparison of Control Set #1 vs. Heat Set ... 54
Figure 28: Density Comparison of Control Set #2 vs. Freeze Set... 54
Figure 29: Density Comparison of Control Set #3 vs. Vacuum Set... 55
Figure 30: Density Comparison of Control Set #4 vs. Rain Set ... 55
Figure 31: L* and a*, b* Comparison of Control Set #1 vs. Heat Set ... 57
Figure 33: L* and a*, b* Comparison of Control Set #3 vs. Vacuum Set... 59
Figure 34: L* and a*, b* Comparison of Control Set #4 vs. Rain Set ... 60
Figure 35: Adhesion Comparison of Control Set #1 vs. Heat Set ... 64
Figure 36: Adhesion Comparison of Control Set #2 vs. Freeze Set... 65
Figure 37: Adhesion Comparison of Control Set #3 vs. Vacuum Set... 66
Figure 38: Adhesion Comparison of Control Set #4 ... 67
Figure 39: Abrasion Comparison of Control Set #1 vs. Heat Set... 70
Figure 40: Abrasion Comparison of Control Set #2 vs. Freeze Set ... 71
Figure 41: Abrasion Comparison of Control Set #3 vs. Vacuum Set ... 72
Abstract
The effect of simulated environmental exposure conditions (high heat, freezing
temperature, rain, and vacuum pressure) on the performance of a silver-based conductive
flexo ink printed on a polyamide (nylon 6,6) substrate was examined. Conductivity,
density, color, adhesion, abrasion resistance and creasing were evaluated.
The tested environmental variables did not have an effect on the performance
quality of silver conductive flexographic ink when printed on a polyamide substrate for
the 85 – 100% solid ink density levels. Rain and temperature had the greatest impact on
print performance in the 70–80% tint range. Exposure to these elements affected
adhesion properties of the ink to the substrate, which lead to a negative effect on the
conductivity and abrasion performance.
This study indicated an antenna printed at common ink density levels using a
silver-based flexographic printing ink on a polymeric film is a possible solution for the
implementation of printed RFID components. This is a manufacturing option that can
bring the packaging industry from a "slap and stick" RFID labeling method to an actual
inline production method that can be applicable to both primary and secondary package
tagging needs. Lastly, the study utilizes common ink testing procedures that will be
useful in the development of standards for the production of printed RFID components in
Chapter 1
Introduction
Introduction
An area of growth opportunity for the print industry driven by demand from large
retail and manufacturing customers is printed electronics (IDTechEx, 2006). One of the
current main products of the printed electronics industry is printed radio frequency
identification (RFID) components. RFID technology has been in use for several years but
advances in printing materials and methods have finally permitted the possibility of a
fully printed RFID tag. This advancement has lead to a potential market share in the
billions of dollars. Harrop (2006) believes that by the year 2016, the RFID market will
grow to a value of $26.23 billion. Printers can capitalize on this market by creating a low
cost but highly effective fully printed RFID tag for use in product packaging. To achieve
this, significant research in the area of materials and end-use performance testing is
needed to develop a set of standards for the industry to follow.
The research conveyed in this study provides valuable information for materials
testing of a commonly used silver-based flexographic ink for use in typical product
packaging applications. The researcher exposed sample prints to varying simulated
environmental conditions a package might endure. A set of ink-testing procedures was
conducted to determine the effect, if any, on the performance of the ink by comparison to
Statement of the Problem
The effect of simulated environmental exposure conditions (vacuum, rain,
freezing temperature, and high heat) on the performance of a silver-based conductive
flexo ink printed on a polyamide (nylon) substrate was studied. Using a set of standard
ink testsconductivity, density and color, abrasion, creasing, and ink adhesion
significant results were explained with a comparative analysis to a controlled
environment.
Reason for Interest
The researcher became interested in a scientific approach to the study of printing
materials through course work done in the Materials and Processes class at the Rochester
Institute of Technology. In pursuance of a Master’s Degree in Print Media, the researcher
chose to study in a new, but growing market of materials science of the printing industry
called RFID technology.
Upon conducting a study of the literature regarding RFID technology and its
connection with the printing industry, the graduate student discovered an area where
research on materials used in the production of printed electronics, specifically RFID ink,
was needed for the industry to progress. It was found that a potential major user of RFID
ink is the packaging industry. This led the researcher to conduct her thesis in the area of
Chapter 2 Theoretical Basis
Ink Principles
Determination of Ink Testing
End uses of various packaging applications were considered in the selection of ink testing
procedures for this experiment. Storage and shipping environments were the main
consideration for the choice of simulated environments however, primary packaging
applications were also considered. Ink tests of conductivity, density, color, adhesion,
abrasion resistance and creasing were the chosen ink testing methods. This was based on
standard end use ink testing procedures set forth by the examination of a study published
by Jonathan Collins, of Precisia formerly a subdivision of Flint Ink in RFID Journal
(Collins, 2003).
The study by Collins indicates that one of the critical factors to the successful
printing of conductive antennas is thickness of the ink film or level of ink density. At the
time, there was not a set standard in place with regards to minimum required density level
to achieve an acceptable level of conductivity of an ink patch for the use of antenna
production (Collins, 2003). Therefore, it was determined that conducting the chosen tests
over several ink density levels would give valuable data with regards to this matter. This
is why a proofing plate with varying tint percentages from 100 – 60% density levels was
The key ink quality factors that Collins suggests, should be considered as standard
testing procedures for printed antenna production are color, optical density, rub
resistance, the effect of creasing and the adhesive qualities of the ink. He also goes on to
say that these qualities should be tested with mind to electrical resistivity, crease
resistance, temperature, and humidity effects on the performance of the inks (Collins,
2003). These were key factors that drove the setup of the thesis testing procedures and
selection of simulated environmental conditions.
Substrate Principles
Nylon Substrates
Nylon along with most linear polymers is a glass at low temperatures. As the temperature
is increased, the polymer changes from a glass to a rubber at a certain point. This is
known as the glass transition temperature or Tg. Nylon being a crystalline polymer,
remains thermoplastic or flexible above the Tg level until it reaches the crystalline
melting temperature (Tm), in which it begins to melt and transform into a liquid state. For
nylon 6,6 these two states occur at Tg= 113o F (45o C) and Tm= 512.6o F (267o C)
(Allcock, Lampe, Mark, 2003).
Nylon 6,6 film is a viscoelastic material. This means that it has the characteristics
of both solid and liquid states (Allcock, Lampe, Mark, 2003). Nylon 6,6 film posses the
characteristics of the glassy or brittle state at room temperature (70o F, 21.1o C), the state
the rubbery state at the temperature of 140o F (60o C), which is the temperature that the
heat condition was simulated.
Print Production Principles
Color Space
The form of color space system that was used in this study is the CIE LAB (L*a*b*)
system. CIE stands for Commission Internationale de l’Eclairage or International
Commission on Illumination. This system uses a measuring instrument (in the case of this
study, X-Rite DTP 22 Model handheld spectrophotometer) to sample a color and produce
a numerical representation of that color. The use of CIE LAB color system allows the
quantification of the color to be device independent through the incorporation of special
calculations that allows the mimicking of human vision (Sharma, 2004). In this
experiment a determination of 2o observer angle with a D50 Illuminant at a 45o angle was
measured to mimic the human eye’s vision at a close up distance. The CIELAB system
identifies a specific color by coordinating 3 different measurements (L*a*b*) to a
position in a 3D color space. The L* stands for lightness, a* represents the position of the
color on a red-green axis, and b* represents the position of the color on a yellow-blue
axis (Sharma, 2004).
Rheology
Rheology is the study of deformation and flow. Viscosity is the property of fluids that
displacement (deformation) occurs. In relation to printing inks, the concentration of
dissolved or dispersed pigments in the ink can sometimes cause more resistance to flow.
An increase in viscosity is known as shear thickening (Chaplin, 2006). Shear thickening
is a common occurrence with conductive inks because the metallic particles that created
conductivity in the ink are often larger than traditional pigments. Therefore, there are
often shear thickening problems with conductive inks and the press setting must be
adjusted accordingly.
Surface Tension
Surface tension, in terms of the printing industry is defined as the property of a substrate
that relates to how receptive the surface of the substrate is to accepting printing inks
(Flexography Principles and Practices, 1999.) In ink, the molecules at the surface are held
together more strongly to those directly associated with the surface. This occurrence
forms a surface "film" which has a force greater than the force acting upon the molecules
below the surface of the liquid. Surface tension is typically measured in dynes/cm, the
force in dynes required to break a film of length one centimeter. Water at 68o F (20° C)
has a surface tension of 72.8 dynes/cm. The surface tension of the ink and the substrate
were measured to ensure that the ink had sufficient wetting (ability of the ink to adhere to
the surface of the substrate when printing at a certain speed) capabilities to create an
acceptable print sample. In order for this to be true, the ink had to posses a lower surface
tension than that of the substrate. For proper adhesion to occur, the dyne level of the ink
substrate. Subsequently, the substrate would need to be corona treated to raise the surface
tension thus allowing the ink to transfer to the substrate (Podhajny, 2004). The surface
tension of the nylon 6,6 film used in this experiment measured 50 dynes/cm and the ink
used measured 40 dynes/cm. Therefore, it was determined that the ink did posses
sufficient wetting capabilities and the substrate did not need corona treatment.
Packaging Principles
Primary Packaging
Primary packaging is defined as packaging that immediately envelopes a product. It
provides most of the strength and the moisture, vapor or grease barrier needed to
safeguard a product’s purity, potency and integrity from the time it leaves the assembly
line until it’s used by the consumer. Examples of primary packaging include blister
packs, clamshells and trays. (assemblymag.com, n.d.)
Secondary Packaging
Secondary packaging is defined as material used primarily to give additional physical
protection to the outside of a proximity package. Examples of secondary packaging
include cartons, containers, pallets, cardboard boxes, padded bags, and polythene wrap
Role of Nylon in Packaging
Because nylon has many desirable properties such as good thermal, chemical and
oil/grease resistance and also good formation properties it is a material that works well as
solution for various primary and secondary packaging needs (British Plastics Federation,
2003). Many packaging uses of nylon film are for food and pharmaceutical “clean
packaging” needs (Nappi, 2004). It is also used in blister pack applications where it is
vacuum or thermo formed (Selke, Cutler, Hernandez, 2004).
Other Principles
Definition of Ohms/square
Ohms/square is a quantitative method to measure surface resistivity of a material. Gene
Chase of ETS, Inc. (n.d.) defines surface resistivity as the resistance between two
opposite sides of a square and is independent of the size of the square or its dimensional
units. This term is used to describe any dimension of a resistive material and is especially
useful in describing thin and thick film antennas because of their variance in size and
amount of conductive material used in the manufacture of these devices. The basic
principle of using ohms/square when referring to surface resistivity is to divide the
surface of the conductive plane (in the scope of this experiment, the surface of the
antenna) into any number of squares (in this case centimeters) and measure resistivity in
ohms over the distance of the predetermined square. This will indicate the level of
Determination of Acceptable Resistance Limitation
In the production of RFID antennas, there is not a set standard level of maximum
permitted resistance of a conductive material. This is because the conductivity level that
is needed to create a functional antenna is dependent upon the read range needed for the
tag and also the level of data capabilities of the tag. Antennas that require a longer read
range require a higher conductivity level and thus demand a lower acceptance limitation
level for surface resistivity. For the scope of this project it was determined that an
acceptable limit of resistivity is 25 ohms/square or less. This was derived from the
examination of US patent number 6,870,516 (Aisenbrey, 2006). In this patent, Aisenbrey
establishes that a desirable usable range of resistivity for the production of RFID
antennas using a conductive loaded resin-based material is between 5 and 25
ohms/square. Therefore, for the purpose of this project it was determined that the
acceptable limit of resistivity of the print samples was 25 ohms/square or less.
Notations
Table 1: List of units used in experiment
L* Represents lightness in color space.
a* Represents the position of color on the red-green axis.
b* Represents the position of color on the yellow-blue axis.
Dynes/cm The force required to break the surface of a film the length of one centimeter. Used to measure surface tension of a substrate or ink. Ohms/square The measure of the inherent resistance to electrical current flow
Chapter 3 Literature Review
Introduction
Radio Frequency Identification (RFID) technology is currently in the early stages of
adoption in various manufacturing and retail markets. One of the major factors that will
contribute to the item-level adoption of RFID tagging is the successful production of a
fully printed RFID tag. There are many issues surrounding the adoption of printing
methods as a viable solution for the industry. However, with continued research and
development, these issues are likely to be solved, and market potentials for printed RFID
tags and their incorporation into the packaging industry are great.
RFID Technology Basics
RFID systems transmit signals through electromagnetic or electrostatic coupling
in the radio frequency (RF) portion of the electromagnetic spectrum (Technovelgy, n.d.).
RFID is used to identify people or objects, and it functions somewhat similarly to
barcoding. The RFID can transmit a single piece of data, such as a serial number, or it
can send very detailed data about the object or person that can include where it came
from, where it is going, and how it is being transported. The data is transmitted from a
chip encoded with information through an attached antenna. The antenna sends the signal
to a reader device that is usually connected to a data collection/storage unit such as a
An RFID tag houses two of the main components, the antenna and chip.
Traditionally, these components have been produced using a labor-intensive process with
expensive materials. The antenna was made from a thin copper film created using a
stamping process. The chip was made from silicone and metal circuit boards that had to
be manufactured in a clean-room environment. However, in current RFID tag production,
most of the antennas are now printed using conductive inks, and although not yet in the
production stage, chip production is also moving toward a printed manufacturing process.
There are three types of tags in RFID technology: active, passive, and
semi-passive. An active tag broadcasts the signal using its own power source, a battery that is
contained within the tag. It has a read-range of about 100 yards, provided that there is
little interference with the tag’s transmission in its immediate surroundings. A passive tag
does not have a battery. Passive tags function through harnessing power supplied to the
tag from the electromagnetic waves sent from the reader. The tag then uses the antenna to
send the signal back to the reader. This is known as backscatter reflection. The signal that
is sent from a passive tag has a shorter read-range and uses amplitude modulation to send
binary data to the reader. A semi-passive tag has the same properties of the passive tag. It
is lightweight and small in size and has a limited memory, but it also has a battery that
extends the read-range further than that of the passive tag (Kleist, Chapman, Sakai, &
Jarvis, 2004). In addition to different types of tags, there are also different brands of tags,
each with different characteristics. The Table 1 describes the different brands of RFID
Table 2: Brand description of RFID tags (Kleist et al., 2004)
Brand Frequency Read Range Typical Application
Low Frequency (LF)
100-500 kHz Up to 20 inches (50.8 cm) Access control, animal identification, vehicle anti-theft system High Frequency (HF)
13.56 kHz Up to 3 feet (1 meter)
Access control, smart cards, item
level tagging, libraries, and electronic article surveillance Ultra-high Frequency (UF)
866 – 956 MHz FCC allows over 20 feet (6 meters) at 915 MHz. Range at
866 MHz is about 10% less than at 915
MHz.
Supply chain use, baggage handling and toll collection.
Wal-Mart acceptance.
Microwave 2.4 GHz 3 to 10 feet (1 to 3 meters)
Item tracking, toll collection
History of RFID
The beginning of RFID technology is often traced back to its use in the tracking of fighter
airplanes in World War II. In 1939, the British developed a system called Identify Friend
or Foe (IFF) in which they placed a transmitter on British planes that sent radar signals to
the base identifying the aircraft as friendly. Throughout the 1950s and 1960s, most of the
development of RFID technology came from research done by universities and scientists.
Several papers were published on the application of RF energy for use in remotely
In 1973, the first major event in RFID history occurred when Mario Cardullo
received the first patent in the United States for an active RFID tag with rewritable
memory. Later that same year, Charles Walton received a patent for a passive
transponder. The transponder was used to create a device that would allow a door to open
without the use of a key (RFID Journal, n.d.).
The U.S. government also began testing the use of RFID systems in the 1970s.
The Los Alamos Laboratory was commissioned by the Energy Department to develop an
RFID system for tracking nuclear materials. This system involved placing transponders
with information about the materials on the truck. The transponders were linked to the
driver’s identification, allowing access to the destination facilities. The Agriculture
Department also commissioned the Los Alamos Laboratory to create a way of tracking
cattle for medicinal purposes using RFID technology. They were able to ensure that the
cattle were not given the incorrect dosage of hormones and medicines. This method used
a glass capsule that was injected under the cow’s skin. The capsule contained a 125 kHz
transponder activated by the signal sent out by a reader. After creating many successful
RFID systems for Los Alamos, some of the scientists left the laboratory and began
commercializing similar systems in the mid-1980s for road and bridge toll payment
systems. These RFID systems are still in use for these same purposes around the world
(RFID Journal, n.d.).
Over time, 125kHz systems became inefficient for commercial applications. A
high-frequency (13.56 MHz) radio spectrum system was developed with greater
contactless smartcards for payment options and as anti-theft devices in some automobiles.
Also, this frequency is widely used in Europe for tracking reusable containers in
manufacturing operations. The ultra-high frequency RFID system was developed in the
early 1990s by IBM. This technology allowed for much longer read-ranges (up to 20 feet)
and much faster data exchange (RFID Journal, n.d.). In 1999, the Uniform Code Council
(UCC), EAN International, Proctor & Gamble, and Gillette funded the creation of the
Auto-ID Center at the Massachusetts Institute of Technology. Between 1999 and 2003,
Auto-ID Center developed protocol standards (Class 1 and Class 0) and the Electronic
Product Code (EPC) numbering system and licensed it to the UCC, which created an
organization called EPCglobal to commercialize EPC technology (RFID Journal, n.d.).
The years 2000–2006 have been a time of expansion for RFID systems amongst
retailers and manufacturers alike, most notably, Wal-Mart, the U.S. Department of
Defense, Albertsons, Target, Tesco, and others. EPCglobal has recently updated
standardization with the presentation of the Gen2 standard in December of 2004 (RFID
Journal, n.d.). The most recent main activity is focused around finding an economically
feasible method for creation and application of an entire RFID chip and antenna. The
industry has focused its research in developing various printing methods using
conductive inks to create a fully printed chip. Evidence of this direction has recently been
published in market forecast reports such as those created by IDTechEx and RFID
Overview of Conductive Inks
Conductive inks are primarily composed of metallic flakes, usually silver or copper, or
carbon flakes that are suspended in a retaining matrix. A retaining matrix is traditionally
composed of a ceramic material such as glass frit; however, since conductive ink
formulations have progressed, the retaining matrix now tends to be typically made of
polymers, which are known as Polymer Thick Films (PTFs). The retaining matrix is not
inherently conductive although it may be weakly conductive.
Once the ink is printed, the retaining matrix must be reduced to allow the ink to
be conductive. The ink becomes conductive when the retaining matrix is removed and the
metallic or carbon particles come in contact with each other. This process of reducing the
retaining matrix is known as curing. In conductive inks, this can be performed through a
number of methods (e.g., UV, heat-curing). Typically, PTF ink formulations have a lower
curing temperature of 150o C, which allows for more options for substrate selection and is
particularly useful with flexible polymer films (IDTechEx, 2004). Flexographic
conductive inks, since they are water-based, typically cure through evaporation of the
solvent into the air.
The difference between carbon-based and metallic-based conductive inks is that
carbon inks are generally two magnitudes less conductive than metallic inks and therefore
provide for a weaker signal and less read-range when used in RFID applications.
However, carbon-based inks are more economical to produce and are less
Carbon inks are typically used in EMI/RF shielding applications, such as their use
in speakers and monitor screens because of their weak conductivity (IDTechEx, 2004).
Currently, much research is being done to improve and develop better carbon and
organic-based inks because they are much more environmentally compatible and would
require less regulation and containment in production of printed electronic products.
Metallic inks are currently used in a wide array of printed electronic applications
such as membrane switches and circuits, RFID tag antennas, smart package and
tamper-evidence packaging, and printed battery testers (IDTechEx, 2004). Applications of
conductive metallic inks that are currently in the research and standards development
stage that will enter production in are printed RFID chips, flexible photovoltaic arrays,
and printed batteries, among others (Carli, 2006).
Conductive inks, both metallic and organic, are typically formulated to provide
properties to suit a specific substrate and printing process (IDTechEX, 2004). Currently,
conductive inks have been developed for use in all forms of print methods (inkjet, screen,
flexography, gravure, offset litho) with the exception of toner-based electrostatic printing.
Most producers (DuPont, XInk) provide several different lines of conductive inks for
these different printing applications. There are other ink companies that are working on
developing a single ink for use with multiple substrates and printing applications as well
(IDTechEx, 2004).
Printed RFID and Packaging
technology (Harrop, 2002). RFID technology has been successfully adopted for use on
the palette and crate level for the management of supply chain for various retailers and
manufacturers; the most predominate of these are Wal-mart and the U.S. Department of
Defense.
The use of an RFID tagging system is not currently feasible for item-level
packaging because of the cost of production and the complicated methods of
manufacturing the tags. Making RFID tagging feasible can be accomplished through
creating the components of RFID tags by directly printing the conductive inks on the
packaging substrate. Printers have printed an RFID tag directly onto a substrate, but this
has only been done in research applications. At this point, a system for use in
manufacturing and packaging production has not yet been reached. Product
manufacturers indicate that they will invest in printed RFID tag systems for their
packaging needs but not until costs can be reduced. The markets for item-level packaging
applications currently using some form of RFID tagging include libraries, media
merchandisers (DVDs, CDs, books, etc.), and pharmaceuticals (Casatelli, 2006). Other
industries will include RFID in their packaging solutions once other challenges have been
eliminated. The main examples of these challenges have been identified as a lack of
standardization and performance problems relating to the environment and interference
(Harrop, 2002).
Conclusion
As materials and methods improve for producing RFID tags directly onto
are production efficiency and costs, but customers identify performance and
standardization as hot topics to be addressed as well. Many industries currently using
RFID technology, as well as many of the potential markets, indicate that if these
Chapter 4 Research Statement
The effect of simulated environmental exposure conditions (vacuum, rain, freezing
temperature, and high heat) on the performance of a silver-based flexographic RFID ink
printed on a polyamide (nylon) substrate was studied. Using a set of standard ink
testsconductivity, density and color, abrasion, creasing, and ink adhesion significant
results were explained by a comparative analysis against a controlled environment.
Research Questions
Can conductive ink withstand conditions a printed RFID tag would be exposed to in the
primary or secondary level packaging supply chain?
Does exposure to environmental elements have an effect on the performance of a
silver-based conductive flexographic ink?
What is the optimum ink density level for printing RFID components with a silver-based
Chapter 5
Methodology
Materials
Substrate
The substrate that was used in this experiment is a polyamide (PA) commonly
known as nylon. Nylon is classified as a condensation copolymer. It is a linear
thermoplastic polyamide that contains the amide group as a recurring part of its chemical
chain. Nylon can be made through the condensation of amino acids that contain both
amine and acid functional groups in a single molecule, or they can result from the
condensation of diamines and dibasic acids. In this experiment, DuPont DARTEK® cast
nylon 6,6 film was used to create the print samples. This material is created through the
condensation polymerization of hexamethylene diamine and adipic acid. The formula for
this reaction is shown in Equation 1.
H2N-(CH2) 6-NHs + HOOC-( CH2) 4-COOH (1)
(Hexamethylene diamine) (Adipic acid)
H H O O
H [N (CH2) 6 N C (CH2) 4 C ] n OH
The numerical suffix specifies the numbers of carbons donated by the monomers. The
first number represents the number donated by the diamine and the second represents the
number donated by the diacid. In this case, both the diamine and the diacid donate six
carbon atoms (Selke, Culter, & Hernandez, 2004).
This film was chosen because it is a common film used in the production of bags,
tubing, sheets, and sleeves for packaging purposes. It is usually used in film form as a
single component or combined into multilayer structures with other polymers in a film.
Some of the properties of this film are that it retains its properties over a broad
temperature range as it remains flexible as low as -100°F (-73°C) and it will withstand
temperatures up to 450°F (232°C). Dependent on environmental conditions, it has good
barrier resistance to gases, odors, oils, and greases but is hydrophilic, so it can soak up
moisture. It has an O2 permeability of 3-5 cc/100in2/day. It has a thickness of 0.60 mil to
5.0 mil and will be cut down to a size of five inches by nine inches (DuPont, 2006).
To ensure material specifications prior to the samples’ print run for the testing
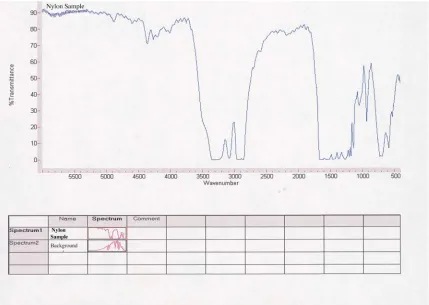
process, the researcher conducted a test using a Fourier Transform Infrared (FTIR)
spectrometer. Infrared (IR) spectroscopy is a chemical analytical technique that detects
the vibration characteristics of chemical functional groups in a sample (in this case,
DuPont DARTEK®). When infrared light interacts with the sample’s matter, the chemical
bonds present in the sample will contract and stretch. When this happens, the certain
chemical functional groups will absorb the IR radiation in a specific wavenumber. These
specific wavenumbers are identifiable in a graph of the spectrum that can be created with
are seen in the peaks and valleys of the spectrum graph (NUANCE, 2006). The FTIR
[image:35.612.111.540.144.449.2]spectrum of the substrate sample confirmed the material is nylon 6,6 (Figure 1).
Figure 1: FTIR spectrum of DuPont DARTEK® substrate sample
The final step in preparing the substrate for printing the samples for the
experiment was to determine the surface tension of the substrate and compare it with the
surface tension of the ink. This was done to ensure there would be effective adhesion of
the ink to the substrate and to determine that corona treatment of the film was not needed.
Surface tension is the work per unit area required to reshape a liquid. It is measured in
dynes/cm. For the ink to wet the surface of a substrate, the surface tension of the ink must
To ensure that the substrate that was going to be used in this experiment
possessed a surface tension higher than the ink, a dyne test was performed. This was done
using a set of dyne solutions that ranged from 30 to 60 dynes/cm. The test was performed
by dipping a sponge applicator wand into the solution and dragging it across the surface
of the substrate starting with the 30 dyne/cm solution. Determining the dyne level of the
substrate’s surface in this type of test is done once the solution has been spread onto the
surface of the substrate. The researcher conducting the test counts two seconds, and if the
solution has beaded up on the surface of the substrate, the dyne solution is a lower level
than that of the substrate’s surface. This is repeated with each dyne level until the level
where the solution does not bead up after two seconds is found (accudynetest.com, 2006).
This is the surface tension of the substrate. In the performance of this test on the DuPont
DARTEK® film, it was determined that the dyne level of the substrate was 50 dynes/cm.
This number was then compared to the surface tension of the ink and determined that
corona treatment of the substrate was not needed because the surface tension of the
substrate was higher than that of the ink.
Ink
The ink that was used for this experiment was silver RFID antenna flexographic
ink. This water-based silver conductive ink is formulated for use in flexographic printing
methods and cures through evaporation of solvents over a period of time. The exact ink
formulation is not known, but it is primarily composed of a suspension of finely milled
silver (Ag) particles in a resin, solvent, and additives solution. Some of the known
(Williams, 2006). A similar ink could be a water-based metallic ink that consists of
pigments derived from micronized flakes of the metal, in this case silver, suspended in an
ink vehicle. It is important to note that a property of this type of ink is reactivity. Because
the metallic particles are reactive, the vehicles they are suspended in must be inert to
prevent a potentially hazardous reaction (Foundation of Flexographic Technical
Association, 1999).
Some other important properties of conductive metallic inks are that they attempt
to provide a printed surface that can mimic a true metal surface. To do so, the pigments
are specially treated and size graded to help determine their orientation in the print ink
film. This ensures that the metal flakes are flat and stack on top of each other to promote
conductivity; however, this tends to cause problems with cohesion. Another property of
metallic inks is that they have a high specific gravity and are prone to settling. This is
especially possible in a low viscosity water-based ink used in flexographic printing
(Foundation of Flexographic Technical Association, 1999).
To ensure that this ink would adhere to the surface of the substrate used in this
experiment, the surface tension of the ink was measured using the Fisher Scientific
Surface Tensiomat 21. The surface tension of the ink was measured at 40 dynes/cm.
Therefore, it was determined that the ink did posses sufficient wetting capabilities.
Printing
Print samples were made in the Print Sciences Laboratory (7-A610) at the
Instruments). A patterned anilox plate seen in Figure 2 (b) (Double 8 Wedge Plate –
Model EP 5102/2 Rev.K) was used to create the print sample. The anilox plate used had
the properties of 150 lines/inch (60 lines/cm) with varying tint patches that have
100-95-90-85-80-75-70-60% density values (RK Print Coat Instruments, n.d.).
Figure 2 (a), (b): RK K Printing Proofer, EP 5102/2 Rev.K anilox plate
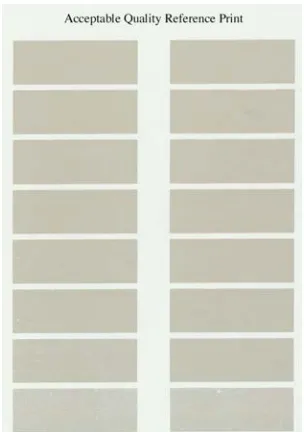
To determine the optimal printing conditions required to replicate printing on
press, the researcher made several prints adjusting the impression, stereo, and doctor
blade pressure until an even ink-film thickness—the amount of ink transferred to the
printing substrate, usually measured in microns—and acceptable visual appearance was
achieved. This was determined by creating a kiss impression where the least amount of
pressure needed to create a consistent image was reached. The researcher evaluated the
[image:38.612.153.496.227.447.2]deposit. Adjusting the rollers provided more or less ink flow onto the substrate, which
caused the ink film thickness as well as the appearance of the print to change. The image
that was created from this process was used as a visual reference for comparison when
[image:39.612.266.418.226.442.2]print samples for use in the experiment were created (Figure 3).
Figure 3: Acceptable quality reference print
The optimal settings used in creating this print were recorded and duplicated to
create the print samples for the experiment. These settings include 2.65 for the right and
2.70 for the left of the impression roller, 2.95 for the right and 3.45 for the left of the
stereo roller, and 5.70 for the right and 6.36 for the left of the doctor blade. The optimal
press speed was determined to be a setting of 4. This process was considered to be the
Print Samples
The print sample was printed five times using the flexographic proofer on the
nylon substrate. Five sets of these prints were created for use in the five different inks
tests and were exposed to the four environmental conditions, and five prints were created
for use as a control set. A set of print samples consists of five prints for the control
condition and five prints that will be exposed to an environmental condition. There are 10
prints per set, and there were a total of five sets of print samples created for the four
different environmental conditions for a total of 40 prints. Table 2 lists the labels of the
prints.
Table 3: Print sample labels used
Heat Set Control Set #1 Freeze Set Control Set #2 Vacuum Set Control Set #3 Rain Set Control Set #4 Conductivity Test A Print 1 Print 1 Print 1 Print 1 Print 1 Print 1 Print 1 Print 1 Density/Color Test B Print 2 Print 2 Print 2 Print 2 Print 2 Print 2 Print 2 Print 2 Adhesion Test C Print 3 Print 3 Print 3 Print 3 Print 3 Print 3 Print 3 Print 3 Abrasion Test D Print 4 Print 4 Print 4 Print 4 Print 4 Print 4 Print 4 Print 4 Creasing Test E Print 5 Print 5 Print 5 Print 5 Print 5 Print 5 Print 5 Print 5
All prints were allowed a drying period of 24 hours and reacclimation period of
Environmental Exposure
The simulation of typical environmental packaging conditions was performed by creating
a set of four 24-hour periods of exposure to a certain condition and one controlled
condition. All of the environment simulations, except for the freezing condition, were
created in the Print Sciences Laboratory in room A610 of Building 7 at the Rochester
Institute of Technology in Rochester, New York.
Control Set
Control sets of prints (five samples) were created for comparison to each of the
four environmental condition samples. The samples were printed according to the optimal
print settings that were specified in the calibration of the proofer. Each control set was
printed concurrently with the environmental set for which it was compared to and was
allowed the same curing period (24 hours) as the set of prints for environmental
exposure. Also, since each of the environmental exposure samples required an additional
1-hour acclimation period after removal from the environmental condition before
conducting testing procedures, this was also allowed for the control samples. The same
ink testing procedures performed on the environmental exposure sets were performed on
the control set. The notation that was used to identify the control set of prints in the data
recording process was CS#1, CS#2, CS#3, and CS#4, each corresponding to one of the
Environmental Conditions
Heat Condition (HC). The purpose of creating a heat exposure condition was to subject
the print samples to the environment that a package would endure in its lifecycle.
Whether through environments it would be exposed to in shipping as a secondary
packaging application or environments it would be exposed to as a primary packaging
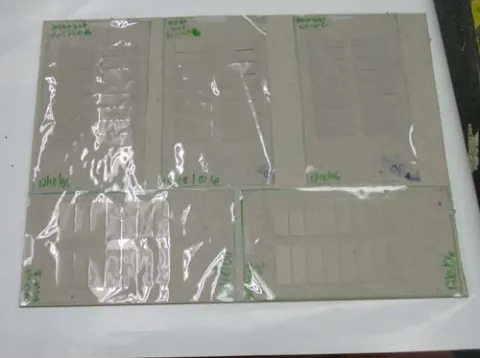
application. The heat exposure was accomplished by mounting the set of five prints to a
piece of chip board (Figure 4) and placing them in the Fisher Scientific Isotemp Oven
[image:42.612.204.444.314.493.2](Figure 5) at a temperature of 140o F (60o C) for a period of 24 hours.
Figure 5: Heat Set prints placed in Fisher Scientific Isotemp Oven
The prints were then removed and a one-hour acclimation time occurred in which the
print samples cooled, after which the ink testing procedures were conducted.
Figure 6: Heat Set samples after removal from environmental condition
Freeze Condition (FC). The purpose of creating a freezing exposure condition was to
[image:43.612.204.445.388.567.2]packaging application or environments it would be exposed to as a primary packaging
application. The environmental condition was simulated by placing the prints samples in
a Ziploc® brand freezer bag and placing them in the researcher’s spare GE Spacemaker®
4.3.0 Cu. Ft. Compact Refrigerator/Freezer in the freezer compartment at a temperature
of 15o F (-9.4o C) which met the conditions for freezing temperatures (32o F or 0o C).
After a period of 24 hours, the print samples were removed from the freezer and a 1-hour
acclimation period began. After this period the print samples were subjected to ink testing
procedures.
Vacuum Condition (VC). The purpose of creating a vacuum exposure condition was to
subject the print samples to the environment that a package would endure in its lifecycle
whether through environments it would be exposed to in shipping as a secondary
packaging application or environments it would be exposed to as a primary packaging
application. This condition was created by sealing the five print samples in a Space
Savers (Model 1AT91208 by Space Bag®) 13.75” x 19.5” storage bag for 24 hours. The
vacuum seal was created by connecting a standard household upright vacuum to the valve
(Figure 7). When the upright vacuum was turned on, the air within the bag was removed
Figure 7: Vacuum environment created with the use of a household vacuum
After a period of 24 hours the print samples were removed from the vacuum-sealed bag
and a one-hour acclimation period began. After this period the print samples were
subjected to ink testing procedures.
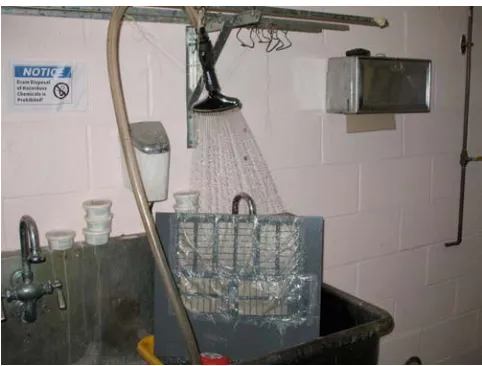
Rain Condition (RC). The purpose of creating a rain exposure condition was to subject
the print samples to the environment that a package would endure in its lifecycle whether
through environments it would be exposed to in shipping as a secondary packaging
application or environments it would be exposed to as a primary packaging application.
This condition was achieved by attaching the samples to a plastic backing board and
standing this backing board up in a water basin. Tap water with a temperature of 45o F
(7.2o C) was circulated through a sprinkler head attached to a half-inch plastic hose
above the backing board and directionally aimed so that the spray from the sprinkler head
completely covered the prints (Figure 8).
Figure 8: Rain Condition environment
This was performed for a period of 24-four hours at which point the samples were
removed and a one-hour acclimation period in which the sample were allowed to air-dry
[image:46.612.203.444.170.353.2]occurred. After which the print samples were subjected to the ink testing procedures.
Figure 10: Rain Set print after one hour acclimation period
Ink Testing Procedures
Several ink testing procedures have been established within the print industry to test the
properties of inks under many common end-use conditions. These tests are used to
evaluate ink requirements and performance under a given set of conditions (Foundation
of Flexographic Technical Association, 1999). The purpose of this experiment was to test
the performance of a silver conductive water-based ink under certain common
environmental conditions that flexible substrates, such as polyamides, are subjected to.
Therefore, five tests were selected: conductivity, density and color, adhesion, abrasion,
and creasing.
Conductivity
inverse measurement of conductivity—resistance was measured in ohms/square and was
performed by measuring the resistance over a one-centimeter distance. Five different
measurements were taken on various locations of each of the patches and were averaged.
These averages were recorded for both the control and environmental conditions and
compared.
Density and Color
Density and color was measured using an X-Rite DTP 22 Model handheld
spectrophotometer. A spectrophotometer was the chosen measuring device because the
researcher wanted to collect both density information as well as the color data of the ink.
A spectrophotometer functions by measuring the color spectrum of a sample by reporting
the reflectance or transmittance of a sample. The spectral data can then be used to
determine the LAB values which are needed to evaluate the color of the ink (Sharma,
2004).
An average of five density and LAB values were taken on each sample exposed to
an environmental condition from various points on each tint patch and recorded. Density
with respect to transmittance, is the ratio of incidental light measured to the amount of
light transmitted. With regards to reflection, it is the ratio of incidental light measured to
the amount of light reflected (Sharma, 2004). LAB values are a set of measurements that
are taken from a sample print that are used in determining color. L* is a measure of
lightness, a* is a measure of the position of the color on the red-green axis, and b* is the
three values, a person is able to map the color in a three-dimensional space and give it a
quantitative value (Sharma, 2004).
These averages were then compared to those of the control sample, and the Delta E value
for both the control and environmental condition were calculated and compared. The
purpose of calculating the Delta E value was to compare the change in color from the
control sample to that of the environmentally exposed sample to determine if the
exposure had an effect on the color of the ink. To calculate the Delta E value, the LAB
measurements of both the control sample and the chosen environmental sample were
obtained, and the number between the two samples was calculated. This resulted in a
value of Delta E. The greater the Delta E value, the greater difference in color there is for
the sample (Sharma, 2004).
Adhesion
The adhesion of the ink for both the control sample and the environmental condition
sample were tested. The print samples were secured to the surface of a table. A piece of
1-inch by 2-inch pressure-sensitive tape (3M-610) was applied to the print sample (Figure
11). A rubber roller was used to ensure that there were no air bubbles between the tape
and the substrate (Figure 12). The tape was then pulled from the print sample at a 150o
angle, and the resistance of the sample was measured after each removal of the tape
Figure 11: Print sample attached to table surface while tape is placed on to printed patch
Figure 13: Removal of tape from print sample
The number of adhesive pulls it took to cause conductivity failure was recorded. The
average of these values was compared with the average of the control set to determine
whether exposure to a certain environmental condition had an effect on the adhesion
performance of the ink.
Abrasion
Abrasion testing was performed in the fashion of the Sutherland rub test that has
been established as a standard for testing ink adhesion of flexographic inks. The purpose
of this test was to make sure that an antenna printed on a package could withstand
handling between the press and point of sale, which includes typical shipping
environments (Foundation of Flexographic Technical Association, 1999). This was
at the top of the inclined plane 10 times (Figure 14) after which a measurement of
resistance was taken of each tint patch (Figure 15).
Figure 14: Nylon covered weight being released down inclined plane
This was repeated until the tint patch exhibited an infinite measurement of resistance.
This indicated that the patch was no longer conductive. The number of passes it took to
achieve this status for each patch of the environmental condition sample was recorded
and compared to the number recorded for the control condition.
Creasing
Crease testing was conducted by making a crease on each of the tint patches. Each crease
was made by folding the print sample once (Figure 16) and placing a weight on it for a
period of 10 minutes (Figure 17). The resistance was measured and recorded. Each tint
patch of the print sample was then unfolded/refolded with the weight replaced on the
sample for 10 minutes until the measurement of the patch indicated conductivity failure.
Figure 17: Placement of weights on print sample
The number of times the samples were creased was recorded for both the control and the
environmental condition sample. The average of these values was compared to determine
if the environmental exposure had an effect on the integrity of the ink.
Data Analysis
A simple statistics model was used in evaluation of the data set. Averages of results for
each print sample of the individual environmental conditions were calculated for each of
the tests performed. These calculations were then compared to that of the control
environment to analyze the results.
Limitations
One of the limitations of this experiment was that a limited number of samples were
tested. For the testing used in this experiment to be statistically significant, a minimum of
environmental conditions per the five ink tests is the minimum desired sample size for
statistical significance (60 prints * 4 environmental conditions * 5 ink tests = 1,200 total
prints). Testing of this scale was not possible because of the limitations of the scope of
this project. Another limitation was that the environmental conditions that were set up for
this experiment are simulations of a real-world environment. Results would be more
accurate if the experiment was tested over a period of time in the actual environments
Chapter 6 Results
Control Sets
Treatment of Control Sets
For each ink-testing procedure performed, a comparison control set was printed for each
of the four environmental conditions. In addition to comparison against the set of prints
exposed to the environmental conditions, the consecutive control sets (#1–4) were
compared to each other. The reason for comparing control sets is because of inconsistent
measurements particularly for the 80–70% tint patches. The results (Figures 18 – 22) of
this comparison of consecutive controls sets for each ink test are indicated in.
Discussion of Treatment of Control Sets
Conductivity. In Figure 18, the resistance measured in ohms/cm was compared between
control sets #1–4 for each of the tint patches. In comparison of these measurements, it
can be seen that each successive control set provided more resistance than the previous.
Density. In Figure 19, the density measurement was compared between control sets #1–4
samples for each of the tint patches. This graph indicates that the control set density
measurements differed by 0.021 for the 75% and 70% tint patch and 0.038 for the 60%
Figure 21: Adhesion Comparison of Control Sets #1-4
[image:59.612.124.526.387.667.2]Color. In Figure 20, the L* values indicate that there was a slight difference in the
lightness of the control sets. A difference in the a*, b* values of less than 0.5 for each tint
patch, indicated that there was not a significant shift in the color space of the control sets.
Adhesion. Figure 21 shows the adhesion of control sets #1–4. The number of passes is
indicated on the x-axis, the tint percentage value is indicated on the y-axis and the
measurement of resistance in ohms/cm is indicated on the z-axis. The apex of the surface
graph for each patch indicates the highest resistance measurement achieved. The decline
of the graph that follows the peak is the number of passes where a failure of conductivity
occurred resulting in a null measurement. The red box indicates the level of resistance
permitted for use in production of an RFID antenna (25 ohms/square). Any measurement
below this level passes for acceptable conductivity of the ink. Each successive control set
performed more poorly than the preceding. Control Set #1 conductivity dropped off after
two passes on the 70% tint patch; Control Set #2 dropped off after three passes on the
80% tint patch; Control Set #3 dropped off after three passes on the 80% tint patch also
but recorded much higher resistance levels than that of Control Set #2. Control Set #4
dropped off after two passes on the 85% tint patch. This indicates that there was a
negative effect on the successive print performances of each control set.
Abrasion. Figure 22 shows the adhesion of control sets #1–4. The number of passes is
indicated on the x-axis, the tint percentage value is indicated on the y-axis and the
measurement of resistance in ohms/cm is indicated on the z-axis. The apex of the surface
graph for each patch indicates the highest resistance measurement achieved. The decline
occurred resulting in a null measurement. The red box indicates the acceptable level of
resistance permitted for use in production of an RFID antenna (25 ohms/square). Any
measurement below this level passes for acceptable conductivity of the ink. This figure
indicates there was not a significant difference in abrasion properties of the control sets.
Each one exhibited a drop off in conductivity at the 75% tint patch varying from 20 to
100 passes required to produce an infinite resistance measurement.
Test A – Conductivity
The conductivity test was performed using a digital multimeter on which measurements
of resistance were recorded in ohms/square, five times at five different points on the each
of the tint patches (100-95-90-85-80-75-70-60). The means of the measurements (Figures
23-26) were then calculated and graphed.
Discussion of Conductivity
Heat Condition. In Figure 23, the resistance measured in ohms/cm was compared
between the Control Set #1 and Heat Set samples for each of the tint patches. This
comparison provides several indications. For the Control Set, it can be seen that the
conductivity level dropped off after the 70% tint patch. The Heat Set conductivity
dropped off at the 80% tint patch. The measurements for the 100% patch through the
85% patch appeared to be uneffected by exposure the environmental condition. The
conductivity level of the samples exposed to the Heat Condition appeared to be
uneffected for the 100–85% tint percentage; however the conductivity level was
60% patch measured a greater resistance to conductivity than permitted by the acceptable
level for antenna production previously established.
Freeze Condition. In Figure 24, the resistance measured in ohms/cm was compared
between the Control Set #2 and Freeze Set samples for each of the tint patches. The
Control Set conductivity level dropped off after the level of the 70% tint, which is
consistent with the measurement from Control Set #1. The Freeze Set sample
conductivity also dropped off after the 70% tint level, however the resistance
measurement for the Freeze Set at the 70% tint level was 36.22 ohms/cm. The Control
Set measurement is 229.70 ohms/cm at this level. This indicates that exposure to the
freeze condition appeared to slightly improve the conductivity for the 80–70% tint.
Consistent with the results of Control Set #1, the 60% tint patch was not conductive.
Vacuum Condition. In Figure 25, the resistance measured in ohms/cm was compared
between the Control Set #3 and Vacuum Set samples for each of the tint patches. The
conductivity dropped off after the 75% tint patch for both the Control and Vacuum sets.
For the 100–90% tint patches, the environmental condition did not appear to have an
effect on the conductivity level. It cannot be determined if the condition had an effect on
conductivity for the 85–75% tint patches because for the 85% and 80% patches the
Vacuum Set produced a higher resistance measurement. However, for the 75% patch, it
Figure 23: Resistance Comparison of Control Set #1 vs. Heat Set
[image:63.612.140.516.412.653.2]Figure 25: Resistance Comparison of Control Set #3 vs. Vacuum Set
[image:64.612.138.517.412.652.2]Rain Condition. In Figure 26, the resistance measured in ohms/cm was compared
between the Control Set #4 and Rain Set samples for each of the tint patches. Both the
Control Set and the Rain Set samples dropped off in conductivity level after the 80% tint
patches. The 100–80% tint patches all produced a resistance measurement that was
significantly higher than that of the Control Set indicating that exposure to the Rain
Condition had an effect on the conductivity level of the print samples.
Test B – Density and Color
Density Test
The density test was performed using a handheld spectrodensitometer in which
measurements were taken five times at five different points on the each of the tint patches
(100-95-90-85-80-75-70-60). The means of the measurements were then calculated and
graphed (Figures 27–30).
Discussion of Density
Heat Condition. In Figure 27, the density measurement was compared between the
Control Set #1 and Heat Set samples for each of the tint patches. For every tint patch
100–60%, the density measurements of the Heat Set are higher than those of the Control
Set. This indicates that exposure to the heat condition does have an effect on the density
of the print samples.
Freeze Condition. In Figure 28, the density measurement was compared between the