Int. J. Electrochem. Sci., 10 (2015) 2370 - 2376
International Journal of
ELECTROCHEMICAL
SCIENCE
www.electrochemsci.orgShort Communication
Preparation of SnO
2Nanoparticle and Performance as
Lithium-ion Battery Anode
Lili Feng1,*, Zhewen Xuan1, Siping Ji1,Weiru Min1, Hongbo Zhao1, Hui Gao2,* 1
Engineering Research Center of Biopolymer Functional Materials of Yunnan, Yunnan Minzu University, Kunming 650500, China
2
School of Pharmacy,Yunnan University of Traditional Chinese Medicine, Kunming 650550, China *
E-mail: [email protected](Lili Feng) or [email protected] (Hui Gao)
Received: 17 November 2014 / Accepted: 8 December 2014 / Published: 19 January 2015
Herein we report that SnO2 nanoparticle is successfully prepared by the hydrolysis of SnCl2 as sodium dodecyl benzene sulfonate (SDBS) is used as the surfactant. The structures and electrochemical performances are characterized by scanning electron microscope (SEM), X-ray diffraction (XRD), galvanostatic cell cycling and electrochemical impedance spectroscopy (EIS). The morphology of the SnO2 nanoparticle is spherical. The SnO2 nanoparticle is cassiterite type which belongs to tetragonal crystal system with rutile structure. The results of galvanostatic cell cycling performances show that the SnO2 nanoparticle has high discharge specific capacity, but with relative low cycling stability. The sample calcinated for 9h has higher discharge specific capacity and lower electrochemical impedance.
Keywords: Nanoparticles; SnO2 ; Hydrolysis method; Lithium-ion batteries; Anode materials
1. INTRODUCTION
As early as 2000, Tarascon’s research group reported that electrodes made of nanoparticles of transition-metal oxides (MO, where M is Co, Ni, Sn or Fe) demonstrated electrochemical capacities of more than 700 mAh g-1 (this value was approximately twice of the theoretical capacity of the carbon material[1]) and high recharging rates. Therefore, many efforts have so far been made to preparing micro or nano metal oxides with various morphologies as well as various structures, especially for the design, synthesis and applications of SnO2 nanostructures[2, 3].SnO2 possess high theoretically gravimetric lithium storage capacity of about 710 mAh g-1 and low potential of lithium ion intercalation, so it is regarded as one of the most promising candidates for anode materials[4-11]. For an example, Xie group[12] prepared SnO2 hollow sphere and rod materials by the oxidation-crystallization method of amorphous colloids. The measured capacities of SnO2 hollow sphere and rod electrodes were 698 and 470 mAh g-1, respectively. And they were higher than that of a solid SnO2 nanoparticles electrode (650 mAhg-1). Han et al.[13] had synthesized hollow SnO2 microspheres by heat treatment of tin chloride/RF gel composite. When the SnO2 microspheres were employed as a lithium-ion battery anode, they exhibited extraordinarily high discharge capacities and higher coulombic efficiency. Wang et al.[14] had prepared SnO2 nanosheets which had a high discharge capacity of 559 mAh g-1 after 20 cycles with good retention of 57%.
The above examples suggested that if single SnO2 was used as an active material, it should be in a nanometer-sized frame to shorten the pathway lengths of the lithium ion or should possess interior hollow spaces to accommodate large volume change. In the present work, to improve the electrochemical performances of SnO2 anode materials, SnO2 nanoparticle was prepared. Here SnO2 nanoparticle was prepared by the hydrolysis of SnCl2, and then by calcination in a muffle furnace at 700 °C for 7~9 h in air atmosphere.
2. EXPERIMENTAL SECTION
2.1 Synthesis and Characterization of SnO2 Nanoparticle
All reagents purchased from the Shanghai Chemical Company were of analytical grade, and used without further purification. To prepare SnO2 nanoparticle, 2.2565g SnSO4 and 3.4835g sodium dodecyl benzenesulfonate (SDBS) were dissolved in 100 mL of distilled water and stirred for 9 h at room temperature. After the reaction was completed, the white precipitation were washed and harvested with centrifugation-redispersion cycles for several times with distilled water, and dried at 80 °C for 12 h. Then the white precipitation was grinded for 20 minutes, and the SnO2 nanoparticle were obtained by calcined in a muffle furnace at 700 °C for 7 h or 9 h in air atmosphere.
2.2 Electrochemical Studies of SnO2 Nanoparticle
Electrochemical performances of the samples were measured using CR2025 coin-type cells assembled in a dry argon filled glove box. To fabricate the working electrode, a slurry consisting of 60 wt.% active materials, 10 wt.% acetylene black, and 30 wt.% poly-vinylidene fluoride (PVDF) dissolved in N-methyl pyrrolidinone was casted on a copper foil, drying at 80 °C under vacuum for 5 h. Lithium sheets were served as counter and reference electrodes, while a Celgard 2320 membrane was employed as a separator. The electrolyte was a solution of 1 M LiPF6 in ethylene carbonate (EC)-1,2-dimethyl carbonate (DMC) (1:1 in volume). Galvanostatical charge-discharge experiments were performed by Land electric test system CT2001A (Wuhan Jinnuo Electronics Co., Ltd.) at a current density of 0.2 C between 0.01 and 3.00 V (versus Li/Li+). Electrochemical impedance spectroscopy (EIS) measurements were performed on an electrochemical workstation (CHI604D, Chenhua, Shanghai), and the frequency ranged from 0.1 Hz to 100 KHz with an applied AC signal amplitude of 5 mV.
3. RESULTS AND DISCUSSION
3.1 Structure and Morphology
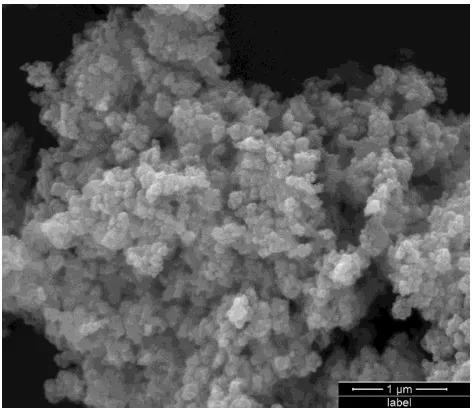
The SEM image of the as-prepared SnO2 nanoparticle is displayed in Fig. 1. As shown the as-prepared SnO2 nanoparticle is spheric morphology with about 45 nm in diameter. Fig. 1 suggests that the SnO2 nanoparticles tend to agglomerate into larger particles.
Figure 1. SEM image of the as-prepared SnO2 nanoparticle. The scale bar is 1 μm.
[image:3.596.180.416.475.679.2]
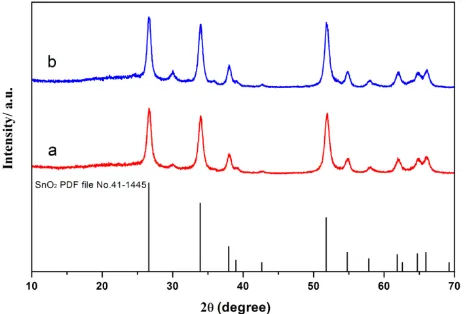
55.0° match well with the diffraction peaks of (110), (101), (200), (211), and (220) crystal planes of SnO2 standard data (JCPDS card PDF file No. 41–1445). As shown in Fig. 2, the SnO2 samples are both cassiterite type which belongs to tetragonal crystal system with rutile structure.
Figure 2. The XRD patterns of the as-prepared SnO2 nanoparticle. (a) sample calcinated for 7h , (b) sample calcinated for 9h.
3.2 Electrochemical Performance
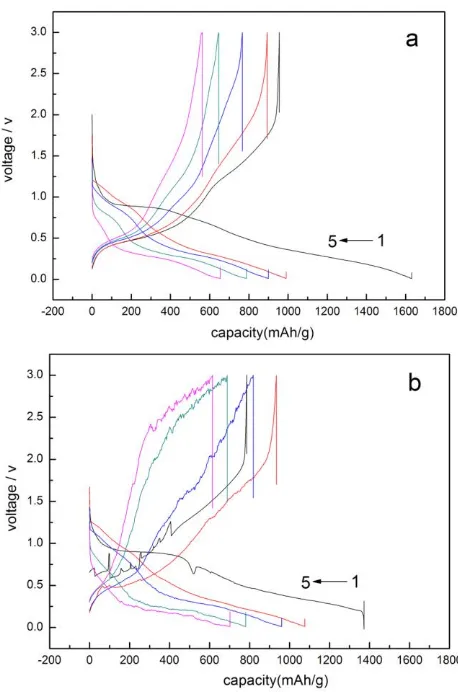
Fig. 3 presents typical charge–discharge voltage curves of the anodes constructed from SnO2 nanoparticle at 0.2 C rate in the voltage range of 0.01 ~ 3.00 V (vs. Li/Li+). For clarity only selected cycles are shown. The theoretical discharge specific capacity of SnO2 nanoparticle was 782 mAh g-1, while as shown in Fig. 3, the SnO2 nanoparticle had high initial discharge specific capacity as approximate 1400~1600 mAh g-1. The initial discharge specific capacities of the as-prepared SnO2 nanoparticle was much higher than the theoretical data. The extra capacity might result from the formation of SEI layer (solid electrolyte interface layer) which was known as a gel-like layer, containing ethylene oxide based oligomers, LiF, Li2CO3, and lithium alkyl carbonate (ROCO2Li), during the first discharging process[15, 16]. There was an discharge specific capacity attenuation during the next cycling. The discharge specific capacity of SnO2 nanoparticle in the second cycle was about 1000 mAh g-1. After five cycling the discharge specific capacity fell to about 650~700 mAh g-1. In fact, after 15th cycling the discharge specific capacity continue fell down (not shown in Fig. 3). The discharge specific capacity attenuation might cause by the electrode pulverization and loss of interparticle contact or the particle with copper foil collector due to large volume expansion/contraction during repeated charging-discharging processes and severe particle aggregation. As reported for other metal oxide anode, Li storage in SnO2 is primarily based on multiple electrochemical reactions of SnO2 with Li. In discharge process, SnO2 transformed to Sn, and Li+ inserted into the anode to format Li2O. The reaction was as follow:
SnO2 + 4Li 2Li2O + Sn Reaction (1)
[image:4.596.182.415.142.299.2]
2Li2O + Sn SnO2 + 4Li Reaction (2)
While during the first charge process, there is an extra reaction as follow: Sn + xLi LixSn (0≤x≤4.4) Reaction (3)
According to the results here, SnO2 nanoparticle can be an good candidate for anode application of lithium-ion battery, but the discharge specific capacity attenuation should be improved. To improve the stability of the discharge specific capacity, shell coating such as carbon coating, polypyrrole coating, polyaniline coating, is an effective strategy to improve the cycling stability. So in the future study, SnO2 shell coating should be done to improve the cycling stability.
Figure 3. Charge-discharge curves for selected cycles for the as-prepared SnO2 nanoparticle in the potential range of 0.01~3.00 V at 0.2 C. (a) sample calcinated for 7h , (b) sample calcinated for 9h.
[image:5.596.182.411.234.580.2]
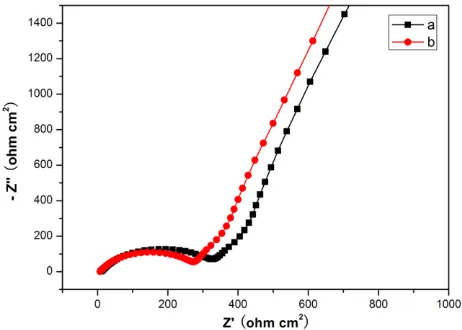
transfer resistance (Rct). The inclined line at low frequency region represents the warburg impedance (Ws), which is associated with lithium-ion diffusion in the active material. In general, the ohmic electrolyte resistances of the as-prepared SnO2 nanoparticles are similar. The Rsf and Rct value of the SnO2 nanoparticle calcinated for 9h is lower. The smaller the value of Rsf and Rct is, the more favorable for the intercalation and deintercalation of lithium ion. So this indicates that the SnO2 nanoparticle calcinated for 9h is a little better.
Figure 4. Nyquist plot obtained from Li/ SnO2 cells after the 5th charge-discharge cycle at open circuit voltage. The frequency ranged from 0.1 Hz to 100 KHz with an applied AC signal amplitude of 5 mV. (a) sample calcinated for 7h , (b) sample calcinated for 9h.
4. CONCLUSION
In summary, SnO2 nanoparticle is successfully prepared by the hydrolysis of SnCl2. The SnO2 nanoparticle is cassiterite type which belongs to tetragonal crystal system with rutile structure. The results of galvanostatic cell cycling performances show that the SnO2 nanoparticle has high discharge specific capacity, but with relative low cycling stability. The sample calcinated for 9h has higher discharge specific capacity and lower electrochemical impedance.
ACKNOWLEDGEMENTS
[image:6.596.182.413.202.367.2]
References
1. P. Poizot, S. Laruelle, S. Grugeon, L. Dupont, and J.M. Tarascon, Nature, 407 (2000) 496. 2. H.B. Wu, J.S. Chen, H.H. Hng, and X.W.D. Lou, Nanoscale, 4 (2012) 2526.
3. H. Wang, and A.L. Rogach, Chem. Mater., 26 (2014) 123.
4. R. Demir-Cakan, Y.S. Hu, M. Antonietti, J. Maier, and M.M. Titirici, Chem. Mater., 20 (2008) 1227.
5. M.S. Park, G.X. Wang, Y.M. Kang, D. Wexler, S.X. Dou, and H.K. Liu, Angew. Chem. Int. Ed., 46 (2007) 750.
6. J. Wang, N. Du, H. Zhang, J. Yu, and D. Yang, J. Phys. Chem. C, 115 (2011) 11302. 7. M. Wang, Y. Gao, L. Dai, C. Cao, and X. Guo, J. Solid State Chem., 189 (2012) 49.
8. C. Wang, G. Du, K. Ståh, H. Huang, Y. Zhong, and J.Z. Jiang, J. Phys. Chem. C, 116 (2012) 4000. 9. Y. Zhao, J. Li, N. Wang, C. Wu, G. Dong, and L. Guan, J. Phys. Chem. C, 116 (2012) 18612. 10.D. Wang, X. Li, J. Wang, J. Yang, D. Geng, R. Li, M. Cai, T.-K. Sham, and X. Sun, J. Phys.
Chem. C, 116 (2012) 22149.
11.S.K. Park, S.H. Yu, N. Pinna, S. Woo, B. Jang, Y.H. Chung, Y.H. Cho, Y.E. Sung, and Y. Piao, J. Mater. Chem., 22 (2012) 2520.
12.Q. Zhao, Y. Xie, T. Dong, and Z. Zhang, J. Phys. Chem. C, 111 (2007) 11598.
13.S. Han, B. Jang, T. Kim, S.M. Oh, and T. Hyeon, Adv. Funct. Mater., 15 (2005) 1845.
14.C. Wang, Y. Zhou, M. Ge, X. Xu, Z. Zhang, and J.Z. Jiang, J. Am. Chem. Soc., 132 (2010) 46. 15.J.Y. Xiang, J.P. Tu, L. Zhang, Y. Zhou, X.L. Wang, and S.J. Shi, J. Power Sources, 195 (2010)
313.
16.Z. Zhang, H. Chen, X. She, J. Sun, J. Teo, and F. Su, J. Power Sources, 217 (2012) 336.