H
S
-R
A
of
T
race
E
lements
in
C
orals
using
L
aser
A
blation
ICP-MS
Daniel Jamie Sinclair
A thesis submitted for the degree of Doctor of
Philosophy of The Australian National University
Research School of Earth Sciences, The Australian National University, between April
1994 and March 1999. Except where mentioned in the text, the research described here
is my own. No part of this thesis has been submitted to any other university or similar
institution.
I wish to thank my supervisor Malcolm McCulloch for supporting me during my
Ph.D.; for his patience, ideas, and belief in my work. 1 would also like to thank my
official advisory panel (Steve Blake, Bob Wasson, and Linda Ayliffe), and my
unofficial advisory panel (Mike Gagan, Chantal Alibert, Candace Martin, Dave Barnes, Janice Lough, John Chappell, Bob Loucks and Peta Clode). All of your
help and constructive criticism has contributed immeasurably during all stages of my
Ph.D. I am grateful to the Research School of Earth Sciences for granting me a Jaeger
scholarship, and for all financial and logistical support given to me for conferences and
field-work.
Access to coral samples was kindly granted by the Australian Institute of Marine Science. Stewart Fallon provided analyses of pressed powders, and TIMS Sr/Ca
analyses were performed by Graham Mortimer. Les Kinsley generously and patiently
contributed his extensive knowledge of the ICP-MS, and technical help was provided by
Mike Shelley, Steve Eggins, Paul Sylvester, Chris Morgan, and Bill Hibberson.
The following provided support for field-work: the Queensland Department of Primary Industry, the Queensland National Parks and Wildlife Service (in Airlie
Beach), and the Great Barrier Marine Park Authority. Technical photography was
handled by the gods over at ANU Photography: Stewart Hay and Neil McCracken. A
special mention should be made of Microsoft Corporation, without whose help this would all have been so much easier.
To all of those brave fools who proof-read my thesis (Malcolm McCulloch, John Chappell, Les Kinsley, Erica Hendy, and my Parents): I appreciate your help in the
Herculean task of correcting my grammar and atroshus atrotious bad spelling. I proudly
claim all remaining mistakes as my very own.
I wish to offer special thanks to my two office mates, Monica Handler, and Erica
Hendy; both of whom shared the best and worst moments o f my Ph.D.; weathered my
despair, suffered by humour, and gave unreservedly of their time, friendship, and
(unknowingly) stationary. I owe you both my sanity. Thanks also to my other Ph.D.
buddies, Stewart Fallon and John Marshall: for always being off somewhere
interesting and reminding me how much fun you can have when you’re not writing up.
Many thanks to all those at the RSES who offered me encouragement, smiles, and the
occasional chocolate; especially Lois Taylor, Pat Oswald-Sealey, Janine Dolton,
submit before me, you did me hope that it was possible to survive a thesis. I am grateful
for that. Thanks also to all the previous pink slipper holders, especially Jodie Evans (I still think you cheated), and Sue Keay. You are an inspiration - let the legend live on! All my many friends and housemates on both sides of the Tasman (and, for that matter,
the world) deserve my gratitude for their patience and understanding: I haven’t been the
best of friends during the last 12 months. Special thanks to Nicola Rowe, my fellow dragon-slayer, The Cheshire, whose fading smile haunts me still, Anita Jowitt, for helping me maintain a philosophical perspective on life, and Lara Dolnik, without whom procrastination would have been so much more difficult (and infinitely less enjoyable).
Finally, My family deserve a special mention. They have at times borne the brunt of my frustrations, or suffered my selfish silence; yet throughout this all they have been my
support and my strength. I want to thank my Father for the gifts of curiosity and wonder, and my Mother for patience, persistence and perfection. I am also grateful to my
Brother and Sister, who have shared a lifetime of exploration, and who will always be my greatest friends. If I never said it before: thank you, I love you all. (never write your
A
This research centres around the development and application of laser-ablation ICP-MS
for quantitative analysis of B, Mg, Sr, Ba, and U in Porites coral skeletons. Methodology for laser ablation analysis of corals is not well established. A method has therefore been
developed in which the laser beam is scanned continuously across the surface of both
sample and standard to generate continuous profiles of trace element variation. The laser
beam is masked to produce a long rectangular profile, which averages ablation across a
range of structural features in the coral, while maintaining a high spatial resolution in the
direction of the scan. A calcium silicate glass, made by fusing silica and coral po vder,
was used as a standard. This glass exhibited superior homogeneity, although matrix
differences between it and the coral reduced accuracy and reproducibility.
At high spatial resolutions coral skeletons are extremely heterogeneous, with large trace
element variations on sub-mm scales. While some of these variations may be attributed to
contaminants, there is evidence to suggest that short-timescale physiological variations
may be occurring. The factors influencing trace element concentrations in a coral are
poorly understood, and a review is therefore presented that covers the inorganic
chemistry of trace element coprecipitation, current theories regarding coral
biomineralization, the physicochemical characteristics of biological precipitation fn m a
supersaturated high pH microenvironment within the coral, the physiological factors
affecting trace element transport through coral tissues to the calcifying environment, and
the effects of gross polyp morphology on the distribution of elements within the
skeleton. A second literature review summarises the observations of trace elements in
coral skeletons, the mechanisms of incorporation, the fractionation relative to abiological
aragonites, and the environmental and physiological parameters that are reported to
influence elemental partitioning. These observations are compared with the theoretical
factors, highlighting areas where current coral calcification models cannot adequately
explain the observed trace element behaviour.
Measurements were made of a number of coral structural features at very high spatial
resolutions. Patterns of trace element variation were not well correlated to visible
structures within a coral, and did not appear to form clear 'horizons' o f variation wiihin a
single corallite, or display clear symmetry across an end-section of a corallite. Several
trace elements, however, were strongly correlated with each other, implying a consistent
chemical fractionation. These interelement correlations could not all be accounted far by
correlations, suggesting a mutual chemical link, yet fine-scale variations were too great to
be accounted for by temperature or light intensity, and therefore neither of these
parameters can be directly responsible for seasonal trends (although temperature may be mediating another chemical process).
The fully quantitative method was used to extract seasonal scale variations from a mid
reef coral, and these variations were calibrated against in-situ instrumental sea surface
temperature (SST) records. Calibrations were in reasonable agreement with other
calibrations reported in the literature, and LA-ICP-MS therefore has the potential to
extract quantitative paleo-SST records from corals. The method is limited by the fine-
scale variations which introduce uncertainty into the temperature reconstruction, and by
the fact that the coral trace element record does not appear to be completely faithful to
temperature, with other physiological or environmental factors influencing each trace
element at high resolutions.
The fully quantitative method was also applied to analysis of an extended suite of trace
elements’^several coastal corals that are regularly subjected to fresh-water inundation
during river floods. Barium, Y, La, and Ce were found to record river floods as
enrichments in the coral skeleton, consistent with measurements made of a flood and
coastal flood plume from the Tully River in North Queensland. Skeletal Ba can
potentially provide quantitative discharge reconstmctions; however, it is limited by a
tendency to build up in the river catchments during dry seasons, and mobilise as a large
pulse in the first river flood. Anomalous peaks in barium are also observed for some
corals during spring. This phenomenon is difficult to explain, although a combination of
environmental factors may trigger a physiological or ecological event that results in an
enriched Ba phase being incorporated into the coral skeleton. Possibilities include coral
ACKNOWLEDGEMENTS... I
ABSTRACT... Ill
TABLE OF CONTENTS... V
TABLE OF FIGURES... XVI
TABLE OF TABLES... XIX
C H A PTER 1: INTRODUCTION...1
1.1 INTRODUCTION... 1
1.1.1 Statement of Research...1
1.1.2 Why Investigate Corals?...1
1.1.3 Why High Resolution?...2
1.1.4 Why Laser Ablation ICP-MS?...3
1.2 SUMMARY OF RESEARCH PRESENTED...3
1.2.1 Part 1: Method Development...3
Why Fully Quantitative?... 4
Summary of Chapters... 4
1.2.2 Part 2: Coral Calcification...5
Why Study Calcification?... 5
Summary of Chapters... 5
1.2.3 Part 3: Case Study: Coastal Corals... 6
Why Coastal Corals?... 6
Why River Floods?... 7
Summary of Chapters... 7
C H A PTER 2: ANALYTICAL METHOD... 9
2.1 CORAL SAMPLE PREPARATION... 9
2.1.1 Collection...9
Coral Drilling... 9
2.1.2 Cutting...11
Sectioning the C oral... 11
Marking the Coral...12
2.1.3 Imaging...12
X-Ray... 12
Routine Cleaning... 15
Alternative Cleaning Strategies... 16
2.2 HARDWARE... 17
2.2.1 1CP-MS... 77
Configuration... 17
Sensitivity... 1 8 2.2.2 Sample Cell... 18
2.2.3 Laser System...20
Laser...20
Beam Shape... 20
2.2.4 Effective Resolution...21
2.3 ANALYTICAL METHOD... 22
2.3.1 Isotopes Monitored....22
2.3.2 Summary o f Method....23
2.4 DATA PROCESSING...23
2.4.1 Basic Processing...24
Background/Blank Subtraction...24
Normalising to Calcium...25
Standardisation... 26
Filtering/Smoothing... 26
2.4.2 Secondary Processing...28
Drift Correction (Optional)... 28
Alternative Standard (Optional)...28
Adjusting for Variation in Growth R ate... 29
Re-sampling... 29
2.5 DEVELOPMENTAL HURDLES...30
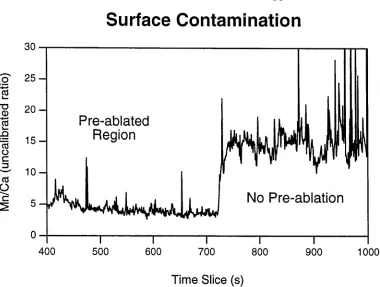
2.5.1 Sample Contamination...30
2.5.2 Fractionation with Drilling...30
2.5.3 Topology...32
2.5.4 Short-term Drift...33
2.5.5 Long-term Drift...35
2.6 SUMMARY... 36
C H A PTER 3: STANDARD D EV ELO PM EN T... 3 9 3.1 INTRODUCTION... 39
3.2 THEORETICAL CONSIDERATIONS...39
Accuracy, Reproducibility and Precision... 39
3.2.1 Homogeneity...40
Effect of Standard Heterogeneity on Precision...40
Effect of Standard Heterogeneity on Reproducibility... 40
Effect of Standard Heterogeneity on Accuracy... 42
3.2.2 Matrix Matching...43
Chemical matrix effects...43
Physical matrix effects... 45
Influence of Matrix Effect on Precision... 48
Influence of Matrix Effect on Reproducibility...48
Influence of Matrix Effect on Accuracy...49
Easily Cleaned... 50
Visible Ablation Track... 51
3.2.5 A Note on Calibration o f Standards...51
3.2.6 Summary...52
3.3 N IS T 6 1 2 /6 1 0 ... 52
3.3.1 Advantages...52
3.3.2 Disadvantages...54
3.4 PRESSED POWDER... 55
3.4.1 Synthesis... 55
Preparation of Crushed Coral Powder... 55
Preparation of the Pressed Powder P elle t... 57
3.4.2 Calibration... 5 7 3.4.3 Advantages... 5 7 3.4.4 Disadvantages...58
3.4.5 Pressed Powder Reconsidered...58
3.5 CA SIO3 (WOLLASTONITE) GLASS... 60
3.5.1 Synthesis...61
3.5.2 Calibration...62
3.5.3 Advantages...62
3.5.4 Disadvantages...62
3.6 STANDARD CORAL...65
3.6.1 Discussion...65
3.7 ARAGONITE CRYSTAL...66
3.7.1 Discussion...68
3.8 FUSED POWDER...68
3.8.1 Preparation...68
3.8.2 Advantages...70
3.8.3 Disadvantages...71
3.9 SUMM ARY...72
NIST 612... 72
W ollastonite... 72
Standard C o ral... 72
Pressed Powder... 73
Fused Powder... 73
Aragonite C rystal... 73
C H A P T E R 4: L A S E R M E T H O D E V A L U A T I O N ... 7 5 4.1 INTRODUCTION... 75
4.2 DETECTION LIMITS... 75
4.2.1 Calculation and Variability... 75
Signal S m oothing... 77
4.2.2 Major Trace Elements... 77
4.2.3 Minor Trace Elements... 77
Nickel Copper and Z inc...77
Lead...77
Manganese, Lanthanum, Cerium, and Yttrium...78
4.3 PRECISION...78
Machine Noise...80
Sample Heterogeneity...81
1.3.2 Major Trace Elements...81
1.3.3 Minor Trace Elements...82
4.4 REPRODUCIBILITY... 82
1.4.1 Components o f Reproducibility...82
1.4.2 Wollastonite Glass Reproducibility...83
Precision... 85
Heterogeneity... 86
Matrix Effects... 87
Additional Day-to-day Irreproducibility...87
D iscussion... 87
1.4.3 Coral Reproducibility...88
Precision... 88
Heterogeneity... 89
Matrix Effects... 91
Additional Day-to-day Irreproducibility... 92
D iscussion... 92
4.5 ACCURACY...93
1.5.1 Experimental...94
Laser Analyses... 94
Bulk Sampling...95
D issolution... 95
A nalysis... 96
1.5.2 Discussion... 97
Statistical Comparison... 98
Sources of Inaccuracy... 100
4.6 SUMMARY... 102
CHAPTER 5: LITERATURE REVIEW: CORAL CALCIFICATION AND PARTITIONING OF TRACE ELEMENTS INTO CORAL SK E L E T O N ... 103
5.1 INTRODUCTION...103
5.2SKELETAL DEPOSITION...104
5.2.1 Calcification from an Organic Matrix...104
5.2.2 Physicochemical Calcification...105
Crystal Growth Within Membrane Sheaths... 105
Free Crystal Growth...106
Skeletal Organisation... 106
Biological Control of Skeletal Formation...107
5.2.3 Summary...108
5.3 METABOLIC CONTROLS ON CALCIFICATION... 109
5.3.1 Introduction...109
5.3.2 Metabolic Processes and Biochemistry...109
Dependence on Metabolic Energy... 1 11 Light and Photosynthesis: Role of Algal Symbiosis... 111
Enzyme Mediation in Ca^+ Transport... 113
ATPases and Active Ion Transport... 113
5.4.1 Summary... 118
5.5 KINETICS AND THERMODYNAMICS OF TRACE ELEMENT PARTITIONING... 119
5.5.1 Solution Concentration... 120
5.5.2 Calcification Rate...120
5.5.3 Temperature Dependence... 121
5.5.4 Solution Composition... 122
5.5.5 Summary... 122
5.6 IMPLICATIONS OF CALCIFICATION MODEL FOR TRACE ELEMENT PARTITIONING... 123
5.7 CONCEPTUAL MODEL OF ION TRANSPORT... 124
5.7.7 Transport o f ions into the Coelenteron... 125
5.7.2 Transport o f ions to the Calcifying Surface... 127
5.7.3 Balance o f Different Ion Transport Paths... 127
5.7.4 Implications fo r Trace Element Partitioning... 129
C a^+ Transport... 129
Other Io n s... 129
5.7.5 Summary...131
5.8 SKELETAL GROWTH AND STRUCTURE... 132
Implications for Trace Element Distribution... 133
C H A P T E R 6: L I T E R A T U R E R E V I E W : T R A C E E L E M E N T S IN C O R A L S ... 1 3 5 6.1 INTRODUCTION... 135
6.2 STRONTIUM ... 135
6.2.1 Mechanism o f Incorporation...135
Lattice Substitution... 135
Biogenic vs. Inorganic Aragonite... 136
6.2.2 Factors Affecting Partitioning... 136
Biological F actors... 136
Tem perature... 138
Growth R ate... 141
Sr/Ca in Seawater... 142
Other Factors... 143
6.2.3 Fine-Scale Variability... 144
6.3 M AGNESIUM ... 144
6.3.1 Mechanism o f Incorporation... 144
Lattice B o u n d ... 145
Other Mineral P hase... 145
Adsorbed and Organic Phases... 146
6.3.2 Factors Affecting Partitioning... 146
Tem perature... 146
Biological F actors... 148
Growth R ate... 149
Other Factors... 149
6.3.3 Fine-Scale Variability... 150
6.4 BARIUM... 151
6.4.1 Mechanism o f Incorporation... 151
P h a se ... 151
Biogenic vs. Inorganic Aragonite... 152
Temperature... 1 54 Water Chemistry...1 54
6.4.3 Fine-Scale Variability...155
6.4.4 Ba Spikes...156
6.5 BORON... 157
6.5.1 Mechanism of Incorporation...157
Adsorption to Crystal Surface... 157
Isotopic Evidence... 158
Incorporation into the Crystal... 158
Biogenic vs. Inorganic Aragonite...159
6.5.2 Factors Affecting Partitioning...160
Biological Factors... 160
Temperature Dependence... 164
Other Factors...164
Salinity...1 64 6.5.3 Fine-Scale Variability...165
6.6 URANIUM...166
6.6.1 Mechanism o f Incorporation...166
Biogenic vs. Inorganic Aragonite...167
6.6.2 Factors Affecting Partitioning...167
Carbonate Concentration, pH, and p C 0 2 ... 167
Biological Factors... 170
Calcification and Growth R ate... 171
Temperature... 172
Salinity... 172
6.6.3 Fine-Scale Variability...173
C H A PT E R 7: T R A C E E L E M E N T S IN C O R A L S AT H IG H R E S O L U T IO N ... 1 7 5 7.1 INTRODUCTION...175
7.2 ABLATION AT DEPTH... 177
7.2.1 Experimental...177
7.2.2 Results and Discussion...177
7.3 SINGLE STRUCTURAL ELEMENTS... 179
7.3.1 Experimental...179
Samples... 179
Preparation...179
Photography... 1 82 Laser Analysis...182
7.3.2 Results...184
7.3.3 Discussion...184
Periodicity...184
Correlation with Structure...185
Correlation Within a Corallite... 186
Summary...188
7.4 CALYX CROSS SECTION...189
7.4.1 Experimental...189
7.4.2 Results...189
7.5.1 Processing... 192
7.5.2 Observations... 193
Magnitude of Variation... 193
Histograms... 194
Correlations... 196
7.5.3 Discussion...202
Correlation Theory...203
N oise... 203
7.5.4 Structural Features...204
Thickening... 204
Calyx Architecture... 207
Structural Element Composition... 208
7.5.5 Contaminants...209
Different Types of Contaminant... 209
Trace Elements and Contaminants...211
7.5.6 Physiology...214
Physiological... 214
Biochemical...215
7.5.7 Environmental...220
Temperature...220
Light Intensity... 222
pH ...223
S alin ity ... 223
Carbonate Ion Concentration...223
Seawater Chemistry...224
Nutrients and Food Sources...225
Final N ote... 225
7.6 SUMMARY...226
General...226
Boron... 226
Magnesium... 227
Strontium...227
Barium... 227
Uranium... 227
Discussion... 228
C H A PT E R 8: SEA SURFACE TEMPERATURE CALIBRATIONS...2 2 9 8.1 INTRODUCTION...229
8.2 EXPERIMENTAL... 229
8.2.1 Samples...229
8.2.2 Methods...230
8.3 RESULTS...232
8.3.1 Comparison o f Seasonality with Literature...233
8.3.2 Shapes o f Seasonal Profiles...237
Strontium...241
Boron... 242
Magnesium... 242
8.4 CONCLUSIONS...244
C H A PTER 9: TULLY RIVER FLOOD P L U M E ... 2 4 7 9.1 INTRODUCTION...247
9.2 METHODS...248
9.2.1 Sample Collection M ethod...248
9.2.2 Sample Handling and Treatment...248
9.3 SAMPLES... 249
9.3.1 Location...249
Tully Catchment...249
Local Climate... 249
Coastal Region... 250
9.3.2 Flood Event...250
9.3.3 Samples Taken...252
Tully River Sampling...252
Flood Plume Sampling... 253
9.4 ANALYSIS... 255
9.4.1 Sample Treatment and Analysis...255
9.5 RESULTS AND DISCUSSION... 255
9.5.1 Limitations o f the Data Set... 255
9.5.2 Presentation o f the D ata...257
9.5.3 Initial Observations...257
9.5.4 Some Theoretical Considerations...258
9.5.5 Calcium...259
Results and Discussion...261
9.5.6 Boron...261
Results...261
Discussion... 261
9.5.7 Magnesium...265
Results...265
Discussion... 265
9.5.8 Strontium...266
Results...266
Discussion... 268
9.5.9 Uranium...268
Results...268
Discussion... 268
9.5.10 Barium...270
Results...270
Discussion... 271
9.5.11 Rare Earth Elements and Yttrium...273
Results...273
Discussion... 275
9.5.12 Manganese... 277
Results...277
Discussion... 279
9.6 IMPLICATIONS FOR CORAL TRACE ELEMENTS... 280
C H A PT E R 10: TRACE ELEMENTS IN COASTAL CORALS: INVESTIGATING ANOMALOUS BARIUM BEHAVIOUR...28 3
10.1 INTRODUCTION...283
10.2 CORAL SAMPLES...284
10.2.1 Whitsundays...284
Sam ple...284
L ocation...284
10.2.2 Pandora Reef....287
Sam ple...287
L ocation...287
10.2.3 Orpheus Island...289
Sam ple...289
L ocation... 289
10.2.4 Kurrimine...289
Sam ple...289
L ocation... 289
10.3 ANALYSIS... 291
10.4 RESULTS... 292
10.4.1 Ni, Cu, Zn, and Pb...292
10.4.2 Seasonal Signals: B, Mg, Sr, and U...292
10.4.3 Flood Signals: Fluorescence, Y, La, Ce, and B a...294
10.4.4 Pandora and Kurrimine Corals: 'Normal' Ba Behaviour... 295
Barium Washout, and Residence Time...296
10.4.5 Whitsundays and Orpheus Island Corals: 'Anomalous' Ba Behaviour... 300
Whitsundays Coral...300
Orpheus Island C oral...302
10.5 DISCUSSION... 304
10.5.1 Reports o f Anomalous Ba Behaviour in the Literature...304
Early Literature... 304
Recent Reports... 304
Summary of Observations to Account fo r... 307
10.5.2 Environmental Cues...308
Wind...309
Tides...311
Water Temperature...312
Sunlight... 313
Upwelling, Food Sources & Nutrients...314
10.5.3 Physiology...314
Spawning...315
Other Stressors... 316
10.5.4 Barium Enrichments in Seawater...316
Floods... 317
Groundwater...317
Upwelling... 317
Particulate Desorption... 317
Anthropogenic Inputs... 318
Resuspended Sediments...320
Wind Blown D u st...320
Biological Particulates...320
O rganics... 321
10.6 SUMMARY AND CONCLUSIONS... 321
C H A P T E R 11: S U M M A R Y ...3 2 5 11.1 M ETHOD... 325
11.1.1 LA-ICP-MS Method...325
11.1.2 Standards...326
11.1.3 Evaluation of Method....327
11.2 SOURCES OF TRACE ELEMENT VARIATION IN CORAL SKELETONS... 328
11.2.1 Introduction...328
11.2.2 Contaminants...328
What is K nown... 328
What is Unknown...329
Insights from this R esearch... 329
11.2.3 Water Chemistry...330
What is Known... 330
What is Unknown...330
Insights from this R esearch... 330
11.2.4 Physiology and Biochemistry...331
What is K now n... 331
What is Unknown...332
Insights from this R esearch... 333
11.2.5 Inorganic Chemistry...334
What is K now n...334
What is Unknown...335
Insights from this R esearch... 336
11.3 CASE STUDY: TRACE ELEMENTS IN COASTAL CORALS... 336
11.3.1 River Flood Records...336
11.3.2 Anomalous Barium Signals...337
R E F E R E N C E S ... 3 4 1 A P P E N D IX A: D I S T R I B U T I O N C O E F F I C I E N T S A N D I N O R G A N IC C A L C I F I C A T I O N T H E O R Y ... 3 5 7 A .l OVERVIEW...357
A .2 KINETIC VS. THERMODYNAMIC CONTROL... 357
A.2.1 Equilibrium Distribution Coefficient....358
A.2.2 Kinetic Distribution Coefficient...359
A.3 REACTION VS. TRANSPORT CONTROL...360
A.3.1 Reaction Limiting Case...363
A.3.2 Transport Limiting Case...363
A.6 TEMPERATURE DEPENDENCE...368
A.7 SOLUTION COMPOSITION... 370
Energy T erm s...371
Activity Coefficients... 371
Diffusion C oefficients... 372
S peciation... 372
A.8 CRYSTAL FORM AND C A C O3 PHASE PRECIPITATED... 372
A. 8.1 Specific Crystal Poisons and Growth Modifiers...373
M agnesium ... 373
Sulphate...373
P h o sp h a te ...373
O rg an ics... 374
A .9 SUM M ARY ...374
A. 10 REFERENCES...375
A P P E N D IX B: E Q U I L I B R I U M M O D E L S O F U R A N IU M A N D B O R O N S P E C I A T I O N ... 3 7 9 B . l OVERVIEW...379
B.2 CHEMICAL EQUILIBRIA... 380
B. 2.1 Carbonate Speciation...380
B.2.2 Boron Speciation...380
B.2.3 Uranium Speciation...380
B.3 BORON CALCULATIONS... 381
B.4 URANIUM CALCULATIONS... 381
B.5 CARBON CALCULATIONS: MODEL 1 ...383
B.6 CARBON CALCULATIONS: MODEL 2 ... 383
B.7 MODEL PARAMETERS...384
B.8 REFERENCES...385
F IG U R E 2.1 CORAL DRILLING RIG... 10
F IG U R E 2 .2 SECTIONING THE CORAL... 12
F IG U R E 2 .3 PHOTOGRAPHING THE CORAL SECTIONS UNDER UV LIGHT... 15
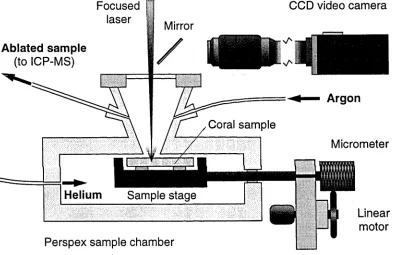
F IG U R E 2 .4 SCHEMATIC OF ABLATION C ELL... 19
F IG U R E 2 .5 LASER SPOT SIZE...21
F IG U R E 2 .6 DEMONSTRATION OF OFF-LINE DIGITAL FILTERING... 27
F IG U R E 2 .7 DEMONSTRATION OF SURFACE CONTAMINATION...31
F IG U R E 2 .8 STATIC AND SCANNED ANALYSIS OF THE N IST 612 STANDARD... 32
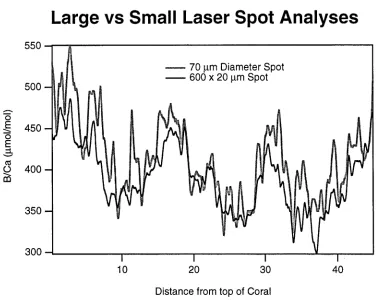
F IG U R E 2 .9 EFFECTS OF LASER SPOT SIZE ON TRACE ELEMENT PROFILE... 34
F IG U R E 2 .1 0 EXAMPLE OF NONLINEAR (SHORT-TERM) DRIFT... 35
F IG U R E 2 .1 1 EXAMPLE OF LINEAR (LONG-TERM) D R IFT ... 36
F IG U R E 3.1 MODELS OF HETEROGENEITY IN STANDARD...41
F IG U R E 3 .2 SCHEMATIC OF LASER ICP-M S SYSTEM...44
F IG U R E 3 .3 NONLINEAR CONCENTRATION VS. COUNT RATE RESPONSE IN IC P-M S...50
F IG U R E 3 .4 PROFILES OF SCANS ACROSS N IS T 612 GLASS...53
F IG U R E 3 .5 PROFILES OF SCANS ACROSS A PRESSED POWDER PELLET...59
F IG U R E 3 .6 PROFILES OF SCANS ACROSS THE OLD WOLLASTONITE GLASS...63
F IG U R E 3 .7 PROFILES OF SCANS ACROSS THE NEW WOLLASTONITE GLASS... 64
F IG U R E 3 .8 PROFILES OF SCANS ACROSS THE STANDARD CORAL...66
F IG U R E 3 .9 PROFILES OF SCANS ACROSS AN ARAGONITE CRYSTAL...67
F IG U R E 3 .1 0 SYNTHESIS OF THE FUSED POWDER STANDARD...69
F IG U R E 3 .1 1 PROFILES OF SCANS ACROSS THE FUSED POWDER STANDARD...70
F IG U R E 4.1 REPLICATE ANALYSES OF THE WOLLASTONITE GLASS... 84
F IG U R E 4 .2 REPLICATE LASER ANALYSES ON THE DAVIES 2 CORAL... 89
F IG U R E 4 .3 REPLICATE ANALYSES OF THE DAVIES 2 CORAL... 90
F IG U R E 5 .1 BASIC CORAL ANATOMY... 116
F IG U R E 5 .2 'TRANS'CALCIFICATION MECHANISM... 117
F IG U R E 5 .3 CONCEPTUAL MODEL OF ION TRANSPORT PATHWAYS...126
F IG U R E 6.1 BORON SPECIATION IN SEAWATER WITH PH...161
F IG U R E 6 .2 BORON TO CARBON RATIOS WITH PH...163
F IG U R E 6 .3 URANIUM SPECIATION IN SEAWATER WITH PH... 168
F IG U R E 6 .4 URANIUM TO CARBON RATIOS WITH PH ...169
F IG U R E 7 .1 REPRODUCIBILITY OF CORAL TRACE ELEMENT PROFILES... 176
F IG U R E 7 .2 TRACE ELEMENT VARIATIONS ASSOCIATED WITH DEPTH ABLATION... 178
F IG U R E 7 .3 STRUCTURAL ELEMENTS ANALYSED IN DAVIES IB CORAL...180
F IG U R E 7 .4 STRUCTURAL ELEMENTS ANALYSED IN ORPHEUS ISLAND CORAL...181
F IG U R E 7 .5 SCHEMATIC CROSS SECTION THROUGH A CORALLITE... 183
F IG U R E 7 .6 EXAMPLE OF A FINE SCALE TRACE ELEMENT SIGNAL... 185
F IG U R E 7 .9 SCANS ACROSS AN END SECTION OF A CORALLITE... 190
F IG U R E 7 .1 0 GROWTH PROFILE OF A CORAL CALYX... 191
F IG U R E 7 .1 1 EXAMPLE OF WAVELET FILTERING... 193
F IG U R E 7 .1 2 HISTOGRAMS OF FINE COMPONENT OF TRACE ELEMENT VARIATION... 195
F IG U R E 7 .1 3 SCATTER PLOT MATRIX: FINE COMPONENT OF COMPOSITE DATA SET... 199
F IG U R E 7 .1 4 SCATTER PLOT MATRIX: COARSE COMPONENT OF COMPOSITE DATA SET... 200
F IG U R E 7 .1 5 SCATTER PLOT MATRIX: CO ARSE COMPONENT OF DAVIES 2 DATA SET... 201
F IG U R E 7 .1 6 INVERSE CORRELATION BETWEEN MAGNESIUM AND URANIUM...202
F IG U R E 7 .1 7 SCHEMATIC CROSS SECTION THROUGH A STRUCTURAL ELEMENT...205
F IG U R E 7 .1 8 OUTPUT FROM THE TISSUE SMOOTHING MODEL...206
F IG U R E 7 .1 9 OUTPUT FROM THE U AND B SPECIATION MODELS...217
F IG U R E 7 .2 0 FINE SCALE VARIATIONS AS TEMPERATURE EQUIVALENTS... 221
F IG U R E 8.1 SAMPLE LOCATIONS ON DAVIES 2 CORAL... 231
F IG U R E 8 .2 SEASONAL SIGNALS IN DAVIES 2 CORAL...233
F IG U R E 8 .3 SCATTER PLOTS OF TRACE ELEMENT AGAINST SST...234
F IG U R E 8 .4 SST CORRELATION LINES FOR SR/CA... 237
F IG U R E 8 .5 SST CORRELATION LINES FOR M G/CA... 238
F IG U R E 8 .6 SST CORRELATION LINES FOR U /C A ... 239
F IG U R E 8 .7 SST CORRELATION LINES FOR B/CA ...240
F IG U R E 9.1 MAP OF TULLY RIVER AND CARDWELL COAST... 251
F IG U R E 9 .2 HYDROGRAPH OF TULLY RIVER FLOOD... 252
F IG U R E 9 .3 AERIAL VIEW OF TULLY RIVER FLOOD PLUME... 254
F IG U R E 9 .4 TRACE ELEMENT BEHAVIOUR DURING MIXING... 260
F IG U R E 9 .5 CALCIUM BEHAVIOUR IN TULLY RIVER FLOOD WATERS... 262
F IG U R E 9 .6 BORON BEHAVIOUR IN TULLY RIVER FLOOD WATERS... 263
F IG U R E 9 .7 MAGNESIUM BEHAVIOUR IN TULLY RIVER FLOOD WATERS...266
F IG U R E 9 .8 STRONTIUM BEHAVIOUR IN TULLY RIVER FLOOD WATERS... 267
F IG U R E 9 .9 URANIUM BEHAVIOUR IN TULLY RIVER FLOOD WATERS... 269
F IG U R E 9 .1 0 BARIUM BEHAVIOUR IN TULLY RIVER FLOOD WATERS...271
F IG U R E 9 .1 1 LANTHANUM BEHAVIOUR IN TULLY RIVER FLOOD WATERS... 274
F IG U R E 9 .1 2 CERIUM BEHAVIOUR IN TULLY RIVER FLOOD WATERS...275
F IG U R E 9.13 YTTRIUM BEHAVIOUR IN TULLY RIVER FLOOD WATERS... 276
F IG U R E 9 .1 4 MANGANESE BEHAVIOUR IN TULLY RIVER FLOOD WATERS...278
F IG U R E 10 .1 MAP SHOWING LOCATIONS OF CORAL SAMPLES...285
F IG U R E 1 0 .2 MAP: LOCATION OF WHITSUNDAYS CORAL...286
F IG U R E 1 0 .3 MAP: LOCATION OF PANDORA REEF AND ORPHEUS ISLAND CORALS... 288
F IG U R E 1 0 .4 MAP SHOWING LOCATION OF KURRIMINE CORAL...290
F IG U R E 1 0 .5 EXAMPLES OF SEASONAL SIGNALS IN THE WHITSUNDAYS CORAL...293
F IG U R E 1 0 .6 EXAMPLES OF RIVER FLOOD SIGNALS IN THE KURRIMINE CORAL... 295
F IG U R E 1 0 .7 SELECTED TRACERS IN THE PANDORA REEF CORAL...297
F IG U R E 1 0 .8 SELECTED TRACERS IN THE KURRIMINE CORAL... 298
F IG U R E 1 0 .9 PANDORA CORAL BA/CA PROFILE VS. BURDEKIN RIVER DISCHARGE...299
F IG U R E 1 0 .1 0 SELECTED TRACERS IN THE WHITSUNDAYS CORAL... 301
F IG U R E 1 0 .1 1 SELECTED TRACERS IN THE ORPHEUS ISLAND CORAL... 303
F IG U R E 1 0 .1 2 ANOMALOUS BARIUM IN CORALS FROM OMAN...305
F IG U R E 10.13 ANOMALOUS BARIUM IN A CORAL FROM SOUTH AFRICA...307
FlGlRE 1 0 .1 6 TIDE HEIGHT DATA FROM SHUTE HARBOUR... 312
FIGIRE 10.17 DAILY SST AND LIGHT INTENSITY DATA FROM DAVIES REEF... 313
T
T
TABLE 2.1 PHOTOGRAPHIC SETTINGS...14
TABLE 2 .2 ICP-M S AND GAS FLOW CONFIGURATION...17
TABLE 2.3 LASER CONFIGURATION...20
TABLE 2 .4 SUMMARY OF ANALYTICAL METHOD... 24
TABLE 2 .5 DATA PROCESSING STEPS...25
TABLE 3.1 STATISTICS FROM MODELLED STANDARDS... . ...4 2 TABLE 3.2 HETEROGENEITY IN STANDARDS...54
TABLE 3 .3 COMPOSITIONS OF STANDARDS... ...56
TABLE 3 .4 COUNT RATES FOR LASER ANALYSIS OF STANDARDS...60
TABLE 3.5 SUMMARY OF STANDARDS INVESTIGATED... 72
TABLE 4.1 DETECTION LIMITS... 76
TABLE 4 .2 PRECISIONS...79
TABLE 4.3 LIST OF ALL ANALYSES USED IN REPRODUCIBILITY CALCULATIONS... 85
TABLE 4 .4 REPRODUCIBILITY OF REPLICATE WOLLASTONITE GLASS ANALYSES...86
TABLE 4 .5 REPRODUCIBILITY ON REPLICATE ANALYSES OF DAVIES 2 CORAL... 91
TABLE 4 .6 CORAL REPRODUCIBILITY...93
TABLE 4.7 ACCURACY...94
TABLE 4 .8 COMPOSITIONS OF ISOTOPE DILUTION SOLUTIONS...96
TABLE 4 .9 STATISTICAL ANALYSIS OF ACCURACY...99
TABLE 5.1 CALCIFICATION RA TES... 110
TABLE 6.1 DISTRIBUTION COEFFICIENTS IN CORAL AND INORGANIC ARAGONITE... 137
TABLE 7.1 MAGNITUDES OF TRACE ELEMENT VARIATION IN THE DAVIES 1B CORAL...194
TABLE 7 .2 SELECTED INTER-ELEMENT CORRELATION STATISTICS... .. 197 TABLE 7 .3 MODELLING COUNTING STATISTICS ERRORS...204
TABLE 8.1 SST VS. TRACE ELEMENT CALIBRATIONS...235
TABLE 8.2 SOLUTION ISOTOPE DILUTION DATA FOR DAVIES 2 CORAL...236
TABLE 9.1 TULLY RIVER FLOOD SAMPLES...253
TABLE 9 .2 TRACE ELEMENT CONCENTRATIONS IN WATER SAMPLES...256
C
hapter
1: I
n t r o d u c t io n
1.1 Introduction
1.1.1 Statement of Research
The aim of this research was to develop methodology for quantitative, high spatial-
resolution analysis of trace elements (TEs) in Porites corals by laser-ablation inductively- coupled plasma mass spectrometry (LA-ICP-MS), then to apply these methods to extract
environmental information from skeletal trace element records, and to explore the
chemistry and biochemistry of trace element deposition into coral skeleton.
1.1.2 Why Investigate Corals?
As corals grow they deposit an aragonitic skeleton, into which trace elements from the
surrounding sea water are coprecipitated. The skeletal trace element concentrations are
controlled by a number of factors, including the composition and temperature of the sea
water. Corals therefore have the potential to act as an archive of the chemical and
physical environment in which they are growing.
Corals deposit their calcareous skeletons at a relatively uniform rate, extending by
around 1 - 2 cm a year in the case of Porites (Veron, 1986). The density of the skeleton they deposit varies seasonally, generating annual density bands that can be clearly seen
in X-ray photographs of coral slices. Coral density bands can therefore be used to assign
an accurate chronology to the coral, in much the same way that counting rings can be
used to tell how old a tree is. In addition, the presence of other skeletal markers, such as
fluorescent flood bands (Barnes and Taylor, 1998; Boto and Isdale, 1985; Scoffin et al.,
1989; Susie et al., 1991), can be used to independently verify the chronology (Isdale
and Parker, 1995). Corals therefore combine the dating accuracy of tree rings with the
same potential to act as geochemical archives that is offered by sediment cores.
Individual Porites colonies have been known to grow continuously for up to 1,000 years (Isdale and Parker, 1995; Veron, 1986). The long records that these corals may contain
span a critical period of recent human history, covering the dramatic increases in human
southern Pacific. Corals are therefore well suited for providing high fidelity climate
records with which to test anthropogenic influences on the global and local
environments, such as global warming, pollution, and the impact of high-intensity
agriculture along tropical coastlines. Being aragonite, coral skeletons preserve readily,
and fossil corals are providing vital information on global climate from as far back as the
penultimate deglaciation (McCulloch et al., 1999).
Coral records are all the more valuable because of the lack of other paleo-recorders in
tropical regions (e.g. tree rings and ice-cores). The tropics, however, are an important
environment, with most of the worlds fresh water and sediment entering the oceans at
tropical latitudes (Chester, 1990; Holland, 1978), and the warm waters of the western
Pacific significantly influencing global climate.
While corals have been the subject of a considerable amount of research over the last
decade, there remain many areas of coral geochemistry still to explore; including new
chemical tracers, new locations and environments, and a greater understanding of the
biochemical and biological processes influencing trace element coprecipitation.
1.1.3 Why High Resolution?
It is common for corals to be analysed at fairly low spatial resolutions (quarterly or
annually Lea et al., 1989; Shen and Boyle, 1988; Shen et al., 1992; Shen and Dunbar,
1995; Shen and Sanford, 1990), partly because of the amount of work involved in
analysing long coral records, and partly because of the practical limitations of sampling
and measuring very small amounts of coral. As analytical and sampling methods have
improved with time, it has been possible to analyse corals at increasingly finer
resolutions, until a coral can now be analysed at close to daily resolution using micro
beam methods (Allison, 1996b; Allison and Tudhope, 1992; Hart and Cohen, 1996).
There are three main reasons to analyse corals at very high spatial resolutions. Firstly, a
number of interesting environmental processes occur on sub-monthly timescales.
Examples include individual climatic events such as cyclones, intrusions of upwelled
water, river floods, single discharges of pollutants, algal blooms, etc. Many of these
events have durations of days to weeks only. In order to characterise such short-lived
phenomena in a coral record, it is necessary to sample at a resolution that is significantly
higher than the event.
The second reason to analyse skeletons at high resolution is to examine physiological
events in the coral. Physiology is believed to have an influence on the trace element
composition of the aragonite deposited by a coral (e.g. de Villiers et al., 1995; de Villiers
et al., 1994); however, there is still much debate over the magnitude of such effects and
physiological processes occur on sub-monthly timescales, including diurnal variations in
calcification rate, feeding, stress events, bleaching, and spawning. Examining coral
skeletons at high resolutions may help to resolve these effects.
Finally, the bulk composition of coral skeletons may be significantly affected by the
presence of finely dispersed micro-scale non-aragonitic contaminant phases, such as
microborings, organic inclusions, centres of calcification and embedded particulates
(Allison, 1996b; Allison and Tudhope, 1992). By examining skeletons at high
resolution, it might be possible to determine which of these phases have the potential to
affect coral trace element records.
1.1.4 Why Laser Ablation ICP-MS?
Laser ablation ICP-MS is a relatively new technique, which had yet to be applied to the
analysis of corals. The equipment used for laser micro-sampling is capable of focusing
an ultraviolet laser beam onto a spot as small as 20 p.m in diameter; when coupled with a
quadrupoie ICP-MS, the technique can easily provide sensitive multi-element analysis of
coral skeletons at daily resolution.
Laser ablation has a number of advantages over other micro-beam techniques such as ion
and electron microprobe. Because the laser system uses long focal-length optics,
ablation occurs with almost equal efficiency over depths of up to 1 mm, and there is
consequently no need to impregnate coral samples with epoxy to block holes and pores
within the structure. Sample preparation is therefore minimal, and the sampling is
essentially non-destructive, allowing later milling of the coral for analysis by wet-
chemical techniques. The laser can be masked to produce a number of shapes and sizes
of laser spot, and ablation intensities can be varied, making LA-ICP-MS more flexible
than other competing techniques. By slowly shifting the coral beneath the laser it is
possible to 'scan' the sample surface, providing a continuous profile of trace element
concentration with distance. Finally, the technique is very rapid compared with other
methods, with 5 cm of coral taking approximately 1V2 hours to analyse.
1.2 Summary of Research Presented
1.2.1 Part 1: Method Development
Chapters 2 - 4 of this thesis describe the development and testing of a fully quantitative
Why Fully Quantitative?
Trace elements coprecipitate with Ca into aragonite in proportion to the TE/Ca ratio in the
precipitating solution. By measuring TE/Ca ratios in coralline aragonite it is therefore
possible to quantitatively estimate the composition of the seawater in which the coral was
growing (e.g. Lea et al., 1989; Shen et al., 1987; Shen and Sanford, 1990). A number
of these trace elements show a temperature dependent partitioning. Accurate TE/Ca
measurements can therefore be used as the basis of a quantitative sea-surface temperature
(SST) reconstruction.
Trace elements that have been reported as having a temperature dependence include Sr,
U, and Mg (Min et al., 1995; Mitsuguchi et al., 1996; Shen et al., 1996; Shen and
Dunbar, 1995; Smith et al., 1979). For Sr, the variation in water temperature between
summer and winter produces variations in the Sr/Ca ratio of only a few percent, and LA-
ICP-MS is unlikely to ever be precise enough for useful SST reconstruction. Both U
and Mg vary by up to 30%, and if an analytical method can be developed that results in
accuracies and precisions better than about 5%, then it can be used to extract high
fidelity, high-resolution SST information from coral skeletons.
Obtaining profiles of relative trace element variation is a simple matter using LA-ICP-
MS. Quantifying those variations, however, is more difficult, requiring the synthesis of
suitable standard materials, and the adoption of strategies to minimise and correct for
fluctuations in ICP-MS sensitivity. While this adds complexity to the analytical method,
the capacity to provide fully quantitative analysis of trace elements significantly expands
the applications and potential of the technique.
Summary of Chapters
Chapter 2 describes the routine methodology used for much of the research presented
in this thesis. This includes descriptions of coral sampling strategies, sample
preparation, equipment, analyses of materials by both solution and LA-ICP-MS, and
data processing. The development of the LA-ICP-MS method is covered in detail, and a
number of the analytical problems encountered during this process are discussed.
Chapter 3 presents the search for a suitable standard for coral analysis by laser
ablation. Theoretical aspects of standardisation, and the properties of an ideal coral
standard are discussed. The synthesis, calibration, and analysis of several candidate
reference materials is described, and their potential as coral standards are evaluated.
Chapter 4 presents a detailed evaluation of the final analytical method, focusing on the performance of a coral-composition CaSiC>3 glass standard. The method is evaluated
with respect to sensitivity, precision, reproducibility, and accuracy, and the components
1.2.2 Part 2: Coral Calcification
Chapters 5 - 8 of this thesis investigate the inorganic, biological, physical and
environmental factors that control trace element coprecipitation into skeletal aragonite.
Why Study Calcification?
Until relatively recently, research into trace elements in coral skeletons has largely been
observational and empirical: researchers have noted correlations between a trace element
and an environmental parameter in one coral and used this property to reconstmct
environmental signals from analyses of other corals. Although some attempts have been
made to rationalise these correlations in terms of calcification chemistry and physiology,
few completely satisfactory explanations have emerged; corals are often assumed to
passively incorporate trace elements, or are treated as 'black boxes'. While this approach
may be justified for some elements that appear to respond purely to temperature, there is
a growing body of evidence suggesting that trace element deposition may be
significantly affected by physiological and chemical processes occurring within the coral
polyp.
In the past, coral geochemists have not needed a detailed understanding of the
physiology and biology of calcification. It is critical to the future of coral environmental
records that some of these underlying principles are understood. Coral science is now at
a point where research needs to be more interdisciplinary; synthesising chemical,
environmental, and biological aspects of coral trace element chemistry into a broader
holistic understanding of calcification and trace element records.
Summary of Chapters
Chapter 5 is a research essay asking the question 'How are trace elements taken from
seawater and precipitated into coral skeleton?'. It covers inorganic trace element
coprecipitation theory, biochemical models of calcification, physiological models of ion
transport to the calcifying surface, calcification biology, and the geometrical controls
these impose on the distribution of trace elements within the coral structure. This chapter
also highlights areas where important background knowledge is lacking, and where
current models fail to explain some observations. A simple conceptual summary of the
main ion transport pathways to the skeleton is presented, including the physiological and
biochemical factors that may influence calcification, together with the implications these
have for trace element deposition into the coral skeleton.
Chapter 6 is a systematic review of B, Mg, Sr, Ba, and U in coral skeletons. It covers
the postulated mechanistics and kinetics of coprecipitation for each element, and the
This literature survey highlights areas of debate, areas where understanding is poor, and
observations that are inconsistent with the generally accepted physiological and inorganic
mechanisms.
Chapter 7 presents the results of very high (daily) resolution laser analyses of
individual skeletal structures in a coral from Davies Reef. It examines the spatial
distribution of the major trace elements relative to structural features in the skeleton, and
the correlations of the trace elements to each other. Attempts are made to rationalise these
observations with the growth and physiological processes reviewed in the previous two
chapters, and to help constrain the various conflicting models.
Chapter 8 focuses on the cyclic seasonal-scale trace element variations in a coral from
Davies Reef, correlating them with in-situ instrumental sea surface temperature
measurements. The geochemical thermometers for B, Mg, Sr, and U are tentatively
calibrated, treating the temperature correlations empirically. Deviations from pure
temperature behaviour are examined as evidence for other confounding environmental or
physiological processes.
1.2.3 Part 3: Case Study: Coastal Corals
Chapters 9 and 10 of this thesis present a case study of the chemistry of corals growing
close to the Queensland coast, with a particular emphasis on the geochemical records of
river floods in their skeletons.
Why Coastal Corals?
Most of the coral-based trace element records that have been published are derived from
colonies that are growing in mid-oceanic environments (e.g. Galapagos Islands Lea et
al., 1989; Linn et al., 1990; Shen and Sanford, 1990). This is not surprising, as oceanic
corals are removed from the complicating geochemical influences of coastal zones and
continental margins. Until recently, relatively little interest had been shown in corals
growing close to shore because of the 'messy' trace element signals that they produce.
There is no doubt that the coastal zone is a complex and geochemically dynamic
environment, influenced by continental weathering, upwelling, turbidity, sediment
chemistry, and fresh water inputs (Chester, 1990). This zone, however, represents the
ocetxrt
major link between the land and the A The chemistry that occurs here has a significant
impact on the chemistry of the global oceans. Although well studied, there are still areas
where current understanding of coastal processes is poor. Trace element records from
near-shore corals may therefore hold important information about the chemistry and
Because so many processes affect the coastal waters, corals have the potential to hold
information on a diverse range of chemical processes (e.g. sediment chemistry,
weathering, and transport), physiological processes (e.g. bleaching), and climatic
processes (e.g. rainfall and river discharge). Of major interest is the potential for corals
to record information on the impact of European settlement and agricultural practices on
the coastal environment. Intensive agriculture is responsible for increases in
deforestation, soil erosion, sedimentation, and nutrient levels, while large human
population centres are associated with discharge of industrial and urban effluents.
Because of the long lifetime of individual colonies, corals may provide high fidelity
proxy records of water quality prior to instrumental records.
Why River Floods?
River discharge is the major link between the mainland and the coastal waters. In tropical
latitudes where Porites corals are found, the rainfall is generally dominated by monsoonal and cyclonic weather patterns in summer (Wolanski, 1994). This tends to
lead to a long dry season during winter when tropical rivers hardly flow, followed by a
short intense rainy season characterised by several extreme river floods. These large
floods are responsible for delivering most of the annual load of sediment, dissolved
material and fresh water to the coastal zone, hence they can significantly influence the
chemistry of this environment.
Major river floods are difficult to predict. They are also short in duration, with river
levels dropping significantly within a few days, and coastal flood plumes mostly
dispersed after several weeks (Wolanski and Jones, 1981). This makes them hard to
sample, especially as most of the dissolved and particulate material is mobilised during
the early rising flood waters. Corals growing in the coastal zone are ideally placed to act
as proxy recorders of river discharge, and the formation of distinct fluorescent lines in
their skeletons during flood events aids in the identification and extraction of river-flood
records.
Summary of Chapters
Chapter 9 presents water sample analyses from a river flood in North Queensland in
1996. Fresh water and saline flood plume waters were collected as profiles in space and
time, and analysed for a range of trace elements to gain insight into the behaviour and
transport of trace elements into the coastal regions. The implications of these results for
coral records of river floods are discussed.
Chapter 10 presents analyses of an extended set of trace elements from 4 coastal corals
that experience discharge from 3 different Queensland rivers, and demonstrates the
flood-plume signals, and the anomalous behaviour of barium in two of the corals. Possible
C
hapter
2:
A
n a l y t i c a l
M
e t h o d
2.1 Coral Sample Preparation
2.1.1 Collection
Coral Drilling
Corals analysed during the course of this research were obtained from the Australian
Institute of Marine Science (AIMS) collection. These were drilled in the early 1980s by
P. Isdale, or collected by D. Barnes and J. Lough. For details of the AIMS drilling
equipment, refer to Isdale and Daniel (1989). The corals collected from Davies Reef and
the Whitsundays were drilled by a team from the Research School of Earth Sciences
(RSES) in 1993 and 1995 using drilling equipment designed and built at the department.
The RSES drill is driven using pressurised seawater pumped by a Honda powered
'Davey' twin impeller high-pressure fire-fighting pump. This allows one pump to be
used for powering the drill and flushing the core barrel, and eliminates the need for a
second hose to return hydraulic fluid back to the surface. A significant advantage of this
system is the lack of oil-based hydraulic fluids or lubricants which may contaminate both
the sample and the environment.
Components are largely resistant to corrosion. The reciprocating vane assembly used in
the drill motor is brass and aluminium, the housing is an industrial high-density
polyethylene, and the other componentry is stainless steel. The drill barrels are steel with
an outside diameter of 75 mm and an inside diameter of 55 mm (although an improved
version now has an internal diameter of 76 mm). The drill bit is a modified commercial
design with tungsten carbide teeth. The drill is stabilised on a heavy stainless steel frame
which weighs approximately 55 kg without the drill head (see figure 2.1). The frame is
anchored tightly to the coral by 3 tensioned nylon cargo slings. Drilling proceeds in
stages, and the core is brought to the surface in approximately 1 m sections.
Two parallel cores (about 15 cm apart) were drilled in the Cow and Calf Island coral.
These coral cores were around 2 m in length; however, the system is designed to be able
Schematic of Coral Drilling Rig
Hose to Surface
Nylon Straps to Anchor Frame
Water Powered Drill Motor
Guide Plates
Drill Frame
Valves to Control Speed
Drill Barrel
Drill Head
x
Levelling Screws X
Coral Bommie
Hook
Figure 2.1 Coral Drilling Rig
[image:32.529.16.514.24.653.2]2.1.2 Cutting
Sectioning the Coral
Coral core sections are aligned, marked, and then i split using a diamond-impregnated
glass-cutting blade with fresh water as a coolant. (Cores are supported on alumirium
guttering (rectangular profile 3 mm thick U-bend, 25 x 50 mm), with friction preverting
them from rotating during cutting. During early attempts at splitting, corals vere
embedded in plaster of Paris; however, this practtise was discontinued because of
concerns about strontium contamination.
A 7.0 mm slab is then cut from one half of the split (core using the diamond blade. Slab
thickness is typically uniform to within ± 0.5 mm. SI labs are cleaned in 18 water in
an ultrasonic bath for 30 minutes to remove ciutting debris and soluble suiface
contamination introduced by the saw blade, and air—dried on an absorbent paper tcwel.
Corals obtained from AIMS had already been cut intco 7.0 mm slabs.
Coral slabs are x-rayed and photographed undeer UV light (see next secton).
Chronologies are then determined by counting deensity bands; however, subarnual
density bands may obscure the major seasonal cyccles. Counting dissepiments is not
always reliable, as coral slabs are not always cut perfectly perpendicular to growth
banding. Fluorescent bands, therefore, prove to be tthe most useful tool for establishing
a chronology in coastal corals. The inter-annual variation in fluorescence provides useful
temporal and cross-dating markers (e.g. Isdale anad Parker, 1995), allowing pmallel
cores to be matched, and dates assigned from charactteristic patterns of rainfall.
Once a chronology has been assigned to a core, a ssuitable growth axis for analysis is
identified. This axis is then cut from the slab as a 212 mm wide strip using the diamond
blade. It is often necessary to cut more than one grow th axis from a coral slab in orcer to
maintain a continuous record, as growth axes can rurn off the edge of the core.
The 22 mm strip is next split into 50 mm subsectioms for mounting in the laser ablation
cell (a geometry imposed by the sample cell - see ssection 2.2.2). In order to minimise
sample loss during this sub-sectioning, the coral is cut using a 0.15 mm diamond
wafering blade. The coral strip is not cut completely through, with the sectioning cut
stopping about 1 mm from the face of the coral to bee analysed (see figure 2.2). The coral
is then snapped so that the analytical faces mesh perfectly with each other. In most
cases, the first 1 5 - 2 0 mm of the coral strip is jremoved to avoid the tissue layer.
Subsections are ultrasonicated in 18 MQ water fcor 30 minutes to remove handling
contamination, and air dried on an absorbent paper teowel.
Bulk sampling of corals for solution analysis is carried out by milling strips from
coral is milled from each surface of the sampled region and discarded. Milling is carried
out with a 2.5 mm tungsten carbide bit, and the coral powder is collected on waxed
paper and transferred to acid-cleaned polyethylene vials.
Sectioning Coral
Face of coral to be analysed
Partial cut
0.15 mm diamond watering blade
Coral snapped by hand
Figure 2.2 Sectioning the Coral
When sectioning corals for analysis on the laser, some environmental information may be lost due to the thickness of the cutting blade. To avoid this, the coral samples are cut only part way through, without damaging the surface to be analysed. The coral sections are then snapped so that there is no loss of continuity on the analytical surface. The cut is made using a very fine 0.15 mm diamond wafering blade.
Marking the Coral
To enable precise alignment of coral laser scans and images, it is convenient to have a set
of spatial markers on the coral that can be identified as reference points in images and
analytical runs. In most cases these are natural features of the coral section, such as an
edge, a corner, or a blemish. Some coral sections, however, do not have any easily
recognisable features to measure. In these cases, small notches are carefully cut into the
sides of the coral using a hack-saw.
2.1.3 Imaging
X-Ray
The 7.0 mm coral slabs are X-rayed to produce density images using standard hospital
X-ray equipment. Coral samples are placed on a Kodak single sided emulsion film,
using a Lamex screen, and exposed for 0.08 seconds at 50 mA and 45 kV. Contact
Fluorescence
Coral slabs are photographed under ultraviolet light to obtain images of the fluorescent
flood-banding. The corals are illuminated with two 40 Watt NEC 'Black-light Blue' UV
tubes mounted in standard 40 W fluorescent light brackets. These are raised up on
blocks and arranged so as to cast an even illumination over the surface of the coral (see
figure 2.3). The fluorescent tubes are placed as close to the sample as possible to gain
maximum intensity of fluorescence. Photographs are taken from directly overhead, and
it is often necessary to make a montage of close-up photographs for long sections of
coral. It is necessary to shield upward illumination from the camera to avoid flaring.
Under UV light, the fluorescent lines are distinguished from the blue background
fluorescence of the aragonite by their characteristic yellow/green colour, rather than
marked differences in the intensity of fluorescing light. For the purposes of scanning
and profiling, it is convenient to be dealing with grey-scale images. The distinction
between yellow bands and blue background, however, is greatly reduced when colour is
excluded. The yellow bands are therefore accentuated as much as possible by using a
yellow/orange filter during the photography to remove blue tones, and by controlling the
development and processing to enhance the contrast.
Techniques for UV coral photography were developed by Mr Stewart Hay at 'A N U
Photography'. The camera is a Hasselblad E.L.M ., and the photographs are shot on
black-and-white AGFA APX 25 (120) film, producing 55 mm square negatives. The
filter is a Hasselblad/50 1.5x Y (yellow). Exposures vary somewhat and need to be
assessed from test shots; however, f5.6 for about 4 seconds is about average. The
negatives are processed using Rodinal developer at 1+ 25 at 20°C for 11 minutes,
producing a gamma of 0.75. The tank is agitated for the first minute followed by 4
inversions every 30 seconds. Full size prints are made using a condenser enlarger on
high contrast paper. These settings are summarised in table 2.1.
Scanning
Both X-ray and fluorescent images are scanned into Adobe Photoshop using an AGFA
Arcus II flatbed scanner at a resolution of 200 pixels per inch. Scanner parameters
(brightness, light point, dark point, and gamma) are optimised to ensure maximum
resolution of grey-scale. The images are scanned in 16 bit greyscale, and the levels and
gamma of the image adjusted further in Photoshop to enhance the contrast between light
and dark bands. The images are then reduced to 8 bit grey-scale. Any digital image
filtering to smooth the picture or remove speckles is carried out at this stage, although
i , i • ' s n p t