COGNITIVE PROCESSES AS MEDIATORS OF EMOTION: AN EXPERIMENTAL INVESTIGATION OF THE BASIC THEORETICAL ASSUMPTION OF
COGNITIVE LEARNING THERAPY
F. J. WALSH
A thesis submitted for the degree of Doctor of Philosophy of The Australian National University.
April, 1986.
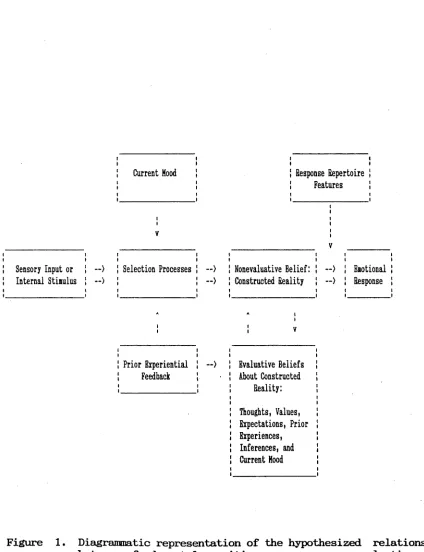
with the cognitions listed above they have also identified more fundamental cognitive processes as being the mechanisms by which these cognitions Eire generated. Researchers have suggested that four classes of cognitive Eu^tivity contribute to the generation of these cognitions. These sure attentional processes, relational processes, response repertoire features, Euid experiential feedback. The relationship between these processes and thoughts, attitudes, belief systems, expectations and assumptions will be examined further in Chapter 4.
2.3 The Interface Between Cognition and Emotion
In the strictest sense the interface between cognition and emotion is undefinable. The nature of this point of contact depends entirely on what is Eiccepted eis cognition and what is accepted as emotion. As has been discussed in the preceeding sections there is a considerable vEiriation in what researchers claim defines cognition and emotion.
their memory functioning. It would be generally accepted that the variables included in these examples are representations of cognitions and emotions respectively.
Current opinion on the interaction of cognition and emotion falls into one of three categories. There are those authors who argue cognition is a sufficient but not necessary cause of emotion, those that contend that cognition is both a sufficient and necessary cause of emotions and there are those that argue that the issue is irrelevant.
The former group have been most recently represented by the extensive arguments put forward by Zajonc and his colleagues who view cognition as a sufficient but not necessary cause of emotional response (Zajonc, 1980, 1984). The central hypothesis of this position is that emotional experience and expression can result from pure sensory input to the brain. Zajonc (1980) postulates that the neuroanatomical structures that are responsible for this transformation from pure sensory input to emotional response include the right hemisphere, the limbic system, and more specifically the hypothalamus. He claims that these structures in the absence of mediation by higher mental processes can bring about a full emotional response. The intriguing question at this stage left unanswered is just how these neural structures transform pure sensory input into emotion.
transformation of sensory input into a meaningful form is said to be a cognitive activity.
Along with researchers from the first two categories the last group recognize that the relationship between cognition and emotion is bidirectional (Gilligan & Bower, 1984; Meichenbaum & Butler, 1980). That is, cognitions can cause changes in emotion and vice versa. Therefore, this group see the debate over primacy as meaningless. There is ample evidence of cognitions influencing emotions (Hale & Strictland, 1976; Lazarus & Alfert, 1964; Lazarus et al, 1962; Lazarus & Launier, 1978; Velten, 1968) and of emotions influencing cognitions (Gilligan & Bower, 1984; Zajonc, 1980) to support this contention. Unfortunately, this does not resolve the basic argument over primacy. The fact that there is little doubt that there can be chain reactions of cognitions influencing emotions and emotions influencing cognitions does not throw any light on the question of whether each emotion in the chain must be preceded by a cognition or whether each cognition in the chain is necessarily preceded by an emotion. The issue then becomes one of the importance of pursuing the primacy question. It will be argued in Chapter 5 that this issue is of some theoretical importance for cognitive learning therapists.
1.4 The Current Research Problem
CHAPTER 3
SELF STATEMENT MOOD INDUCTION RESEARCH
In an attempt to demonstrate that cognitive processes mediate emotions researchers have frequently adopted an experimental strategy involving what have become known as mood induction procedures. The general strategy is to apply a procedure which supposedly activates in subjects the cognitive processes thought to be necessary for generating the emotion in question. The strategy has been used to investigate the resultant mood both as a subjective state and for it’s effect on behaviour (Goodwin & Williams, 1982).
1981; Polivy & Doyle, 1980; Strickland, Hale & Anderson, 1975; Velten, 1968), semantic differential rating scales (Gouaux & Gouaux, 1971; Frost et al, 1979; Natale, 1977) and the Beck depression inventory (Brewer et al, 1980; Finkel, Glass & Merluzzi, 1982; Frost et al, 1979).
In spite of the wide acceptance of the procedure several recent studies have raised doubts about its apparent effectiveness as a mood inducer.
Sutherland et al (1982) reported a significant proportion (32 per cent) of their subjects failed to reach a criterion 10 per cent mood change. Their findings suggest that self statements may not be a reliable mood induction method.
Another recent study failed to establish a relationship between self statement valence and physiological arousal (Rogers & Craighead, 1982). Since most current concepts of emotion (see Izard, Kagan & Zajonc, 1984) include physiological arousal as an essential element this study must bring into question the validity of the self report mood changes documented in the mood induction research.
Still other workers have explored the possibility that the self report mood changes associated with self statement mood induction procedures are in some way due to experimental demand characteristics (Buchwald, Strack & Coyne, 1981; Polivy & Doyle, 1980). These researchers believed that the content of the statements and the experimental instructions would lead subjects to predict the kind of post-induction mood that was expected and that they would be likely to comply with this demand.
These concerns have been sufficient to encourage some researchers to look for improved induction techniques. Autobiographical recollections (Brewer et al, 1980) and personally meaningful music (Sutherland et al, 1982) have both been shown to be superior to the self statement approach (Velten, 1968).
The common element between these two alternative techniques is the personal relevance for the subject of the induction material. In the autobiographical recollections procedure subjects nominated three autobiographical mood-evoking events to be used as mood induction material. In the music procedure subjects were asked to choose from a selection of taped music two pieces that they felt would be capable of influencing their mood. In contrast, the Velten self statements are of a general nature and the procedure does not take into account the personal relevance of the statements for each subject. It has been pointed out that there is a critical difference between saying something to oneself and believing it (Buchwald et al, 1981; Lazarus, Coyne &■ t o l k n A n , 1982). It would follow that something that is personally relevant to the subject is more likely to be experienced as real than something that is not. This proposition is lent some support by the finding that self referent statements were superior mood inducers to nonself referent statements (Sherwood et al, 1981).
constructed reality that is isomorphic with the content of the statements (Lazarus et al, 1982).
It is apparent that the inconsistent findings from mood induction studies, reported earlier, could result from any of three possibilities. The first is that the Velten statements may no longer be adequate mood
induction material. The Velten statements were generated in 1968 and what may have been a socially and culturally acceptable mood statement then may not be as appropriate now. The second and more likely possibility is that the personal relevance of the statements would quite likely depend on prior experience of the statement content and, therefore, be idiosyncratic to individual subjects. In either case it is possible some subjects failed to identify with a significant proportion of the statements; that is, found than unbelievable and did not actually experience the kind of cognitive activity thought to be associated with the particular mood change represented by the statements. The third possibility is that the believability of the mood statements is irrelevant and the mood changes that have been reported are largely due to experimental demand characteristics.
3.1 Experiment 1
The value of the Velten approach to cognitive learning theory was that it seemed to demonstrate in a general way that cognitive processes could mediate emotion. If the inconsistencies in the data can be explained in terms of the differential believability of the mood statements then the general conclusions drawn from the data would be reasonable. However, if the mood changes reported in the self statement mood induction studies are largely artefactual then the claim that this type of research provides empirical support for the cognitive learning theory approach to therapy would obviously be invalid.
Based on the assumption that the believability of the Velten mood induction statements would vary, the present study was designed to test the hypothesis that the believability of the mood statements would influence their effectiveness as mood inducers.
In order to hold the potential for demand characteristics constant across the experimental conditions the mood inductions were carried out in groups. By including subjects from all the experimental conditions in the induction groups and by ensuring all the subjects received the same experimental instructions the possibility of demand characteristics being responsible for any group differences was minimized.
It was hypothesized that the more believable mood statements would be more effective mood inducers than the less believable mood statements and that both the more and less believable mood statements would be superior mood inducers to neutral statements.
3.1.1 Method
Subjects
behavioural science students at the Canberra College of Advanced Education. The subjects had not had any prior contact with the experimental material. The subjects ranged from 18 years to 47 years with a mean age of 25.84 years. There were 33 males and 52 females. The students who took part in the experiment received course credit for participating.
Design
The design was a one-way factorial design with five levels of statement believability (believable elation, unbelievable elation, believable depression, unbelievable depression and neutral).
Materials
Mood induction statements. The 20 most and 20 least believable elation and depression statements, along with 20 neutral statements, from the Velten (1968) experiment were used as mood induction stimuli in this study.
Mood assessment instruments.
Three different types of mood assessment instruments that have been used previously in mood induction research were selected for the current study.1 These were tests of motor speed (Berndt & Bemdt, 1980; Coleman, 1975; Frost et al, 1979; Hale & Strictland, 1976; Natale, 1977, 1978; Teasdale & Rezin, 1978b; Velten, 1968), visual analogue scales (Mathews & Bradley, 1983; Sutherland et al, 1982; Teasdale & Fogarty, 1979; Teasdale, Taylor & Fogarty, 1980; Williams, 1980), and a self report mood scale (Richardson & Taylor, 1982; Robbins, 1980; Teasdale & Rezin, 1978a). The motor speed tests included writing numbers backward from 100 (Velten, 1968), the digit symbol sub test from the Weschler Adult Intelligence Scale (WAIS) (Weschler, 1955) and the letter symbol sub test from the Naylor-Harwood Intelligence Scale (NHAIS) (Naylor & Harwood, 1972). The visual analogue scales were a set of 100 mm lines on which subjects indicated how they were feeling "right now" by placing a mark. The lines were labeled at either end "I am not feeling at all X" and "I am feeling extremely X", where "X" was one of eight (four positive and four negative) commonly used mood adjectives (relaxed, anxious, irritated, calm, frustrated,/ excited and happy). The four
positive and four negative scales were also combined to produce a Visual Analogue Positive Scale (VAPS) and a Visual Analogue Negative Scale (VANS). The self report mood scale was the Profile of Mood States (POMS)(McNair & Lorr, 1964). The POMS consists of six subscales: tension/anxiety, depression, anger/hostility, vigor, fatigue, and confusion and a total mood score (IMS) which is a combination of the six subscales.
Pre-Induction Mood Assessment
The pre-induction mood assessment consisted of two motor speed tests (writing numbers backward from 100 and digit symbol), all eight visual analogue scales and the POMS.
Post-Induction Mood Assessment
The post-induction mood assessment involved writing numbers backward from 100, letter symbol, the eight visual analogue scales and
the POMS.
Procedure
eondition was not available for assignment until all other conditions had been assigned a subject.
The experiment was run in small groups of 10-20 subjects. Each group was comprised of subjects from all five experimental conditions.
Each subject was given a test booklet and a set of mood induction cards. The test booklet contained the experimental instructions and mood assessment instruments.
Subjects were asked to read the initial instructions. After the subjects had read them through the experimenter also read them aloud. The instructions were:
This exercise is part of a research project which is evaluating techniques used to investigate emotions.
The sets of statements you are about to see are used by researchers to artificially induce different mood states. However, before doing the exercise I would like to give you a series of simple tasks to assess your current mood.
In order that the information you provide may remain confidential please d o n ’t write your name on any of the material.
Your participation in this exercise is completely voluntary so if now or at any stage you would rather not take part please feel free to so indicate.
Are there any Questions?
The initial instructions were followed by the pre-induction mood assessment. After completing the pre-induction mood assessment subjects were given the experimental instructions to read. These were also read aloud by the experimenter after the subjects had read them through. The instructions were:
Your task is to read each statement and then try to experience the feeling expressed by the statement.
Statement, and to allow each idea to act on you without interference.
Different people move into moods in different ways. Whatever induces the mood in you fastest and most deeply is the best way for you to use. Some people simply repeat the statements over and over again to themselves with the intention of experiencing them. Other people find it natural and easy to visualize a scene in which they had or would have had such a feeling or thought. Perhaps some easy combination of repeating the statements and imagining scenes will come to you.
As you move through the cards try to concentrate your full attention on experiencing the feeling expressed by each statement. Try to resist the impulse to reject or resist statements that are contradictory to your own opinions or how you currently feel yourself to be. Try to feel the way someone who believed the statement would most likely feel.
There will be a certain amount of time devoted to each statement. Try to use the time to concentrate on experiencing the feeling expressed in that statement. The experimenter will indicate when to move on to the next statement.
Even if some of the statements seem to be a little unusual for this task try to concentrate on them for the full time period.
In summary, the whole purpose of this exercise is to see whether a person can talk themselves into a mood. Some of these mood statements may have no relation to anything you have ever thought, said or done. However, your task is to concentrate on them and try to experience whatever emotion they may represent, rather than comparing each single statement to your life experience and then deciding whether it applies to you.
If you feel the urge to laugh, it will probably be because humour is a good way to counter unwanted feelings. Please try to resist these reactions. Also, because this is a group exercise, please reserve any questions or comments you have until the exercise has been completed.
After the statements have been read there will be a further series of simple exercises to perform.
IF FOR ANY REASON YOU FEEL YOU CANNOT CONTINUE PLEASE FEEL FREE TO STOP TAKING PART.
If possible just sit quietly until the end of the exercise. If this is not possible or desirable please indicate to the experimenter it is necessary for you to withdraw.
Do you have any questions ?
The subjects were allowed 30 seconds to concentrate on each card. The experimenter indicated when the time period for each card had expired by saying "next". After all the cards had been processed for the prescribed'the post-induction mood assessment was completed.
After the post-induction mood assessment had been completed subjects were debriefed which included giving those subjects who had used depression mood induction statements a list of elation statements to read. Care was taken to ensure that subjects were not experiencing any lingering negative mood effects as a result of taking part in the experiment.
3.1.2 Results
The pre-induction and pre- to post-induction mood data were analyzed by separate one-way analyses of variance. The results of these analyses are outlined below.
Pre-Induction Mood Measure
Contrary to expectations there were some pre-induction mood differences between the experimental groups. However, all the significant pre-induction mood differences were between the neutral and the elation, and the neutral and depression induction groups. There were no significant pre-induction mood differences between any of the elation and depression induction groups. The differences that did occur are detailed below for each of the mood measures.
adjective "despondent" 2, F(4,80) = 2.6, p< .05 (see Table 1). Contrasts between the groups showed the neutral group to be significantly different from the believable elation, unbelievable elation, and unbelievable depression groups, t(80) = 2.82, 2.50, 2.54 and p< .006,
.02, .01 respectively.
Table 1
Pre-Induction Visual Analogue Scale Mean Scores for the Five Bxperinental Groups.
Hood Induction Statenent Valence
Visual Analogue Scales Believable Blation Unbelievable Elation Believable Depression Unbelievable
Depression Neutral F Ratio p<* Contrast1
Relaxed 62.5 61.5 54.5 57.8 47.0 1.05 NS
Anxious 31.5 33.3 28.1 32.5 42.2 0.66 NS
Irritated 24.4 24.1 14.5 16.0 32.8 1.48 NS
Cali 68.2 61.7 60.1 63.2 50.5 1.00 NS
Frustrated 32.1 20.9 20.1 19.4 37.4 1.71 NS
Despondent 20.1 23.1 29.8 22.7 45.9 2.62 .04 dij
Bxcited 38.1 25.1 24.1 28.2 33.0 1.06 NS
Happy 53.8 51.5 57.0 55.4 50.4 0.21 NS
VAPS 55.7 49.9 48.9 51.1 45.2 0.52 NS
VANS 27.0 25.3 23.1 22.6 39.6 0.12 NS
* Confidence level for contrasts p< .02 to account for fanilywise error
1 believable elation -v- believable depression = a ; believable elation -v- unbelievable depression = b ; believable elation -v- unbelievable elation = c ; believable elation -v- neutral = d ; believable depression -v- unbelievable depression = e ; believable depression -v- unbelievable elation = f ; believable depression -v- neutral = g ; unbelievable depression -v- unbelievable elation = h ; unbelievable depression -v- neutral = i ; unbelievable elation -v- neutral : j
Profile of Hood States (POMS). A one-way analysis of variance showed a significant between groups effect for the depression, F(4,80) = 4.8, p< .002, anger/hostility, F(4,80) = 4.7, p< .002, and confusion, F (4,80) = 3.1, p< .02, scales (see Table 2). Contrasts between the groups revealed the neutral group to be significantly different from all the other mood induction groups for all three of these scales. That is, there was a significant difference between the neutral group and the believable elation, unbelievable elation, believable depression, and unbelievable depression groups for the depression scale, t(80) = 3.34, 3.38, 3.5, 3.6 and p< .001, .001, .001, .001, the anger/hostility scale, t(80) = 2.02, 2.92, 3.5, 3.8 and p< .05, .005, .001, .0001, and the confusion scale, t(80) = 2.42, 2.57, 3.27, 2.39 and p< .02, .02, .01,
.002 respectively.
Motor speed. A one-way analysis of variance indicated that there were no significant differences between any of the groups on either of the two motor speed tests (see Table 3).
Pre- to Post-Induction Mood Change
Table 2
Pre-Induction POMS Scale Mean Scores for the Five Brperiaental Groups.
Mood Induction Stateaent Valence
POMS Believable Elation Unbelievable Elation Believable Depression Unbelievable
Depression Neutral F Ratio P<‘ Contrast1
Tension/ anxiety
9.2 7.7 8.2 9.2 13.4 1.53 NS
Depression 6.0 5.9 5.5 5.2 15.6 4.79 .002 dgij Anger/
hostility
7.2 4.9 3.4 2.7 12.4 4.66 .002 dgij
Vigor 14.4 11.7 14.4 16.8 13.0 1.37 NS
Fatigue 9.9 10.7 10.1 8.4 12.5 0.72 NS
Confusion 7.2 7.2 6.9 5.8 11.1 3.08 .02 dgij
THS 4.2 4.1 3.3 2.4 8.7 3.66 .009 dgij
* Confidence level for contrasts p( .02 to account for faailywise error.
1 believable elation -v- believable depression = a ; believable elation -v- unbelievable depression = b ; believable elation -v- unbelievable elation = c ; believable elation -v- neutral = d ; believable depression -v- unbelievable depression = e ; believable depression -v- unbelievable elation = f ; believable depression -v- neutral = g ; unbelievable depression -v- unbelievable elation = h ; unbelievable depression -v- neutral = i ; unbelievable elation -v- neutral = j
became less disappointed and a negative mood change score means the subject became more disappointed.
Table 3
Pre-Induction Motor Speed Test Mean Scores for the Five Experiaental Groups.
Mood Induction Stateaent Valence
Motor Speed Believable Unbelievable Believable Unbelievable
Tests Blation Blation Depression Depression Neutral F Ratio p<* * Contrast*
Writing No. 54.4 52.5 52.5 55.1 53.6 0.49 NS
Digit Symbol 60.0 58.1 56.7 59.6 64.1 1.59 NS
1 Confidence level for contrasts p< .02 to account for faailywise error
* believable elation -v- believable depression = a ; believable elation -v- unbelievable depression = b ; believable elation -v- unbelievable elation = c ; believable elation -v- neutral = d ; believable depression -v- unbelievable depression = e ; believable depression -v- unbelievable elation = f ; believable depression -v- neutral = g ; unbelievable depression -v- unbelievable elation = h ; unbelievable depression -v- neutral = i ; unbelievable elation -v- neutral = j
V i s u a l a n a l o g u e s c a l e s . A o n e - w a y a n a l y s i s o f v a r i a n c e o f t h e
c h a n g e s c o r e s s h o w e d s i g n i f i c a n t b e t w e e n g r o u p s e f f e c t s f o r f i v e s c a l e s .
T h e s e w e r e r e l a x e d , F ( 4 , 8 0 ) = p < . 0 0 6 , i r r i t a t e d , F ( 4 , 8 0 ) = 3 . 3 , p < . 0 1 ,
h a p p y , F ( 4 , 8 0 ) = 2 . 9 , p < . 0 3 , V A P S , F ( 4 , 8 0 ) = 2 . 6 , p < . 0 5 , a n d V ANS,
F ( 4 . 8 0 ) = 3 . 0 , p < . 0 2 ( s e e T a b l e 4 ) . C o n t r a s t s b e t w e e n t h e g r o u p s
i n d i c a t e d t h e p a t t e r n o f g r o u p d i f f e r e n c e s v a r i e d a c r o s s t h e d i f f e r e n t
m o o d s c a l e s w i t h t h e g e n e r a l p i c t u r e b e i n g s o m e d i f f e r e n c e s b e t w e e n t h e
e l a t i o n a n d d e p r e s s i o n g r o u p s a n d a l s o b e t w e e n t h e s e g r o u p s a n d t h e
n e u t r a l g r o u p . H o w e v e r , t h e r e w a s n o c o n s i s t e n c y w i t h i n t h i s p a t t e r n .
F o r t h e r e l a x e d s c a l e t h e u n b e l i e v a b l e d e p r e s s i o n g r o u p w a s
s i g n i f i c a n t l y d i f f e r e n t f r o m t h e b e l i e v a b l e e l a t i o n , u n b e l i e v a b l e
e l a t i o n , b e l i e v a b l e d e p r e s s i o n , a n d n e u t r a l g r o u p s , t ( 8 0 ) = 2 . 4 1 , 3 . 4 3 ,
3 . 3 9 , 2 . 6 7 a n d p < . 0 2 , . 0 0 1 , . 0 0 1 , . 0 0 9 . F o r t h e i r r i t a t e d s c a l e t h e
b e l i e v a b l e e l a t i o n g r o u p w a s s i g n i f i c a n t l y d i f f e r e n t f r o m t h e
Table 4
Pre- to Post-Induction Visual Analogue Scale Mean Change Scores for the Five Experinental Groups
Mood Induction Stateaent Valence
Visual Analogue Scales Believable Elation Unbelievable Elation Believable Depression Unbelievable
Depression Neutral F Ratio P<* Contrast1
Relaxed 0.5 8.1 7.8 -17.5 2.4 3.94 .006 behi
Aniious 4.2 7.5 -2.3 -12.2 -5.2 1.97 NS
Irritated -2.7 3.3 -12.2 -26.7 -22.0 3.32 .01 bhj
Call -0.4 8.9 2.3 -11.8 -4.6 1.13 NS
Frustrated 3.1 0.4 -7.9 -16.2 -13.9 1.56 NS
Despondent 0.4 0.3 -12.2 -10.1 2.6 1.32 NS
Excited 10.7 11.5 -5.6 0.2 -0.2 1.60 NS
Happy 5.9 1.0 -21.0 -7.1 -5.1 2.91 .03 af
VAPS 4.2 7.4 -4.1 -9.0 -1.9 2.45 .05 h
VANS 1.3 2.9 -8.7 -16.3 -9.6 3.00 .02 bh
J Confidence level for contrasts p( .02 to account for faailywise error
k believable elation -v- believable depression = a ; believable elation -v- unbelievable depression = b ; believable elation -v- unbelievable elation = c ; believable elation -v- neutral = d ; believable depression -v- unbelievable depression : e ; believable depression -v- unbelievable elation = f ; believable depression -v- neutral : g ; unbelievable depression -v- unbelievable elation = h ; unbelievable depression -v- neutral = i ; unbelievable elation -v- neutral = j
the unbelievable depression group was significantly different from both the believable and unbelievable elation groups, t(80) = 2.68, 2.9 and p<
.009, .004 respectively.
Table 5
Pre- to Post-Induction POMS Mean Change Scores for the Five Bxperiaental Groups
Mood Induction Stateaent Valence
POMS Believable Blation Unbelievable Blation Believable Depression Unbelievable
Depression Neutral F Ratio p<> Contrast1
Tension/ anxiety
2.1 1.8 -0.4 -1.5 0.5 1.46 NS
Depression 0.2 2.0 -6.5 -4.3 3.5 4.01 .005 fgi
Anger/ hostility
0.06 1.1 -2.5 -4.0 1.5 2.13 NS
Vigor 0.7 2.2 -5.9 -5.7 0.2 7.44 .0001 abfghi
Fatigue 2.1 3.3 -2.3 -1.5 3.2 3.65 .009 fghi
Confusion 1.7 2.2 -2.7 -1.9 1.3 4.05 .005 abfgh
■ms 1.1 2.1 -3.4 -3.2 1.7 5.32 .0008 abfghi
J Confidence level for contrasts p( .02 to account for fanilyvise error
‘ believable elation -v- believable depression = a ; believable elation -v- unbelievable depression = b ; believable elation -v- unbelievable elation = c ; believable elation -v- neutral = d ; believable depression -v- unbelievable depression = e ; believable depression -v- unbelievable elation = f ; believable depression -v- neutral : g ; unbelievable depression -v- unbelievable elation = h ; unbelievable depression -v- neutral = i ; unbelievable elation -v- neutral = j
scale the believable and unbelievable depression scales were significantly different from the believable elation, unbelievable elation, and neutral groups, t(80) = 2.70, 3.30, 3.04 and p< .008, .001, .003 and t(80) = 2.58, 3.17, 2.92 and p< .01, .002, .005 respectively.
Table 6
Pre- to Post-Induction Motor Speed Test Mean Change Scores for the Five Bxperiaental Groups
Mood Induction Stateaent Valence
Motor Speed
Tests
Believable
Elation
Unbelievable Elation
Believable Depression
Unbelievable
Depression Neutral F Ratio p<‘ Contrast*
Writing No. 3.4 3.8 2.4 3.1 4.4 .04 NS
D/L Syabol -1.7 -0.2 0.7 0.1 -1.4 0.55 NS
1 Confidence level for contrasts j>< .02 to account for faailywise error
* believable elation -v- believable depression = a ; believable elation -v- unbelievable depression = b ; believable elation -v- unbelievable elation = c ; believable elation -v- neutral = d ; believable depression -v- unbelievable depression = e ; believable depression -v- unbelievable elation = f ; believable depression -v- neutral = g ; unbelievable depression -v- unbelievable elation = h ; unbelievable depression -v- neutral = i ; unbelievable elation -v- neutral : j
3 . 1 . 3 D i s c u s s i o n
T h e r e s u l t s f r o m t h i s s t u d y f a i l e d t o s u p p o r t t h e m a j o r h y p o t h e s i s
t h a t t h e s t a t e m e n t s t h a t h a d b e e n r a t e d a s m o r e b e l i e v a b l e w o u l d b e m o r e
e f f e c t i v e m o o d i n d u c e r s t h a n t h e s t a t e m e n t s t h a t h a d b e e n r a t e d a s l e s s
b e l i e v a b l e . T h e s e c o n d h y p o t h e s i s t h a t a l l t h e m o o d i n d u c t i o n s t a t e m e n t s
w o u l d b e s u p e r i o r m o o d i n d u c e r s t o t h e n e u t r a l s t a t e m e n t s w a s s u p p o r t e d .
T h e r e s u l t s f r o m t h e b e l i e v a b i l i t y r a t i n g o f t h e V e l t e n s t a t e m e n t s ( s e e
A p p e n d i x A - l ) s h o w e d t h e h i g h a n d l o w r a t i n g g r o u p s o f s t a t e m e n t s f r o m
b o t h t h e e l a t i o n a n d d e p r e s s i o n m o o d i n d u c t i o n s t a t e m e n t s e t s w e r e
s i g n i f i c a n t l y d i f f e r e n t i n t e r m s o f t h e i r b e l i e v a b i l i t y . T h i s
s i g n i f i c a n t d i f f e r e n c e b e t w e e n t h e t w o s e t s o f e l a t i o n s t a t e m e n t s a n d
t h e t w o s e t s o f d e p r e s s i o n s t a t e m e n t s / c o n f i r m e d t h e a s s u m p t i o n t h a t t h e
s t a t e m e n t s b e l i e v a b i l i t y v a r i e s f o r e x p e r i m e n t a l s u b j e c t s . T h e s e
mood induction procedure itself will be expanded below.
It is apparent from the significant difference between the elation and depression groups’ mood change on both the visual analogue scales and the POMS (see Table 4 and 5), that both the sets of elation statements generated a more elated a * \ d fAtft both the sets of
00*41*4+4?/ /X oL&/>r'€-SSG0l 5 6// /'Cfzcn-boM *^6cc>l *3^f><zcdiuedi^ depression statements/ However, there was no consistent pattern of results across the different sets of elation and depression statements. The believable f 'f - f - e c 4 / ^<Z a s / n c e o f t'n 0 tu c e r 'S .
iasv\ U tsf 5 / - t c f & s y n -/<?✓» 5 e <?/ /"/h? m c x o d 's c a le s A That is <x*~0{ f e d ies'ofh-ert n c c c t *zcaJe<!.
there was a difference between the elation and depression statement sets but the different sets of elation and the different sets of depression statements themselves did not have a differential impact on mood (see Tables 4, 5, and 6).
The data is also supportive of previous findings about the procedure itself. The reliability of the self referent mood induction procedure had been questioned by a study that showed it was inconsistent as a mood inducer across individual subjects (Sutherland et al, 1982). The inconsistent findings for the effectiveness of the different statement sets in this study must be seen as further evidence for questioning the reliability of this mood induction procedure.
Also, the failure to find an effect of mood induction on psychomotor functioning as measured by the motor speed tests, would appear to support the findings of Rogers and Craighead (1982). They queried the validity of the self reported mood changes attributed to self referent statement mood inductions after failing to find a relationship between self statement valence and physiological arousal.
mood. Since the purpose of this study was to compare the effectiveness of subsets of statements, the reduced effectiveness of smaller statement sets could not be avoided. Hale and Strictland (1976) also failed to find a differential effect of mood induction on symbol copying. It is possible the symbol tests which are more complex tasks than writing numbers are not sufficiently sensitive to register the level of mood change associated with self referent statement mood inductions.
It can be concluded that the results from this study are consistent with the general pattern of results from those previous studies that have used a Velten style mood induction procedure. There appears to be a between groups effect for subjective (self report) mood change measures for the elation and depression induction conditions and less convincing evidence in terms of objective mood change measures (psychomotor functioning). In addition to finding a similar pattern of results to the previous studies, in this study the believability of the mood induction statements did not appear to influence their effectiveness as mood inducers.
subject.
3.2 Experiment 2
There is no evidence from Experiment 1 to support the view that mood induction statements are intrinsically more or less believable for mood induction subjects. However, if the believability of the statements was determined by prior experience of the individual statement content or some other idiosyncratic variable, then the believability of the statements could also be idiosyncratic to each individual subject.
The current experiment was designed to test this proposition. It was hypothesized that there would be a differential mood change between the believable elation and unbelievable elation, and the believable depression and unbelievable depression mood induction groups when subject assignment to these groups was based on the each subject’s own ratings of the statements’ believability rather than on the statements prior believability evaluation. The previously rated statement sets were also retained for this study in order that the results could be checked against those of Experiment 1.
3.2.1 Method
Subjects
participating.
Design
The experimental design was the same as that used in Experiment 1.
Materials
Hie mood induction statements and mood measures were the same as those used in Experiment 1. However, the visual analogue scales were revised and extended. Three of the adjectives were replaced and two additional ones were added. "Despondent" was replaced with "disappointed" because some of the subjects in Experiment 1 were unfamiliar with the adjective "despondent", "anxious" and "calm" were replaced with "tense" and "lighthearted", and "discouraged" and "pleased" were added to give a better coverage of nonclinical mood states.
A seven point scale was added to measure how believable the induction statements were to each individual subject. The details of this scale are outlined below.
Procedure
The procedure and instructions were the same as those used in Experiment 1. However, after the post-induction mood assessment was completed subjects rated the believability of each of the statements
they had used on a seven point rating scale. Subjects were given the following instructions to read. After subjects read than through they
were also read aloud by the experimenter. The instructions were: Your task now is to read each statement again and to rate how believable it was for you as a mood induction statement.
For example, if you thought the statement:
w as e x t r e m e l y b e l i e v a b l e ( i . e . i t i s b e l i e v a b l e t o i m a g i n e t h e s t a t e m e n t e a s i l y a p p l y i n g t o y o u ) t h e n y o u w o u ld r a t e i t els f o l l o w s :
extreiely soaewhat soaewhat extreaely
believable believable believable neither unbelievable unbelievable unbelievable
H o w e v e r, i f y o u t h o u g h t i t w a s a n e x t r e m e l y u n b e l i e v a b l e m ood s t a t e m e n t ( i . e . i t i s u n b e l i e v a b l e t o i m a g i n e t h e s t a t e m e n t e a s i l y a p p l y i n g t o y o u ) t h e n y o u w o u ld r a t e i t :
eitreaely soaewhat soaewhat extreaely
believable believable believable neither unbelievable unbelievable unbelievable
I f y o u r e a l l y c a n n o t d e c i d e how b e l i e v a b l e / u n b e l i e v a b l e i t w as
els a mood s t a t e m e n t t h e n y o u w o u ld r a t e i t :
1 2 3
<P
5 6 7extreaely soaewhat soaewhat extreaely
believable believable believable neither unbelievable unbelievable unbelievable
I f t h e r e i s n ’ t a w o rd t h a t e x a c t l y r e p r e s e n t s how y o u w o u ld r a t e t h e s t a t e m e n t c i r c l e t h e n u m b e r a b o v e t h e w o rd t h a t i s c l o s e s t t o y o u r e v a l u a t i o n .
T h e r e a r e n o r i g h t o r w ro n g r e s p o n s e s t o t h e s e s t a t e m e n t s , b u t i t i s i m p o r t a n t y o u a n s w e r a s t r u t h f u l l y a n d a s a c c u r a t e l y els
y o u c a n .
M ake s u r e you respond to a l l the statements ELnd only circle
one number for each statement.
R em em ber, y o u r t a s k i s t o r a t e how b e l i e v a b l e t h e s t a t e m e n t s w e r e f o r y o u a s m ood i n d u c t i o n s t a t e m e n t s n o t how w e l l t h e s t a t e m e n t d e s c r i b e s y o u r c u r r e n t f e e l i n g .
A f t e r c o m p l e t i n g t h i s t a s k t h e s u b j e c t s w e r e d e b r i e f e d w h ic h
i n c l u d e d g i v i n g t h o s e s u b j e c t s who h a d u s e d d e p r e s s i o n m ood s t a t e m e n t s a
l i s t o f e l a t i o n s t a t e m e n t s t o r e s u i . C a re wels t a k e n t o e n s u r e t h a t s u b j e c t s d i d n o t l e a v e t h e e x p e r i m e n t w h i l e e x p e r i e n c i n g a n y
3.2.2 Results
The mean statement believability ratings were calculated for each of the statement sets and these were compared to the previous ratings (see Appendix A-l for original ratings). The rating data indicated that the statements are not consistently believable or unbelievable across individual subjects. Therefore, subjects'own ratings were used to assign the subjects to groups that found the statements believable or unbelievable. The pre-induction and pre- to post-induction mood data were again analyzed by separate one-way analyses of variance. This was done first for groups based on the original statement sets and second for groups based on each subject’s own statement believability ratings. These data are presented below.
Statement Analysis
When the original believability ratings of the statement sets (see Appendix A-l) are compared to the ratings by subjects in this experiment there are considerable differences. The believable elation and depression sets receive similar ratings by both groups of subjects. In the original evaluation subjects discriminated between the believable and unbelievable elation, and between the believable and unbelievable depression sets. However, in this experiment subjects did not distinguish between the two elation statement sets. Also, the difference in the ratings between the two depression statement sets by subjects in this experiment is reduced, with the unbelievable statement set being seen as more believable in the present study.
statement believability score. A median split was used to reassign subjects to either believable or unbelievable statement groups. The same procedure was followed for the depression groups. The average believability ratings of statements in these reassigned groups were calculated. The mean believability ratings for the believable and unbelievable elation and depression groups were then similar to the original statement ratings (see Table 7).
The mood data w e ^ analyzed first for groups based on the original statement sets and second for groups based on subjects* own statement ratings.
Table 7
Hean Believability Ratings for Hood Induction Stateaents by Set and Rater
Stateaent Sets
Stateaent Rating
Believable Elation
Unbelievable Blation
Neutral Unbelievable Depression
Believable Depression
Original 2.9 3.9 - 4.2 3.1
Current 3.0 3.1 3.5 3.8 3.0
Reassigned 2.4 3.8 3.5 4.3 2.5
Mood Scores of Groups Based on Original Statement Sets
Pre-Induction Mood Measure
Again contrary to expectations there were some minor pre-induction mood differences between the experimental groups. These are outlined below for each of the mood measures.
p< .0 4 ( s e e T a b l e 8 ) . C o n t r a s t s b e t w e e n t h e g r o u p s r e v e a l e d t h a t t h e
n e u t r a l g r o u p w a s s i g n i f i c a n t l y l e s s h a p p y t h a n t h e u n b e l i e v a b l e e l a t i o n
g r o u p , t ( 9 2 ) = 2 . 8 8 , p< . 0 0 5 . T h e r e w e r e n o s i g n i f i c a n t d i f f e r e n c e s
b e t w e e n t h e g r o u p s f o r a n y o f t h e o t h e r i n d i v i d u a l s c a l e s o r t h e tw o
c o m b in e d s c a l e s VAPS a n d VANS.
Table 8
Expedient 2 Pre-Induction Visual Analogue Scale Mean Scores for the Five Experiaental Groups Based on Original Ratings
Visual Analogue Scales
Mood Induction Statenent Valence
F Ratio p(* Contrast1 Believable Blation Unbelievable Blation Believable Depression Unbelievable Depression Neutral
Pleased 54.5 59.4 53.2 59.0 46.9 1.25 NS
Relaxed 46.3 50.4 53.4 59.1 48.3 0.72 NS
Tense 48.5 46.7 45.9 39.9 51.0 0.43 NS
Irritated 30.1 21.8 23.0 30.1 31.8 0.58 NS
Lighthearted 43.2 58.8 38.5 50.8 45.1 1.77 NS
Frustrated 33.3 31.0 34.6 31.4 39.6 0.24 NS
Disappointed 28.9 28.6 25.7 20.9 28.7 0.32 NS
Excited 31.2 48.2 28.5 31.8 32.2 2.14 NS
Happy 53.7 67.7 53.9 63.3 46.1 2.59 .04 j
Discouraged 37.2 30.3 29.5 29.4 37.9 0.38 NS
VAPS 46.0 56.9 45.5 52.8 43.7 2.18 NS
VANS 64.3 68.3 68.3 69.6 62.2 0.40 NS
1 Confidence level for contrasts j>< .02
[image:63.541.50.499.220.638.2]Profile of Mood States (POMS). A one-way analysis of variance showed that there were no significant between group differences for any of the POMS scales (see Table 9).
Table 9
Biperiient 2 Pre-Induction POMS Scale Kean Scores for the Five Bxperiaental Groups Based on Original Ratings
POMS
Hood Induction Stateaent Valence
F Ratio p(J Contrast* Believable Blation Unbelievable Elation Believable Depression Unbelievable Depression Neutral
Tension/ 11.3 9.2 9.4 9.1 12.8 1.14 NS
aniiety
Depression 10.1 8.3 9.1 11.6 13.5 0.72 NS
Anger/ 6.7 7.0 4.9 5.9 7.4 0.34 NS
hostility
Vigor 12.1 15.4 12.1 14.3 13.2 0.69 NS
Fatigue 9.6 9.7 10.1 13.9 11.4 1.16 NS
Confusion 11.2 9.2 9.7 10.6 12.4 1.25 NS
TMS 36.8 27.9 31.1 36.7 44.3 0.63 NS
1 Confidence level for contrasts p( .02
* believable elation -v- believable depression = a ; believable elation -v- unbelievable depression = b ; believable elation -v- unbelievable elation = c ; believable elation -v- neutral = d ; believable depression -v- unbelievable depression = e ; believable depression -v- unbelievable elation = f ; believable depression -v- neutral = g ; unbelievable depression -v- unbelievable elation = h ; unbelievable depression -v- neutral = i ; unbelievable elation -v- neutral = j
.002 respectively. There was no significant 3.11 and p< .02, .02,
between groups effect for the writing numbers test.
Table 10
Bxperiient 2 Pre-Induction Motor Speed Test Mean Scores for the Five Bxperiiental Groups Based on Original Eatings
Hood Induction Stateient Valence
Motor Speed Believable Unbelievable Believable Unbelievable
Tests Elation Blation Depression Depression Neutral F Ratio p(* Contrast* 1
Writing Ho. 52.2 54.0 52.7 51.5 54.5 0.44 HS
Digit Syabol 65.9 62.3 59.2 66.3 67.9 3.12 .02 g
1 Confidence level for contrasts p< .02
k believable elation -v- believable depression = a ; believable elation -v- unbelievable depression = b ; believable elation -v- unbelievable elation = c ; believable elation -v- neutral = d ; believable depression -v- unbelievable depression = e ; believable depression -v- unbelievable elation = f ; believable depression -v- neutral = g ; unbelievable depression -v- unbelievable elation : h ; unbelievable depression -v- neutral = i ; unbelievable elation -v- neutral = j
Pre- to Post-Induction Mood Change
Mood change scores were calculated in the same way as in Experiment 1. Hie results are similar to those obtained in Experiment 1. There were substantial differences between the elation groups and the depression and neutral groups. There were no differences between the believable and unbelievable elation groups nor between the believable and unbelievable depression groups. These results are detailed below for each of the mood measures.
[image:65.541.50.503.150.376.2]3.67, 5.78, 3.53, 3.86, 6.92 and p< .0006, .007, .03, .008, .0003, .01, .006, .0001 respectively (see Table 11). Contrasts between the groups showed the believable and unbelievable elation groups were significantly different from the believable and unbelievable depression groups on the relaxed scale, t(92) - 3.03, 3.13 and p< .003, .002 and t(92) - 3.45, 3.54 and p< .001, .001 respectively, and the happy scale, t(92) = 3.19, 3.76 and p< .002, .001 and t(92) = 2.98, 3.55 and p< .004, .001 respectively. The unbelievable elation group was significantly different from the believable and unbelievable depression groups on the discouraged scale, t(92) = 3.14, 2.9 and p< .002, .005 respectively, and the disappointed scale, t(92) = 2.37, 2.73 and p< .02, .008 respectively, and the unbelievable depression and neutral group on the relaxed scale, t(92) = 2.92, 3.28 and p< .004, .001 respectively. The believable elation group was significantly different from the believable and unbelievable depression groups and the neutral group on the excited scale, t(92) = 3.31, 3.19, 2.7 and p< .001, .002, .008 respectively. All of the differences were in the hypothesized direction. For the VAPS the believable and unbelievable elation groups were significantly different from the believable and unbelievable depression groups and the neutral group, t(92) = 2.86, 3.88, 2.6 and p< .005, .001, .01 and t(92) = 3.03, 4.04, 2.78 and p< .003, .001, .007 respectively. For the VANS the unbelievable elation group weis significantly different from the believable and unbelievable depression and the neutral group, t(92) =
3.01, 3.04, 2.36 and p< .003, .003, .02 respectively.
Table 11
Bxperiient 2 Pre-to Post Induction Visual Analogue Scale Mean Change Scores for the Five Experiiental Groups Based on Original Eatings
Mood Induction Stateient Valence
Visual Analogue Scales Believable Elation Unbelievable Elation Believable Depression Unbelievable
Depression Neutral F Ratio P<* Contrast1
Pleased 7.2 10.4 -16.3 -17.7 -3.5 5.45 .0006 abfh Relaxed 6.3 13.2 -2.1 -8.1 -10.1 3.75 .007 hj
Tense 8.9 15.2 4.5 -2.0 0.1 1.45 NS
Irritated -0.1 6.7 -12.3 -8.7 -9.4 1.48 NS Lighthearted 3.1 5.8 3.7 -12.8 -11.6 2.07 NS
Frustrated 9.2 8.0 -5.8 -8.1 -1.9 1.41 NS
Disappointed 4.1 8.7 -11.9 -16.1 -6.3 2.75 .03 h
Bicited 23.3 6.6 -4.8 -4.4 0.4 3.67 .008 abd
Happy 9.0 7.8 -13.4 -18.1 -1.8 5.78 .0003 abfh Discouraged 6.8 15.3 -13.8 -12.8 -2.0 3.53 .01 fh
VAPS 7.7 8.8 -6.6 -12.2 -5.3 6.58 .0001 abdfhj
VANS 5.8 10.8 -7.9 -8.6 -3.9 3.76 .007 fhj
* Confidence level for contrasts p< .02 to account for faailyvise error
k believable elation -v- believable depression = a ; believable elation -v- unbelievable depression = b ; believable elation -v- unbelievable elation = c ; believable elation -v- neutral = d ; believable depression -v- unbelievable depression = e ; believable depression -v- unbelievable elation = f ; believable depression -v- neutral = g ; unbelievable depression -v- unbelievable elation = h ; unbelievable depression -v- neutral = i ; unbelievable elation -v- neutral = j
depression was significantly different from the unbelievable elation group, t(92) = 2.87, p< .005. For the vigor scale the believable and unbelievable elation groups were significant different from the believable and unbelievable depression and the neutral groups, t(92) = 4.22, 4.19, 2.92 and p< .001, .001, .004 and t(92) = 3.6, 3.59, 2.32 and p< .001, .001, .02 respectively. For the fatigue scale the unbelievable elation group was significantly different from the believable and unbelievable depression groups, t(92) = 2.92, 2.76 and p< .004, .007 respectively. For the TMS scale the believable elation group was significantly different from the unbelievable depression group, t(92) = 2.84, p< .006 and the unbelievable elation group was significantly different from the believable and unbelievable depression and neutral groups, t(92) = 3.12, 3.92, 2.39 and p< .002, .001, .02 respectively.
Motor speed. A one-way analysis of variance showed a significant between groups difference for the change score of the symbol tests, F(4,91) = 3.99, p< .005 (see Table 13). Contrasts showed the unbelievable depression group to be significantly different from the believable elation, unbelievable elation, believable depression, and neutral groups, t(92) = 2.81, 3.18, 3.69, 2.64 and p< .006, .002, .001, .01 respectively. There was no between groups effect for the writing numbers test.
Mood Scores of Groups Based on Subjects Own Believability Ratings
Pre-Induction Mood Measure
Again there were some minor pre-induction mood differences between the experimental groups. These are outlined below for each of the mood measures.
Table 12
Bxperiient 2 Pre-to Post-Induction POMS Scale Mean Change Scores for the Five Biperiiental Groups Based on Original Ratings
Mood Induction Statenent Valence
POMS Believable Blation Unbelievable Blation Believable Depression Unbelievable
Depression Neutral F Ratio p<» Contrast1
Tension/ 1.3 4.3 1.0 -0.9 0.6 2.14 NS
anxietj
Depression 1.2 3.9 -3.4 -4.9 1.9 4.21 .004 fhi
Anger/ 0.2 2.3 0.9 -3.2 -1.0 2.17 NS
hostility
Vigor 4.3 3.1 -4.2 -4.4 -1.6 7.89 .0001 abdfhj
Fatigue 0.4 3.4 -1.7 -1.6 -0.4 2.75 .03 fh
Confusion 2.1 1.9 -0.1 0.2 -0.5 2.07 NS
IMS 9.3 18.9 -7.5 -14.8 -1.1 4.93 .001 bfh
1 Confidence level for contrasts p< .02 to account for faailywise error
k believable elation -v- believable depression = a ; believable elation -v- unbelievable depression = b ; believable elation -v- unbelievable elation = c ; believable elation -v- neutral = d ; believable depression -v- unbelievable depression ; e ; believable depression -v- unbelievable elation : f ; believable depression -v- neutral = g ; unbelievable depression -v- unbelievable elation = h ; unbelievable depression -v- neutral = i ; unbelievable elation -v- neutral : j
significant between groups effect for the happy scale, F(4,92) = 2.77, p< .03 (see Table 14). Contrasts between the groups revealed that the believable elation and unbelievable depression groups were significantly different from the neutral group, t(92) = 2.53, 2.7 and p< .01, .008 respectively.
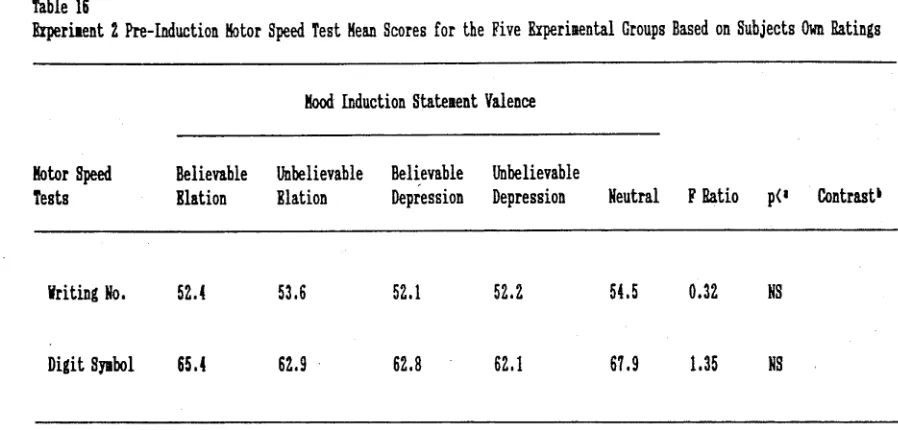
Motor speed. A one-way analysis of variance showed there were no significant main effects for the writing numbers or digit symbol tests
(see Table 16).
Table 13
Expedient 2 Pre-to Post-Induction Motor Speed Test Mean Change Scores for the Five Experiaental Groups Based on Original Ratings
Mood Induction Stateaent Valence
Motor Speed Tests
Believable Elation
Unbelievable Elation
Believable Depression
Unbelievable
Depression Neutral F Ratio p<» Contrastk
Writing No. 3.2 5.1 1.3 3.2 2.2 1.08 NS
Digit Synbol -4.0 -3.4 -2.7 -8.3 -4.3 3.99 .005 behi
1 Confidence level for contrasts p< .02 to account for faailywise error
Table 14
Eiperiaent 2 Pre-Induction Visual Analogue Scale Hean Scores for the Five Erperiuental Groups Based on Subjects Ratings
Hood Induction Stateuent Valence
Visual Analogue Scales
Believable Elation
Unbelievable Elation
Believable Depression
Unbelievable
Depression Neutral F Ratio P<* Contrast1
Pleased 57.7 56.1 53.2 58.6 46.9 1.09 NS
Relazed 45.2 51.5 53.3 58.9 48.3 0.81 NS
Tense 51.1 44.2 50.9 35.1 51.0 1.29 NS
Irritated 24.3 27.6 30.7 21.9 31.8 0.47 NS Lighthearted 52.9 49.0 40.9 47.8 45.1 0.55 NS Frustrated 26.9 38.0 44.8 21.3 39.6 2.06 NS Disappointed 28.7 28.8 29.9 17.0 28.7 0.84 NS
Excited 42.2 37.2 35.1 24.9 32.2 1.36 NS
Happy 65.0 56.3 50.4 66.3 46.1 2.77 .03 di
Discouraged 27.9 39.6 40.7 18.2 37.9 2.06 NS
VAPS 52.6 50.1 46.6 51.3 43.7 0.89 NS
VANS 68.2 64.4 60.6 77.3 62.2 1.90 NS
Confidence level for contrasts p< .02 to account for faailyvise error
[image:71.541.67.496.93.474.2]Table 15
Experiment 2 Pre-Induction POHS Scale Mean Scores for the Five Experimental Groups Based on Subjects Own Ratings
Mood Induction Statement Valence
POHS
Believable Elation
Unbelievable Elation
Believable Depression
Unbelievable
Depression Neutral F Ratio P<* Contrast1
Tension/ anxiety
11.0 9.6 12.0 6.5 12.8 2.72 .03 ei
Depression 9.3 9.1 13.6 6.9 13.5 1.47 NS
Anger/ h o s tility
6.2 7.5 6.4 4.4 7.4 0.52 NS
Vigor 14.1 13.3 11.7 14.6 13.2 0.39 NS
Fatigue 10.1 9.2 12.1 11.7 11.4 0.54 NS
Confusion 9.9 10.5 11.5 8.7 12.4 1.58 NS
TKS 32.4 32.5 43.8 23.6 44.3 1.24 NS
1 Confidence level for contrasts p< .02 to account for familywise error
Table 16
Experiment 2 Pre-Induction Motor Speed Test Hean Scores for the Five Experiaental Groups Based on Subjects Own Ratings
Mood Induction Stateient Valence
Motor Speed Believable Unbelievable Believable Unbelievable
Tests Blation Elation Depression Depression Neutral F Ratio p<a Contrast* 1
Writing No. 52.4 53.6 52.1 52.2 54.5 0.32 NS
Digit Syabol 65.4 62.9 62.8 62.1 67.9 1.35 NS
1 Confidence level for contrasts p( .02 to account for faailyvise error
k believable elation -v- believable depression = a ; believable elation -v- unbelievable depression = b ; believable elation -v- unbelievable elation ^ c ; believable elation -v- neutral = d ; believable depression -v- unbelievable depression = e ; believable depression -v- unbelievable elation = f ; believable depression -v- neutral = g ; unbelievable depression -v- unbelievable elation = h ; unbelievable depression -v- neutral = i ; unbelievable elation -v- neutral = j
P r e - t o P o s t - I n d u c t i o n M o o d C h a n g e
M o o d c h a n g e s c o r e s w e r e c a l c u l a t e d i n t h e s a m e w a y a s i n E x p e r i m e n t
1 . T h e b e l i e v a b l e e l a t i o n g r o u p ’ s m o o d c h a n g e w a s c o n s i s t e n t l y g r e a t e r
t h a n t h e u n b e l i e v a b l e e l a t i o n g r o u p a n d s i g n i f i c a n t l y d i f f e r e n t t o b o t h
t h e b e l i e v a b l e a n d u n b e l i e v a b l e d e p r e s s i o n g r o u p s a n d t h e n e u t r a l g r o u p .
T h e u n b e l i e v a b l e d e p r e s s i o n g r o u p t e n d e d t o b e a m o r e e f f e c t i v e m o o d
i n d u c e r t h a n t h e b e l i e v a b l e d e p r e s s i o n g r o u p . T h e d i f f e r e n c e b e t w e e n t h e
d e p r e s s i o n g r o u p s a n d t h e n e u t r a l g r o u p w h i l e i n t h e h y p o t h e s i z e d
d i r e c t i o n , t e n d e d n o t t o r e a c h s i g n i f i c a n c e . T h e s e r e s u l t s a r e d e t a i l e d
b e l o w f o r e a c h o f t h e m o o d m e a s u r e s .
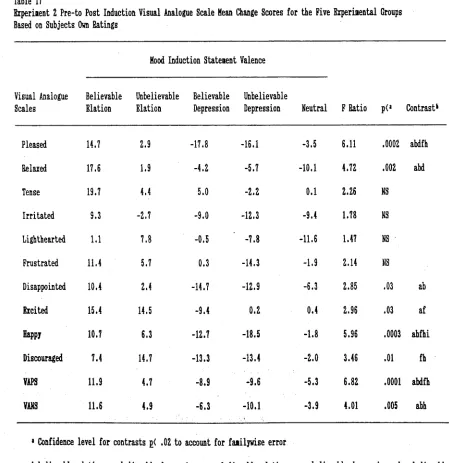
V i s u a l a n a l o g u e s c a l e s . A o n e - w a y a n a l y s i s o f v a r i a n c e r e v e a l e d a
s i g n i f i c a n t b e t w e e n g r o u p s e f f e c t f o r s i x i n d i v i d u a l s c a l e s a n d t h e t w o
[image:73.541.49.498.95.310.2]happy, discouraged, VAPS and VANS scales, F(4,92) = 6.11, 4.72, 2.85, 2.96, 5.96, 3.46, 6.82, 4.01 and p< .0002, .002, .03, .02, .0003, .01, .0001, .005 respectively (see Table 17). Contrasts between the groups showed for the pleased scale the believable elation group was significantly different from the believable and unbelievable depression and neutral groups, t(92) = 4.19, 3.97, 2.37 and g< .001, .001, .02 respectively and the unbelievable elation group was significantly different from the believable and unbelievable depression groups, t(92)
b e l i e v a b l e a n d u n b e l i e v a b l e d e p r e s s i o n g r o u p s , t ( 9 2 ) = 2 . 7 1 , 2 . 8 4 a n d p<
. 0 0 8 , .0 0 6 r e s p e c t i v e l y . F o r t h e VANS t h e b e l i e v a b l e e l a t i o n g r o u p w as
s i g n i f i c a n t l y d i f f e r e n t f r o m t h e b e l i e v a b l e a n d u n b e l i e v a b l e d e p r e s s i o n
a n d n e u t r a l g r o u p s , t ( 9 2 ) = 2 . 8 7 , 3 . 4 7 , 2 . 5 1 a n d p ( 9 2 ) = . 0 0 5 , . 0 0 1 ,
.0 1 r e s p e c t i v e l y a n d t h e u n b e l i e v a b l e e l a t i o n g r o u p w a s s i g n i f i c a n t l y
d i f f e r e n t f r o m t h e u n b e l i e v a b l e d e p r e s s i o n g r o u p , t ( 9 2 ) = 2 . 3 8 , . 0 2 .
Table 17
Experiment 2 Pre-to Post Induction Visual Analogue Scale Mean Change Scores for the Five Experiaental Groups Based on Subjects Own Ratings
Hood Induction Stateaent Valence
Visual Analogue Scales Believable Elation Unbelievable Elation Believable Depression Unbelievable
Depression Neutral F Ratio P<J Contrast*
Pleased 14.7 2.9 -17.8 -16.1 -3.5 6.11 .0002 abdfh
Relaxed 17.6 1.9 -4.2 -5.7 -10.1 4.72 .002 abd
Tense 19.7 4.4 5.0 -2.2 0.1 2.26 NS
Irritated 9.3 -2.7 -9.0 -12.3 -9.4 1.78 NS
Lighthearted 1.1 7.8 -0.5 -7.8 -11.6 1.47 NS
Frustrated 11.4 5.7 0.3 -14.3 -1.9 2.14 NS
Disappointed 10.4 2.4 -14.7 -12.9 -6.3 2.85 .03 ab
Excited 15.4 14.5 -9.4 0.2 0.4 2.96 .03 af
Happy 10.7 6.3 -12.7 -18.5 -1.8 5.96 .0003 abfhi
Discouraged 7.4 14.7 -13.3 -13.4 -2.0 3.46 .01 fh
VAPS 11.9 4.7 -8.9 -9.6 -5.3 6.82 .0001 abdfh
VARS 11.6 4.9 -6.3 -10.1 -3.9 4.01 .005 abh
1 Confidence level for contrasts p< .02 to account for faailywise error
[image:75.541.51.500.203.666.2]