by
Fulgence K. Byamugisha, B.Sc (Hons) Agric.
A sub-thesis submitted in partial fulfilment of the requirements for the degree of Master of Agricultural Development
Economics at the Australian National University
Except where otherwise indicated, this sub-thesis is my
work.
Fulgence K. Byamugisha
ACKNOWLEDGEMENTS
This study is my humble contribution to the rehabilitation of the
Ugandan economy; with determination and a common goal, we shall rebuild
Uganda, the pearl of Africa.
My principal intellectual debts are owed to my supervisor Dr. Peter
Drysdale, Reader in the Faculty of Economics and Director of the Australia,
Japan and Western Pacific Economic Relations Project, and to Dr. Ross
Garnaut, Research Fellow in the Department of Economics of the Research
School of Pacific Studies. I will never forget Peter's academic guidance
in this piece of work; he really gave all the effort a supervisor possibly
could. My intellectual debt to Ross Garnaut is very great: his
macro-economic policy model became utterly indispensable to the development of
piy work and his early encouragement was much appreciated.
Dr. Kym Anderson and Dr. Anne Booth, both of the Department of
Economics of the Research School of Pacific Studies have also been very
helpful - Kym by giving me tips on Ugandan data contained in international
publications, and Anne by enabling me access to literature on the
rehabilitation of the Indonesian economy following the fall of the Sukarno
government; I am most thankful.
I owe my interest in macro-economics to Professor Wolfgang Kasper
of the Department of Economics, Faculty of Military Studies, Royal Military
College, Duntroon and to his practical oriented and most stimulating
lectures. The books, articles and seminars of Professor Max Corden of the
Department of Economics, Research School of Pacific Studies have been a
Of course I cannot forget the academic staff of the Development Studies Centre. They have helped to keep my morale throughout. I am also grateful to Tony Vale of the Australian Department of Foreign Affairs for his immediate delivery of the report by the Commonwealth team of
/ experts on the rehabilitation of the Ugandan economy after the fall of
Amin's government.
Bridget Boucher, Daphne Boucher, Jennie Colman and Peter Waddell-Wood did a good job in the editing and typing of this thesis; my reserved thanks go to these ladies and the gentleman.
Last but not least, I am most grateful to both the Makerere
University Staff Development Program, which gave me the opportunity to take up this degree course, and to the Australian Government which offered the scholarship.
A B S T R A C T
The purpose of this study is to devise an approach to macro-economic policy in the reconstruction of the Ugandan economy. The study
analyses Ugandan economic performance in the major sectors of
CONTENTS
Page
ACKNOWLEDGEMENTS i ü
ABSTRACT v
LIST OF TABLES ix
LIST OF FIGURES xi
LIST OF APPENDICES xii
DEFINITIONS AND ABBREVIATIONS xiii
CHAPTER
1 INTRODUCTION 1
1.1 The Ugandan Economy 2
1.2 Economic Performance, 1960-78 2
1.3 The Liberation War, Looting and the Ruined Economy 6
1.4 Purpose and Outline of the Study 8
1.5 Data Availability and Problems 10
2 THE DETERIORATION OF UGANDA'S ECONOMY 12
2.1 The Markets 12
The .Money Market 13
The Commodity Market 20
The Foreign Exchange Market 25
The Labour Market 28
2.2 The Production Sectors 31
2.2.1 The Agricultural Sector 31
2.2.2 The Industrial Sector 48
2.3 The Balance of Payments, 1961-79 51
2.4 A Summary and Plan of Action 54
3 INTERNAL AND EXTERNAL BALANCE: THEORY AND RELEVANCE 56.
3.1 Internal and External Balance in Developed
Economies: The Swan-Corden Model 57
3.2 Internal and External Balance in Developing
CHAPTER Page
3.2.1 Description of Sectors 61
3.2.2 Internal and External Balance 63
3.2.3 The Model in the Ugandan Context 71
3.3 Dynamic Factors and the Adjustment Mechanism of
the Internal-External Balance 73
3.4 Uganda's Internal-External Balance, 1964-76:
Evidence of a Shift 75
3.5 Productivity, Real Wage and Employment 80
3.5.1 Static Analysis 83
3.5.2 Dynamic Analysis 83
•4 INTERNAL AND EXTERNAL BALANCE: POLICY IMPLICATIONS 90
4.1 Internal and External Balance Diagram: The
Position of the Ugandan Economy 90
4.2 The Move to Simultaneous Internal and External
Balance 92
4.3 Restoration of the Production Capacity 92
4.4 Developing the Production Potential 94
4.5 Towards a Consistent Economic Policy 94
4.6 Policy Targets and a Policy Calendar 95
5 STABILISATION POLICY 99
5.1 The Approach 99
5.2 Prige-Level Stability (Anti-Inflation) 101
5.2.1 Fiscal Policy 102
5.2.2 Monetary Policy 109
5.3 Full Employment 111
5.3.1 Wage-Fixing (Incomes Policy) 112
5.3.2 Reducing Frictions in the Labour Market 113
5.4 External Balance 114
5.4.1 The Current Account or Absorption-Switching
Approach 115
5.4.2 External Balance with Allowance for Capital
Flows 120
6 REHABILITATION AND DEVELOPMENT 121
CHAPTER Page
The Rehabilitation Strategy 122
The Key Areas for Rehabilitation 124
6.2 Development 125
The Development Strategy 125
The Long-Term Strategy for Macro-Economic
Stabilisation 128
7 SUMMARY AND CONCLUSION 130
* * *
APPENDICES 135
Table 1.1 1.2 2.1 2.2 2.3 2. 4 2.5 2.6 2.7 2.8 2.9 2.10 2.11 2.12 2.13 2.14 2.15 2.16 2.17 2.18 2.19 2.20
LIST OF TABLES
Uganda: Trends in Key Economic Indicators, 1960-78
Total Gross Capital Formation, in Purchasers' Values in Absolute (Current and 1970 Prices) and Relative Terms, 1960-76
Causes of Changes in Money Supply, 1961-79
Money Supply and Price Level, 1960-79
Budgetary Operations of the Central Government From 1972/73 to 1978/79
Selected Kampala Official and Free Market Prices, May 1979
Values and Indices of Nominal and Real Exchange Rates of Uganda Shilling Per Unit of SDR
Estimates of Production, All Uganda Coffee, 1975/76 -1977/78
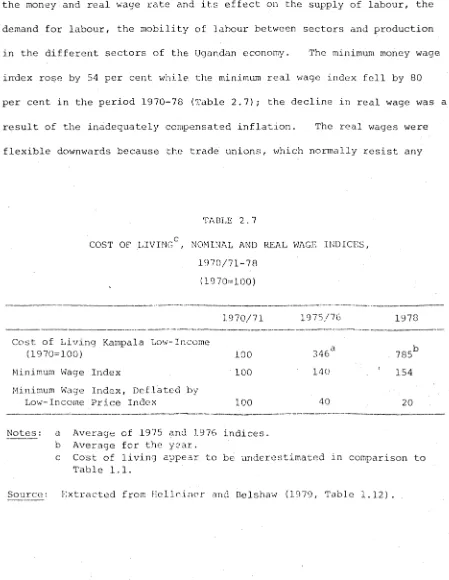
Cost of Living, Nominal and Real Wage Indices, 1970/71-78
Total and Per Capita Agricultural Production Indices, 1967-75
Production of Selected Primary Products 1970, 1975 and 1978
Uganda's Export Performance in Volume, Value, Price and Terms of Trade Indices, 1967-76
Real Returns From Legal Cash Crop Sales and From Urban-Wage Earning
Distribution of Coffee Crop Value (%), Uganda 1972/73 - 1977/78
Average Producer Prices for Coffee - Uganda, Kenya and Tanzania, 1974-79
Tobacco and Sugar Export Values, 1967-75
Sugar, Tobacco and Rice Production Indices, 1967-78
Imports of Manufactured Fertilisers and Insecticides, 1967-75
Dairy Farms, Cattle and Milk Production, 1970-74
Livestock Population Indices, 1967-75
Livestock Production Indices, 1967-75
Subsistence Crop Production Indices, 1967-75
Table Page
2.21 Output of Selected Manufactures: 1970, 1975, 1977-78 49
2.22 Mineral Production, 1970-77 50
2.23 A Summary of the Components of Uganda's Balance of
Payments, 1967-77 52
4.1 Major Economic Objectives and Performance (Actual and
Planned) of the Ugandan Economy, 1950-86 96
5.1 Changes in the Relative Importance of Different Taxes
in the Period 1971/72 - 1977/78 104
5.2 Money Supply and Government Spending in Nominal and
Real Terms, 1961 - March 1979 107
CHARTS
LIST OF FIGURES
Figure Page
2.1 The Commodity Market 23
3.1 Internal and External Balance 58
3.2 The Determinants of Internal Balance 65
3.3 Internal Balance 65
3.4 The Determinants of External Balance 67
3.5 External Balance 67
3.6 Simultaneous Internal and External Balance 69
3.7 Internal and External Balance: Adjustment to
Productivity Decline 76
3.8 Internal and External Balance: Adjustment to
Productivity Decline (Showing Zones) 77
3.9 Uganda: Internal-External Balance, 1964 to 1976 78
3.10 Productivity, Real Wage and Employment: Static
Analysis 84
3.11 Productivity, Real Wage and Employment: Dynamic
LIST OF APPENDICES
Appendix Table Page
1 Budgetary Operations of the Central Government
From 1961/62 to 1978/79 135
2 Values of Nominal Exchange Rate of Uganda
Shilling Per Unit of SDR and U.S. Dollar,
1970-78 136
3 Exports and Imports of Uganda: Value (Shs.
Million), and Volume and Price Indices, and
Terms of Trade, 1960-76 137
4 The Balance of Payments Account 138
5 Uganda: Changes in GDP Growth Rates and
International Reserves, 1964-76 139
6 Real GDP, Changes in International Reserves,
and Their Proportions, 1961-76 140
7 Results of a Regression of Changes in Prices
to Changes in Money Supply and Inflationary
DEFINITIONS AND ABBREVIATIONS
U.Shs.
Bayaye
Uganda shillings. There are 100 units (cents) in one
Uganda shilling.
1 U.S. dollar = U.Shs.7.47 (March 1980)
Unless otherwise stated, shillings (Shs.) will be used for Uganda shillings (U.Shs.)
A Ugandan term used to refer to the urban-unemployed ruffians.
Magendo
BPC
CPI
ERSF
A Ugandan term used to refer to the lucrative but illegal economic activities characterised by blackmarketeering and smuggling.
Budget Priorities Committee
Consumer Price Index
External Revenue Stabilisation Fund
FAO
GATT
GDP
IBRD
ILO
IMF
LDCs
OECD
UN
UNCTAD
Food and Agricultural Organisation
General Agreement on Tariffs and Trade
Gross Domestic Product
International Bank for Reconstruction and Development. Also known as the World Bank
International Labour Organisation
International Monetary Fund
Less Developed Countries
Organisation for Economic Co-operation and Development
United Nations
United Nations Conference on Trade and Development
Uganda has undergone dramatic change in its political, social and
economic life over the past nine years. On the political scene, President
Idi Amin and his military regime emerged in a military coup, in 1971, that
overthrew Obote's civilian government which had ruled Uganda since
independence. After eight years of political and economic misery under
the Amin regime, Uganda was liberated by the Tanzanian army assisted by
Ugandan exiles in April 1979.
The decade of economic prosperity in Uganda, 1960-70, was ruined
by the following eight-year rule of Amin; this period was characterised by
very low standards of living emanating from negative economic growth, run
away inflation with its redistributive evils and a chronic balance of
payments deficit (Table 1.1). The economic misery was deepened by the
liberation war and consequent looting which left Uganda in a situation not
dissimilar to that of Western Europe after the second world war. There
is now an enormous task of rehabilitation.
This study will focus narrowly on one aspect of this rehabilitation
the macro-economic policy aspect of the economic rehabilitation. A frame
work will be set out within which the objectives of internal and external
balance can be achieved. The aim, therefore, is to set out an appropriate
framework for analysing the macro-economic stabilisation problems in the
rehabilitation of the Ugandan economy and to highlight the critical policy
1.1 The Ugandan Economy
Uganda is a land-locked country, 240,000 sq.km, in size,
straddling the equator. Its population, estimated at 13 million in 1979,
is growing at about 3 per cent a year, and about 93 per cent of the
population live in rural areas (Helleiner and Belshaw, 1979, p.25). Its
economy is predominantly agricultural, based largely on coffee, cotton
and tea as major exports. Agriculture not only provides a livelihood
for about 90 per cent of the people but also contributes 60 per cent of
the gross domestic product (GDP) and at least 85 per cent of the country's
export earnings.
1.2 Economic Performance, 1960-78
Table 1.1 provides a summary of the movements of some important
economic indicators in the Ugandan economy. From the table, there is a
very distinct time trend in performance: 1960-70 is characterised by good
economic performance while 1970-78 is characterised by extremely poor
performance.
The Prosperous Decade, 1960-70
Every economic indicator in the table shows that the decade
1960-70 was, on average, a prosperous decade. Real GDP at factor cost
(1966 prices) grew at an average rate of 5.3 per cent a year from Shs.4736
Million in 1960 to Shs.7268 Million in 1970.^ This record growth compares
favourably with the 3 per cent of the previous decade, 1950-60. Favourable
as well is the 2.4 per cent per capita real GDP growth rate per year for
the decade 1960-70 compared to 0.4 per cent for the previous decade, 1950-60.
Economic growth during the decade 1960-70 was backed by a substantial
[image:15.546.40.517.29.577.2]W M rH W 'j l d d d 4) I J ? C § £ 2
^ M • H Oj w
5 .5 S £ §
TJ W X Q< E TJ in x 8. 5
3 <D II H - o O
O C I"'
> M Q>
0) • c p in o
rH x h
d to »h > — rH
§ 5 V rH TJ O O C r - > M O'
d • c P in c
H r -H
fTj CO r-i > w ^ •H
d <d x 2 e u o; „ i d s
CD 0*
£
c J 0}
d X 4-» d
•H Oh
04 — d X
U 4J —
M o
d M CU Ü
d d öJ —
d x dp
U 4 J
-X o Q) n
04 O
5 . **
d in
X x
0 io H — n o
iD o» C x) X x »-h m cm »h tt o i n o i n m o o o O m o co r " i n o cm O cm
I CM rH rH I I Tf I - - H I I I rH
c M i n m x r H o ^ o x x m r r x x
r ^ c o o o O r H r H O m r ^ i O i o ^ r m
rH r-H rH rH f-H rH r-H
0 O O 0 O 0 0 0 0 O 0 0 0 O 0 O
s mi n r - COi n 0CM 0 0 i nvX CMX) m 7
m CO mTT
0 0 i n x> CMO
1
9
6
3
.
L.1 0 00 CO CO 0 CO m
rH X) CO X) O
f N c o ^ r r H r ^ T T ^ o c o o r H i o r ^ i n
x r ^ x o x x o o x o o r ^ x x
O 0 O 0 O 0 O O O O O O O O 0 0 0
CO
i n 0CM O CM rHrH r -CM CM CM g
rH
X O CMX So
CM i
CM X CMX CO
rH CM mrH mrH m ^3* r -rH X X rHCM CMCM O g X XCM s
x>
X (N s CO XX X 7 O rHm rH Om 7 CO 7 XX m
rH rH CM CM r r X
m o <r> cm m m x o i n cm m m
I i l l
rH x co ^
r-m rH CM o cm _ x>
O r H C s i m o o o m
r H CO r H O
^rH
flJ
T f r H i n o m o i n m c o i N O i N r H
7 , i
i D O < N ( N i o o r H o o r ^ f N i o o r ^ r H
m r H O r H O i n r ^ o c T ' ^ r o o ^tc n
r ^ i n r ^ r H n j r r r H C M T r i n ^ r i n m m
^ • m i n x x x r - r - r - r - r - r ^
o ^ i n x r - x o C ' H C M m ^ r m x i ^ x o
x x x x x x x r ^ r ^ r - r ^ s r ^ r ' - r - r - r * *
0 0 0 0 0“' 0 0 0 0 0 0 0 0 0 0 0 0
rH rH rH rH rH rH rH rH rH rH rH rH rH rH rH rH rH
X)Q
T o
r r in O cm m
O m m
m m o
O O O
X c - r
-1 1 1
O O O
m x
0 0 0
'c d
x in rH
03 d **H >i
C rH •
d 03 in c c o> 0 *H u a E in
X in P
d d 0 4-» in E : 4J o c
E d
O T5 M M CD (D 144 rn Uh
d Uh
T 3 X «X
d O
4-» m
d 0) E
rH 4J 0
P 03 in
U M uh
d x d U 4-' M 3 d
rH 0
P M > M O ' d <D x c -h X 4) rt O P 0)
c w C C p •H d d
c c: g
O Cn X 4) rc X M U)
d or CD t> 4H > 10 CO X.
X § 5
o S
ri4 0
O E M
r- 0 O
0 u rH T3
o c
T3 X d
fö w a
d Q
0 ^ 0
r- 4)
1 m c
O -H x in o d in
rH 4 J d
03 *H - E U
C H c
iß D (D I in 4J o d in
m -H
o - in
rH in c
d o
m in u
0 d c
UH U -H
in m d
d d xi
X JP C 4J >,
M o «T3 E £ rH O 3 fTJ M
0 d
M C -C
C *-< H
>, in
m d d u
> *H
o ^
C 4J
d
d x u u
4j in
P 4-> u X «3 ^ - d rH
T3 M 0 d rj T3
i>“4 **H
XI M
U 4J -H X CJ rH
d M rH
d x 2:
M 4J
<0 ^ 0 0 D d M
U O C
m in
m • d
W 44 P
in rH C 0 «T3 -H ( J > 44 4J M
. UH -H o
in -rH 3 44
d - x u 44 o in ai 03 ns r - 44 u ,
E I C M
•H r-H d 0 44 O d P 4 in o x i x
in
>- V4 03 TS
m o x : c
X o TJ
a rH o
•H
d
a
c d a
•h m in in Q d
E O ro 44 o x :
•H M X3 M 44
rH rJ o »H
a» t o d a 10 m
M -r4 j z e d o
&l l«4 H H ßi [l4
»TJ X3 U T5 d Uh
u in
rX -H > ,
O E d
5 g l
M O P
fl U w •*
d d in
>H - d Uh Cxj p - o 2 in
2 h in
D PI -H
d
-• - -• n r - in in M r - p D «J O O
P E »H -H
in E M in p - m -rH in in >
in -H
P •• 44 in
0 tf w u
•H U -H *r|
M -H 44 44
m m io in
> UH 44 -H < i n 4J
- 03
in m d 4J U O T3 CO
•H Uh 03
44 M rH
in c h oj •H O -H
44 -H rH U
03 in 03 C
44 w c 03
t/) -H o C E -H -H 44 E -M ti-,
C 0 03 1 u £ 7 a o d c
0 *H 44 o
rH E C -M
d o M 44
> C 03 d 0 Uh c Q U 0 M
W d
n M 44
c - o c
d M
T3 - 03 Ch 03 r * d JE
M M rH
H o
rH - - d 2 O rH - 5 O X
in o 03 U •» H H
•H in
44 d -
-in P IN O •h in . r -44 in rH o d *H 0 rH
44 > —
to in
d •5 7 d 0 '5 e d c
in o m
UH 44 - H d
0 § !a E
^ 0 > 0
o u cm
o u - o
X < d U T3
" d T5 W C
C -H C 03
d d d c
K C O d M
0 D U d
- - H - H c
q 44 I m - H
< d uh d
H 2 d < r H
2 Uh d Uh d
5 0 T3 0 X
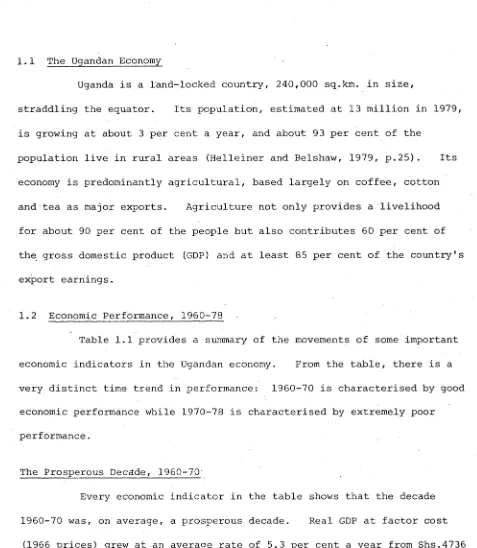
investment: in general, total real capital formation never fell below 12 per cent of real GDP (Table 1.2). Food production too was fairly good; it. grew at an average annual rate of 3.6 per cent (1 per cent per capita growth rate) during the period 1961-70.
TABLE 1.2
TOTAL GROSS CAPITAL FORMATION, IN PURCHASERS'
VALUES IN ABSOLUTE (CURRENT AMD 1970 PRICES) /AND RELATIVE TERMS, 1960-76 (Shs. Million)
Date Grossa Fixed C a p i t a 1 (Nominal)
Increase*3 in Stocks (Nominal)
Total*3 Gross Capital Formation
(Nominal)
C . P . I .
(1970-100)
1b
Total Gross Capital Formation
(Real)
b Total Gross Capital as % of Real GDP
1960 538 -56 4 82 66 7 30 12.5
196 3 686 36 72 2 66 1094 21.9
1965 886 -29 857 84 1020 14.3
1969 1188 2 34 1422 91 1563 17.7
19 70 1161 100 1261 100 1261 14.1
19 71 1696 16 171 2 115 1489 16.1
19 72 1315 -77 .1 2 38 111 11J 5 12.0
19 73 1001 61 1062 1.39 764 8. 3
19 74 1571 140 1711 231 74 1 8.0
19 75 1541 171 1712 2 78 616 6.8
1 9 76 1209 322 1531 431 355 3.9
Notes : a Values are in current prices.
b Values are in 1970 prices for capital as well as G D P . For GDP, the values were changed from 1966 prices in Appendix Table 6, to 1970 prices.
[image:17.546.44.514.117.813.2]The 5.3 per cent growth rate in GDP during the decade 1960-70
was accompanied by a 3.8 per cent growth rate in exports and a 2.8 per cent
growth rate in imports. The balance of payments picture was also strong:
there were additions to the international reserves at least for the period
1965-70."*“ Prices were reasonably stable; inflation averaged 3.4 per cent
2 per year for the period 1960-70.
The prosperity of the decade 1960-70 should not be exaggerated;
in fact it was only modest. It only becomes spectacular when it is
compared to the performance of the period 1970-78.
The Decade of Poor Performance, 1970-78
The period 1970-78 showed an extremely poor performance in
relative and absolute terms: in relative terms, it had the poorest
performance since independence; in absolute terms, growth rates were
negative in this period. The poor performance can only be appreciated
after examining Table 1.1. In the period 1970-76, real GDP grew at an
average rate of -0.3 per cent a year (per capita growth rate of -3.5 per
cent) compared to 5.3 per cent for the period 1960-70. There is every
indication that economic growth did not improve in the two years after
1976 (Chapter 2). The decline in economic growth was backed by a decline
in investment: in 1976, total real capital formation was 3.9 per cent of
real GDP compared to 17.7 per cent in 1969 (Table 1.2). Food production
declined as well; it grew at an average rate of 1.2 per cent (-1.7 per cent
1 The period 1961-64 was characterised by deficits in the balance of
payments. The deficits, however, were caused by the unusually high
capital outflows rather than a poor performance on the current account; the current account had, in fact, substantial surpluses (Table 2.23).
2 The IMF (1979) estimates inflation to have averaged 4.5 per cent per
per capita growth rate) a year in the period 1970-76 compared to 3.6
per cent for the period 1961-70. There is no evidence to suggest that
food production improved in the two years after 1976.
External trade was not sheltered from the general economic
deterioration: exports grew at an average rate of -5.8 per cent per year
and imports at -10.6 per cent per year in the period 1970-76. There is
every indication that export volumes declined even further in the two
years after 1976 (Chapter 2). However, the export earnings rose from
Shs.1772 Million in 1970 to Shs.3002 Million in 1976 because of the rise
in export prices of 129 per cent (Appendix Table 3).^ Nevertheless the
period recorded very substantial balance of payments deficits during 1971,
1973 and 1974. Perhaps the most dramatic change was with the price
level: while inflation averaged 3.4 per cent per year in the period
1960-70, it averaged 105 per cent per year in the period 1971-78.
In brief, the Ugandan economy experienced a negative growth, a
very unfavourable balance of payments and severe inflation during 1970-78
in contrast to the period 1960-70 which was characterised by steady
economic growth, favourable balance of payments and stable prices.
1.3 The Liberation War, Looting and the Ruined Economy
The Liberation War
Tanzania, backed by a small force of Ugandan exiles, invaded
Uganda at the beginning of November 1978, apparently in response to
continuous attacks made by Ugandan forces on Tanzania's Kagera salient.
On 11 April, 1979 the capital Kampala was overwhelmed and liberated and
1 The import prices rose even higher with a rise of 188 per cent, causing
the entire country occupied by Tanzanian and Uganda National Liberation
Front (UNLF) forces. The damage inflicted on Uganda's economy by the war
is well summarised by the Commonwealth team of experts which visited
Uganda after the war:
"Much of Uganda has indeed been badly damaged by the
fighting... The battle front moved across the
country from the Tanzanian border, halting temporarily
near Mbarara, to the frontier with Sudan. Several
towns were almost completely devastated by artillery or aerial bombardment (or a combination of the two). In others, like Kampala, a proportion of houses,
factories and public buildings was gutted or partially destroyed" (Commonwealth Secretariat, 1979a, p.l).
Looting
During and immediately after the war, the breakdown of law and
order opened the way for looting. Its effect on the economy is well
summarised by the Commonwealth team of experts' report:
"After the fighting came looting; at first in selective reprisal against the supporters of the former regime, then spreading like an epidemic. The public hospitals lost almost all their beds. Not only were food, clothes and furniture
appropriated from shops and houses, and tools from workshops; any objects which were immobile or valueless to the looters such as laboratory
equipment, were smashed. Thousands of cars and
lorries were stolen" (Commonwealth Secretariat, 1979a, p.l).
Stent, a member of the Commonwealth team of experts which visited Uganda
after the war emphasizes that looting caused more damage than did the war
itself (1979a, p.13). However, the Commonwealth team reports that the
war and looting were not the main problem; the problem was the shattered
economy they succeeded (Commonwealth Secretariat, 1979a, p.l).
The Ruined Economy
of the ruins of Amin's economic mismanagement, the destruction by war and
the final destruction by looters. The economic situation is best
described by the Commonwealth team of experts' report:
"There are shops closed or with practically nothing to sell, queues, workshops deserted or short of equipment, crop land abandoned, pot holes and
corrugations in the roads, factories without materials
or machinery. Magendo is widespread.-*- If one
wants to describe the current scene to somebody who has not been there in recent weeks, an obvious
parallel would be Europe and South East Asia in mid-1945" (Commonwealth Secretariat, 1979a, p.l).
Inflation was running at 150-200 per cent per year during the period
1971-79, according to the claims of the UNLF government (Africa Research
2
Bulletin, 1979, p.5087c). By March 1979, foreign exchange reserves
amounted in real terms to only about ten days of imports at 1971 volumes
(Shs.154 Million); this ran side by side an external debt of Shs.900
Million - about five times the value of reserves (Helleiner and Belshaw,
1979, p.34).
1.4 Purpose and Outline of the Study
The immediate challenge posed by the grave economic situation of
Uganda is the reconstruction of the economy - to put right what has been
destroyed. One aspect of this challenge requires the formulation of
appropriate macro-economic policies to support the effort at economic
1 Magendo is a Ugandan slogan used to refer to the lucrative but illegal
economic activities characterised by black marketeering and smuggling.
2 The estimate of 150-200 per cent of Uganda's inflation is based on
controlled and blackmarket prices. In fact it is a very rough
estimation but may not be far from the truth. The inflation figure
arrived at by the international economic institutions like IMF is about
105 per bent per year for the period 1971-78. It is this latter
rehabilitation. The major macro-economic policy objectives which are the
focus of this study are the achievement of:
(i) adequate economic growth;
(ii) high levels of employment;
(iii) steady expansion of aggregate demand;
(iv) reasonable stability in the price level;
(v) external balance; and
(vi) an equitable distribution of income and
wealth between persons and regions.
These objectives relate closely to the achievement of adequate economic *
growth supported by a steady expansion of aggregate demand and an
equitable distribution of income and wealth between persons and regions.
This study will attempt to suggest the means of attaining the
above policy objectives through the use of a framework within which the
objectives of internal and external balance are met. Both theoretical and
empirical analyses will be used in the development of the argument. The
main aims of the study are:
(i) to'trace the trends of economic events in Uganda
up to the point of rehabilitation, and to
identify the possible causes of these trends;
(ii) to develop a framework, centred on the
achievement of internal and external balance
objectives, through which to identify the
policies and policy measures most appropriate
for the rehabilitation of the Ugandan economy;
(iii) to specify policy objectives and targets, and
of alternative policy measures (and their
instruments) for each policy objective based
on realistic criteria; and
(iv) to draw out the relation of stabilisation
measures to the rehabilitation and development
of the Ugandan economy.
Chapter 2 traces the trends of economic events in the Ugandan economy up to
the point of rehabilitation, and explores their possible causes; Chapter 3
evaluates the internal and external balance theory, sets out a framework
which is centred on the achievement of internal and external balance
objectives, and applies this framework to the macro-economic stabilisation
problems of the Ugandan economy; Chapter 4 uses the framework to derive
major economic policy measures to achieve the major policy objectives;
Chapter 5 discusses the stabilisation policy while Chapter 6 relates the
stabilisation policy to rehabilitation and development strategy; and
Chapter 7 provides a summary and conclusion of the study.
1.5 Data Availability and Problems
This study uses only secondary data for lack of primary data.
Even so, the quality of the secondary data is not particularly good. The
production and trade statistics of Uganda hardly go beyond 1976, and their
quality is questionable for the period 1971-79; for example, official
statistics exclude blackmarket and smuggling activities which were pre
dominant in the second half of the decade 1970-80.
The author extracted much information from the report of the
study conducted by the Commonwealth team of experts on Uganda after the
by International Agencies, namely, FAO, GATT, IBRD, ILO, IMF, OECD, UN and
UNCTAD.'*’ Some data too have been extracted from Uganda's three five year
development plans since independence, some ministry annual reports, and
Uganda's 1971 Statistical Abstract.
In this study, 1970 has been chosen as a basis for time series
comparisons. This is not to suggest that 1970 was a stable and ideal
year; however, it was a critical turning point between the prosperous
decade, 1960-70, and the period 1971-79 of economic mismanagement by the
Amin regime.
CHAPTER 2
THE DETERIORATION OF UGANDA'S ECONOMY, 1971-79
Whereas the previous chapter provided an introduction to the
performance of the Ugandan economy in the past two decades, this chapter
intends to go deeper into the subject but with major emphasis on the
performance during the period 1970-79. There are three parts to the
argument. The first part is devoted to the assessment of the principal
markets in the economy, namely, the money market, the commodity market,
the foreign exchange market and the labour market.^- The second part
concentrates on assessing the performance of the major production sectors
of the economy, namely, the agricultural sector and the industrial sector.
The third part assesses the performance in external trade through the
balance of payments account. Finally a summary is provided to link this
chapter with the next chapter. Throughout, emphasis is laid on tracing
the trend of economic events and identifying the possible determinants of
the trend. The product of this analysis is a necessary background to
policy analysis and evolving strategies for economic rehabilitation and
development in subsequent chapters.
2.1 The Markets
The principal markets in the Ugandan economy are the money market,
the commodity market, the labour market and the foreign exchange market.
During the seventies, the money market experienced rapid growth in money
supply which got transmitted to the commodity market in the form of run-away
1 The bond market is not included in the market analysis because it is
inflation; the labour market experienced an excess demand for labour and
the foreign exchange market an excess demand for foreign exchange.
The Money Market
The money market experienced a radical and rapid growth of money
supply during the seventies; radical in the sense that the growth of money
supply diverted substantially from its trend of the sixties, and rapid in
that it outstripped immensely the growth in economic activities approximated
by the real rate of economic growth (Table 2.1). Before discussing the
causes of the growth in money supply, it may be enlightening to recapitulate
what are thought to be the determinants of the demand for money.
In short, the aggregate demand for money in a country depends on
the real national income, the level of prices and the yields (expected
interest rates) on bonds, commodities and capital; this demand function is
only relevant in a non-inflationary environment. When there is inflation,
the yields on bonds, capital and commodities no longer influence demand for
money; instead the expected rate of change of prices (inflationary
expectations) gains influence as a determinant of money demand. Ex post,
aggregate demand for money is equal to total money supply.
With respect to the causes of growth of money supply, the factors
responsible are budget deficits, bank credit and changes in international
reserves. In the Ugandan case, however, changes in international reserves
seem to have had no substantial influence on the growth of money supply
during the sixties and seventies: for example, whereas there were
substantial additions to the reserves during the period 1961-70, and
drawings on the reserves during the period 1971-79, the growth of money
CAUSES OF CHANGES IN MONEY SUPPLY, 1961-79 d Budget Surplus ( + ) or Deficit (-)
(Million S h s . )
Bank Credit Changes, a in Inter national Reserves (Million SDRs) e Money Supply Government
Borrowing From Bank of Uganda
(1970=100)
Domestic Bank Credit Outstanding
. b Value Index
(Million
Shs.) (1970-100) C 1 a i m s on C 1 a i m s o n
Government Non-Gove rnm.cn t
(9) ( % )
1961 - 14 3.1 -6.7 429 38
1962 - 3 7.3 'S. 6 404 36
1963 - 29.0 11 . 2 44 8 40
19'64 - 1 07.3 5.9 4 72 42
1965 - 2 36.6 -3.6 512 46
1966 - 75.0 -20.9 675 60
1967 - 79.7 1 0 o 758 67
1968 - 288.9 -10.6 895 80
19 69 - 4 2 3.4 -9.8 974 87
19 70 - 4 7 3.3 100 39 61 -3.0 1 12 3 100
19 71 - 951.9 40.1 .1160 103
19 72 - 87 3.7 -8.3 1552 138
19 7 3 - 1284 7.2 2130 190
19 74 - 1145 497 6 5 35 15. i 3010 272
19 75 - 14 37 -0.4 3257 290
19 76 + 1003° -2.0 4497 400
19 77 - 507 -0.5 5788 515
19 78 - 1 313 -12.0 705 3 628
19 79 1921 7 2 28 7807.6 707
(March)
No t e s : a Positive signi means a drawing out from the reserve pool while nogutivo signi means an addition to t ho rear rvi s .
b Computed by author using data from IMF, International Financial Statistics; and standardised the results with those of Helleiner and Ei c11a i:dson (19 7 9 , Ta b 1 e 26.],).
c Budget Surplus was possible because.of increased Government revenue from the coffee price boom and derived export tax. d Financial year starts and ends in Jun< .
e Narrow money - Cash +■demand deposits.
Source: I M F , International Financial Statistics, various issues; IMF,
[image:27.546.54.514.25.802.2]former but rapid in the latter period (Table 2.1); had the changes in
international reserves been substantially influential, then the growth
behaviour of money supply would have been the opposite. This then leaves
bank credit creation and central bank-financed budget deficits to have been
the principal determinants of the growth in money supply during the sixties
and seventies. Can the cause of growth of money supply, in the Ugandan
case, be pinned to one factor?
The main interest here in investigating the causes of growth in
money supply is to find the factor or factors which caused the rapid growth
in Uganda's money supply during the seventies; after all, money supply
during the sixties grew at a rate commensurate with the real rate of
growth of economic activities while it immensely outstripped the growth in
economic activities during the seventies.“*" Hence the seventies provide a
purposeful and ideal period for examining the causes of growth in money
supply.
The examination of individual contributions of budget deficits
and bank credit creation to the rapid growth of money supply during the
seventies may require the scrutiny of the information contained in Table 2.1.
With reference to the table, it can be observed that government borrowing
from the banking system outstripped private borrowing from the same source:
government borrowing from the banking system as a percentage of total
domestic credit increased from 39 per cent in 1970 to 72 per cent in March
1979; that is, private borrowing from the banking system was only 28 per
cent of the total borrowing in March 1979 compared to 61 per cent in 1970.
1 In the period 1961-70, money supply grew at an average rate of 6.2 per
Moreover, most of government borrowings were secured from the central bank
through ways and means advances which accumulated from Shs.205 Million in
1972/73 to Shs.5275 Million (more than 60 per cent of real GDP of 1976) in
1978/79 (Table 2.3). The borrowed money was used to finance budget
deficits which accumulated from Shs.1405 Million in 1972/73 to Shs.6088
Million (about 75 per cent of 1976 real GDP) in 1978/79, representing an
average growth rate of 67 per cent per year (Table 2.3).^ The increase of
1821 per cent in government borrowings from the central bank from 1970 to
March 1979 (Table 2.1) leaves no doubt that the government's expansionary
fiscal policy was chiefly responsible for the 1971-79 rapid growth of money
supply.
Another important investigation that is worth undertaking is
whether the rapid growth in money supply had any significant effect on the
price level; or to put it differently, can Uganda's inflation of the
seventies be explained by the rapid growth of money supply? The
money-prices relationship established in the Cambridge version of the Quantity
Theory of Money could provide an a priori hypothesis for the investigation.
It says:
M = K.Y.P. (2.1)
where M
P
Y
K
nominal money
the price level
real income
a constant (the reciprocal of the velocity of
circulation of money)
1 The growth of government spending and its allocation between capital
TABLE 2.2
MONEY SUPPLY AND PRICE LEVEL, 1960- 70
Money Supply, c Price Index*3 Value Index, a Change Index Change
in in
Index Index
(Million Shs.) (1970=100) (1970=100)
1960 437 39 n.a. 66 n.a.
1961 429 38 -1 60 -6
1962 404 36 -2 61 + 1
1963 448 40 +4 66 + 5
1964 472 42 + 2 72 +6
1965 512 46 +4 84 + 12
1966 675 60 + 14 81 -3
1967 958 67 + 7 85 +4
1968 895 80 + 13 81 -4
1969 974 87 + 7 91 +10
1970 1123 100 + 13 100 +9
1971 1160 103 + 3 115 + 15
1972 1552 138 + 35 111 -4
1973 2130 190 + 52 139 + 28
19 74 3010 . 272 + 82 231 +92
1975 3257 290 + 18 278 +47
19 76 4497 400 + 110 431 + 153
1977 5788 515 + 115 768 + 337
1978 7053 628 + 113 937 + 169
1979 7807.6 707 + 79 n.a.
(March)
Notes: n.a. not available.
a Computed by author using data from IMF, International Financial Statistics; and standardised to those of Helleiner and Richardson (1979, Table 26.1).
b The base has been shifted to 1970 by the author, c Narrow money = Cash + demand deposits.
Source: UN, Economic Commission for Africa: Summaries of Economic Data - Uganda, various issues; IMF,
[image:30.546.38.534.84.794.2]B UD GE T AR Y O P ER A TI ON S O F T H E CE N TR A L GOV ER NME NT FR OM 1 9 7 2 / 7 3 T O 1 9 7 8 / 7 9 ( S h s . M i l l i o n ) cn cd <G
\ ' —■ — 1
00 i n i—i CD i n CN CO i n CO i n
o~ o CO CN o r CO CO 00 O ' cn 00
cn cn 1—t CN i—i CN i o CN cn i—1
i—i CN) NT r~H
i
r—i i—1 CO
1 i n
CO ___
O ' cd rd
\ ■—
O ' O ' CO cn CO O o r lO i n
o - O ' o r CN CN 00 o r CO O '
Cn i—i O ' o r o cn o
-t—1 i n CO *—i CN i—i o r
+ i i
O ' ,_„
o - cd rd
\ — 1
i d CO *—i O ' CO O ' o r 00 •
O ' cn CO r—1 CN CO t—i CO cn
cn CO CO o o o CM -4J
1—1 m CO CN f—1 i—i o r C
+ i i CD
£
ID m r—l O lO lO i—i 4-J
O ' OT i n CO CN CN o O ' G
\ CN cn O ' i—1 CO CN G
i n CN CN 1 i i n P i
O ' i CD
cn Gd
i—1
CD £
LD cn cn o O ' CN i n o r 0
r - cn CN CO 1—1 CO i—i CO in
\ o NT CO 00 00 00
o r CN CN 1 i CO C
O ' i •rH
cn
(—i '
cn
CD
o r o r O ' CO o r i n i—i cn G
O ' CN CN o i n CO CO 00 cn
\ CO O O ' CO i n lO cn
r o r—t CN 1 i CN ■H
O ' 1
cn G
i—i <D
G cn
r o (D
O ' i n m o rG •
\ o o o Ü ,—.
CM o r CM CN X CM
O ' i—i rH pa CO
cn i CN
i—i G •
0 OP
Gd Gd
-G a) i—1
pa cn •
CD G O '
CD G JO CM
1 a rd
'— G CD in CD
to 4-1 i Gd rd £ 4-> i—C
G •rH — G > i—1 JO
0 o 4-J pa Gd 4-1 G G
Pm •H • H < rd cn
4-1 a G CD
nO CD •G rd U) cn G ref
CD Q P-l CD c G rr\
V (D > 4 rd •H i—1
fd G a CD Gd G P"
Td 0 4-> £ G G CT*
•H G rd G O
i—1 —. 0 Gd 4-J •rH
0 + <D 4-J G in cn G
cn — G •H rd 4-> -rH O
d) a tn in G + U G > cn
0 0 G G 4-> '— •rH cn O 0 Gd
c u r—1 CD id • H W 144 rö G G
0 CP G 0 Gd G 0) rd CO P i G
o GJ (D G C l-d C i—1 a S Gd I—1 JO
<u G G G CD CD CP G rH U
pi rd G CO > P-l CP G Gd nd pa •H ,—„ •rH
4-> (D 0 X G (D CD pa CD G Pi
4-J 4-J ’ H 4-J Pi ca CO 4-J 4-J G O '—
c c to G G rd <d rd Po G
<0 CD C CD i—1 gd i—i i—1 i—1 rH <D G CD • •
g G CD G cd CD rd rd G G > 4 G G -■ CD
g G P i G 4-J CD 4-J 4-J £ £ CO CD cn a
0 0 X G • H Ü •H -H G G 4-J G 144 CD G
0 u pa Ü CP 0 CP d U U G (D P H 4-J G
a) CD (D rd G <d rd U U G •H 0 O
The equation assumes K constant and Y fairly constant in the short-run.
Therefore, there will be an approximately proportional relationship between
nominal money increases and price increases if the equation is to hold.
The Cambridge equation expresses the money demand function, and
stipulates that in the short-run when real income is fairly constant, demand
for money is determined by changes in the price level. The constant K is
determined by yields (expected interest rates) on bonds, capital and
commodities in a non-inflationary environment; however, this determinant
loses potency during inflation; a new factor, inflationary expectations,
comes in to contribute to the demand function.
The causality in the money demand function of the Cambridge
equation can be reversed so as to determine the causes in price increases.
Holding real income constant, price increases are made to depend on changes
in money supply and inflationary expectations during inflation. This price
function can be put to the test using Ugandan data in order to establish
whether growth in money supply contributed significantly to inflation
during the seventies; Table 2.2 provides the data base. The ordinary least
squares method is used to estimate this economic relationship. The
logarithmic changes in the consumer price index (log AP) are regressed on
changes in money supply index (AM) and inflationary expectations (E) for an
eighteen-year period, 1961 to 1978 (Equation 2.2). The variable E is
represented by a dummy variable, and equated to zero during a period of no
inflation (1961-70) but to one during a period of inflation (1971-78).
Equation 2.3 summarises the results of the estimation: the coefficient of
changes in money supply is very highly significant at 1 per cent level
while the coefficient of inflationary expectations is positive but
insignificant at 10 per cent level.^
Log AP = b + b AM + b
o 1 2 E (2.2)
* * * * 1
Log AP = 2.1066 + 0.0224 (0.0059)
AM + 0.3718 E (0.4845)
(2.3)
R 12 = 0.70
The results show that changes in money supply contributed very significantly
to changes in prices during the period 1961-78 and that inflationary
expectations had no significant influence on prices during the inflationary
period, 1971-78. Relating the results to Uganda's inflation of the
seventies, it can be strongly concluded that the rapid growth in money
supply contributed very significantly to the run-away inflation of the
seventies while inflationary expectations played only a negligible role.
The Commodity Market
Two noteworthy aspects of Uganda's commodity market are inflation
and the segmentation of the commodity market. These aspects dominate the
discussion of the commodity market. First, the inflation; Uganda
sustained a period of price stability (3.4 per cent per year) in the period
1960-70, followed by a period of inflation (105 per cent per year) during
the years 1971 to 1978 (Table 2.2); an attempt is made to trace the causes
of this inflation.
Theories which have been advanced to explain the movements of
the commodity price level can be aggregated into at least five groups,
namely, demand-pull inflation, cost-push inflation, income or markup
inflation, Neo-Fisherian (monetarist or accelerationist) inflation and
1 Numbers in parentheses are standard errors. The asterisks indicate
sectoral-shift inflation (Makinen, 1977, p.331). The pre-Keynesian
quantity theorists argue that demand-pull inflation is caused primarily
by the rise in growth of money supply from its trend rate of growth while
the Keynesian theorists concentrate on the flow of expenditures as the
cause of demand-pull inflation; the cost-push inflation theorists associate
inflation with wage-push or profit-push by trade unions and oligopolists,
respectively; income or mark up inflation is caused by labour which adds a
mark up to any perceived productivity gains when seeking higher wages and/or
by .management which adds a profit mark up to the material and labour costs
when setting commodity prices; the sectoral-shift inflation theorists argue
that inflation is caused by a shift in the sectoral composition of demand;
and finally the monetarists blend demand-pull and cost-push inflation into
one integrated theory of inflation.
Of the inflation theories so far advanced, the monetarist
approach appears to provide an appropriate framework for the analysis of
Uganda's inflation. Both demand-pull and cost-push elements seem to be
embedded in Uganda's inflation although the presence of the cost-push
element is not yet'established. Speculations about the presence of
cost-push inflation in Uganda's inflation seem to arise from the information
contained in Table 1.1. From the table, it can be noted that Uganda's
real GDP grew at an average annual rate of 5.3 per cent during the period
1960-70 but declined to a growth rate of -0.3 per cent during the period
1970-76; for the same periods, the per capita growth rates were 2.4 per
cent and -3.5 per cent, respectively; the decline in the growth rate of
per capita real GDP represents a decline in labour productivity. If money
wages increased or stayed constant in the same period, cost-push inflation
but from a decline in productivity.
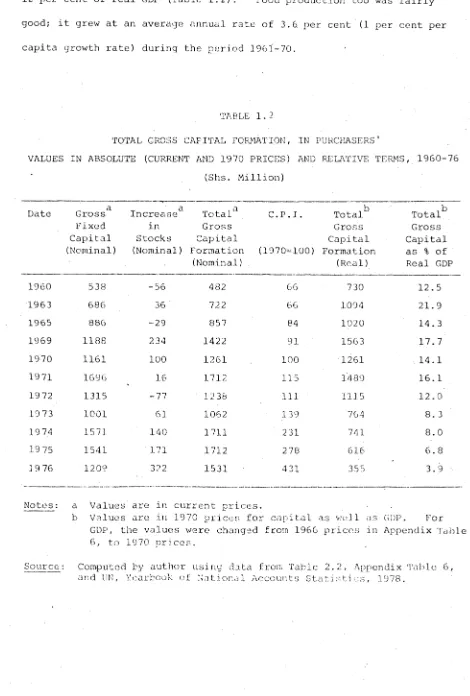
The interaction of demand-pull and cost-push inflation, arising
from a rapid growth of money supply and a decline in productivity,
respectively, can be represented diagrammatically as in Figure 2.1. In
the diagram, the demand-pull factor is represented by a shift of the
aggregate demand curve from to D^; the cost-push factor is represented
by a shift of the aggregate supply (real GDP) curve from to S^. The
shift of the demand and supply curves also entails the shift of the
equilibrium output and price from YQ and PQ to and P^, respectively.
The shift leads to inflation and a decline in real output and employment,
and is hence called stagflation.
However, a shade of doubt is cast at the presence of cost-push
inflation in the Ugandan inflation. Although there was a decline in
productivity represented by a decline in the rate of growth of per capita
real GDP, there was also a decline in the minimum real wage of 80 per cent
over the period 1970/71 to 1978 (Table 2.7); it is very conceivable that
the decline in real wage might have counter-checked the cost-push inflation
arising from the decline in productivity. That being the case, cost-push
inflation might have been little or non-existent in the Ugandan inflation;
this leaves demand-pull inflation to be the dominant factor in the Ugandan
inflation.
One of the effects of inflation on the Ugandan economy was the
segmentation of the commodity market. The latter was split into three
components, namely, the controlled or official market, the blackmarket, and
1 Table 2.7 reveals that the minimum money wage increased by 54 per cent
over the period 1970/71 to 1978. Since, from the same table, the real
A
g
g
r
e
g
a
t
e
P
r
i
c
e
L
e
v
e
l
(
P
)
FIGURE 2.1 THE COMMODITY MARKET
[image:36.546.45.524.96.782.2]the market where "army prices" prevailed. The controlled market: dealt
with the so-called essential commodities: salt, sugar, soap, cooking oil,
cigarettes, beer, most of the export commodities and some production inputs
such as labour and fuel (Belshaw and Stent, 1979a, p.42). The prices
offered were ostensibly government-determined and controlled. Additionally,
prices of imports purchased with foreign currency bought at the official
rate were determined by the official rate of exchange; h o w e v e r , these prices
were only for those who had access to foreign exchange officially. The
prices prevailing in the controlled market were relatively low compared to
those prevailing in other markets. From Table 2.4, it can be observed
that, official prices were, in some cases, five times lower than the black-
market prices. Yet these official prices were entering the computation
of the consumer price index; they are likely to have led to severe under
estimation of the inflation rate.
TABLE 2.4
SELECTED KAMPALA OFFICIAL AMD FREE MARKET P R I C E S , MAY 1979
Official (Shs.)
Free Market (Shs.)
Salt 2. GO 20.00
Laundry Soap (bar)
Maize Meal (1 kilo)
Sugar (1 kilo)
Bread (li kilo)
15.00 8.00
7.00 7.50
20.00 40.00 40.00
17.50
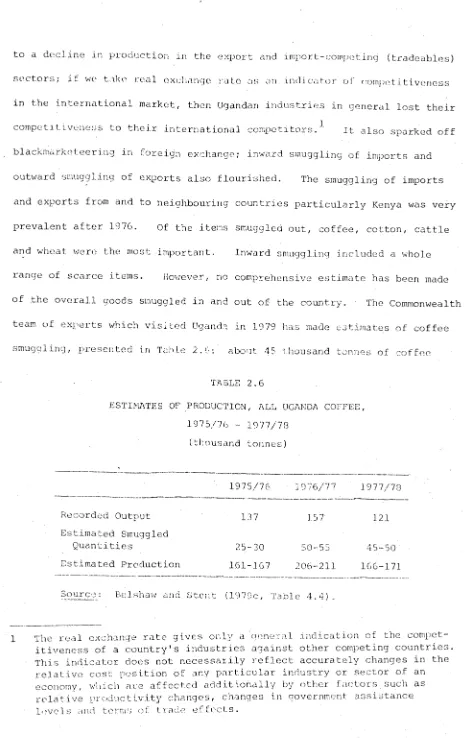
[image:37.546.52.515.392.799.2]Then there was the blackmarket. Blackmarketeering was a big component of Magendo which is a popular term in Uganda, used to refer to illicit but high profit-generating economic activities, mainly internal blackmarketeering and smuggling. The prices and profits from such economic activities are called Magendo prices and Magendo profits, respectively. The Magendo or (in fact) free market prices were as high as five times the official prices in 1979 (Table 2.4). Based on such prices, the UNLF government estimates Uganda's inflation rate to have been 150-200 per cent per. year during the period 1971-78 (Africa Research Bulletin, 1979, p.5087c) compared to 105 per cent, for the same period, for the estimation which includes official prices.
Finally the "army prices" market; it was an ad hoc market whose prices were even lower than the official prices (Belshaw and Stent, 1979a, p.42). The "army prices" were the prices of goods confiscated by army personnel or of goods which were sold locally by traders at army gun point.
This split in the commodity market created a big distortion in the allocation of resources, diverting resources away from formal production to speculative businesses or Magendo. The "army prices" market not only intimidated traders but also destroyed their incentive to do business.
The Foreign Exchange Market
Since 1975, the Uganda shilling has been pegged to SDR (or the U.S. dollar, de facto) ; Table 2.5 shows the rate at which it exchanged against the SDR unit:'*- despite an average inflation rate of 105 per cent per year in the period 1971-78, the Uganda shilling officially depreciated only by an average rate of 3 per cent per year in the same period. This 1 Appendix Table 2 shows the rate at which the Uganda shilling exchanges