White Rose Research Online URL for this paper:
http://eprints.whiterose.ac.uk/123657/
Version: Accepted Version
Article:
Chudpooti, N, Silavwe, E, Akkaraekthalin, P et al. (2 more authors) (2018) Nano-Fluidic
Millimeter-Wave Lab-on-a-Waveguide Sensor for Liquid-Mixture Characterization. IEEE
Sensors Journal, 18 (1). pp. 157-164. ISSN 1530-437X
https://doi.org/10.1109/JSEN.2017.2772348
© 2017 IEEE. Personal use of this material is permitted. Permission from IEEE must be
obtained for all other users, including reprinting/ republishing this material for advertising or
promotional purposes, creating new collective works for resale or redistribution to servers
or lists, or reuse of any copyrighted components of this work in other works.
[email protected] https://eprints.whiterose.ac.uk/ Reuse
Unless indicated otherwise, fulltext items are protected by copyright with all rights reserved. The copyright exception in section 29 of the Copyright, Designs and Patents Act 1988 allows the making of a single copy solely for the purpose of non-commercial research or private study within the limits of fair dealing. The publisher or other rights-holder may allow further reproduction and re-use of this version - refer to the White Rose Research Online record for this item. Where records identify the publisher as the copyright holder, users can verify any specific terms of use on the publisher’s website.
Takedown
If you consider content in White Rose Research Online to be in breach of UK law, please notify us by
Abstract— This paper reports on a miniaturized lab-on-a-waveguide liquid-mixture sensor, achieving highly-accurate nanoliter liquid sample characterization, for biomedical applications. The nanofluidic-integrated millimeter-wave sensor design is based on near-field transmission-line technique implemented by a single loop slot antenna operating at 91 GHz, fabricated into the lid of a photolaser-based subtractive manufactured WR-10 rectangular waveguide. The nanofluidic subsystem, which is mounted on top of the antenna aperture, is fabricated by using multiple Polytetrafluoroethylene (PTFE) layers to encapsulate and isolate the liquid sample during the experiment, hence, offering various preferable features e.g. noninvasive and contactless measurements. Moreover, the sensor is reusable by replacing only the nanofluidic subsystem, resulting a cost-effective sensor. The novel sensor can measure a liquid volume of as low as 210 nanoliters, while still achieving a discrimination accuracy of better than 2% of ethanol in the ethanol/deionized-water liquid mixture with a standard deviation of lower than 0.008 from at least three repeated measurements, resulting in the highest accurate ethanol and DI-water discriminator reported to date. The nanofluidic-integrated millimeter-wave sensor also offers other advantages such as ease of design, low fabrication and material cost, and no life-cycle limitation of the millimeter-wave subsystem.
Index Terms—biomedical liquid mixtures, nanofluidic, millimeter-wave sensor, transmission line method, W-band.
I. INTRODUCTION
ECENTLY, microwave and millimeter-wave measurements of liquid mixture concentration have become attractive techniques for numerous biological, industrial and biomedical applications [1]-[4] due to their high sensitivity, robustness and efficiency, as well as low fabrication and measurement costs [5]. In addition to these
This work has been supported by the Thailand Research Fund through the TRF Senior Research Scholar Program with Grant No.RTA6080008, the Royal Golden Jubilee Ph.D. Program with Grant No.PHD/0093/2557 and the Commonwealth Scholarship Commission.
N. Chudpooti, and P. Akkaraekthalin are with the Department of Electrical
and Computer Engineering, Faculty of Engineering, King Mongkut’s
University of Technology North Bangkok, Bangsue, Bangkok, 10800, Thailand (e-mail: [email protected]; and [email protected]).
E. Silavwe, I. D. Robertson, and N. Somjit are with the School of Electronics and Electrical Engineering, University of Leeds, Leeds, LS2 9JT, U.K. (email: [email protected]; [email protected]; and [email protected]).
Digital Object Identifier https://doi.org/10.5518/268
advantages, they also exhibit short assay time, easy integration into an electronic system, and no additional chemical material requirements, making them one of the most preferable techniques for noninvasive and contactless biosensing technologies [6]-[8]. For examples, high sensitivity and accurate identification of biological and chemical liquid samples using microwave dielectric and metallic cylindrical resonators have been extensively investigated[9]-[11].
There are many methods in using microwave and millimeter-wave sensors to discriminate liquid ingredients from liquid mixtures, e.g. transmission-line and resonance techniques [12]-[13]. The selection between transmission-line and resonance techniques predominantly depends on the material to be measured, the required measurement accuracy and the operational frequency. Generally, resonance methods were used for solids characterization [14] because it basically determines the dielectric property from resonance frequency and quality factor. Recently, they can also be used for liquid material detection and quantification, offering a good measurement accuracy [15]-[17]. Transmission-line methods, on the other hand, have been used to characterize both liquids and solids and offer broadband characterization compared to the resonance techniques [18]. Transmission-line methods are widely used in liquid characterization than resonance methods [19]-[21], since the liquid solutions usually exhibit very high material losses, which significantly attenuate the peak amplitude at the resonant frequency of the resonance methods and thereby reduce the measurement accuracy [8], [12].
The operational frequencies of liquid-mixture sensors are ones of the crucial parameters to determine the sensitivity of the sensors. Generally, higher measurement and discrimination accuracy of a liquid-mixture sensor increases at higher operational frequencies [17], [19]. In microwave and millimeter-wave bands, many research studies have been published on the characterization of ethanol content in liquid mixtures [17]-[19], [22]-[23] reporting the best current achievements of discrimination sensitivities of approximately 5% ethanol content in liquid mixtures.
Nonchanutt Chudpooti, Student Member, IEEE, Evans Silavwe, Student Member, IEEE,
Prayoot Akkaraekthalin, Member, IEEE, Ian D. Robertson, Fellow, IEEE,
and Nutapong Somjit, Member, IEEE
Nano-Fluidic
Millimeter-Wave
Lab-on-a-Waveguide Sensor
for Liquid-Mixture Characterization
(a)
(b)
(c)
(d)
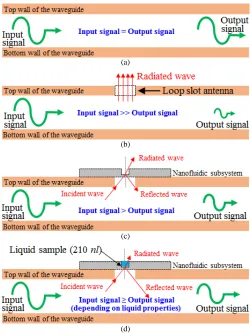
Fig. 1. The EM wave propagation (a) inside standard hollow WR-10 waveguide, (b) After integrating a single loop slot antenna into the top wall of the waveguide, (c) After mounting the nanofluidic subsystem on top of the loop slot antenna and (d) After filling liquid sample into the nanofluidic channel.
for noninvasive and contactless liquid-mixture characterization and discrimination. The sensor design is based on near-field transmission-line techniques implemented by a tailor-made WR-10 rectangular waveguide integrated with a single loop slot antenna. The nominal frequency of 91 GHz with an operational bandwidth of 0.5 GHz is chosen as the compromised frequency band for an accurate sensing efficiency with a small sensor size, while still offering superior figure-of-merits, ease of design and low fabrication cost. The nanofluidic subsystem is fabricated by using PTFE to encapsulate and isolate the liquid mixture sample during measurement. The sensor can achieve the discrimination accuracy of ethanol content in the ethanol/deionized water mixture of approximately 2%, while requiring only 210 nanoliters of the liquid sample. At least three repeated measurements for each liquid mixture sample were carried out and the standard deviation of those measurements is only 0.008. To our best knowledge, the proposed nanofluidic-integrated millimeter-wave sensor achieves the best discrimination accuracy of DI-water/ethanol liquid mixture ever reported in any literatures to date.
II. LIQUID MIXTURE CHARACTERIZATION WORKING PRINCIPLE
The liquid-mixture quantization sensor in this work is based on the near-field transmission-line technique. The basic working principle, as shown in Fig. 1, is to detect any tiny changes in the transmitted millimeter-wave signal between input and output port of a WR-10 75-110-GHz rectangular waveguide, caused by an electromagnetic (EM) interaction between the radiated near-field from a loop slot antenna fabricated into the top wall of the waveguide and the liquid material in the nanofluidic subsystem located on top of the antenna.
Fig.1 (a) depicts the EM-wave propagation from the input to output port inside the hollow of the WR-10 waveguide. By embedding the single loop slot antenna into the top wall of the waveguide, as shown in Fig. 1(b), most of EM power radiates from the antenna into the open space while only a tiny amount of the EM power reaches the output port. The magnitude of the transmission coefficient, |S21|, is thus very small, as compared to the waveguide without the antenna, due to the much less transmitted EM power from the input to the output port. Fig. 1 (c) shows the EM interaction of the radiated EM wave when a nanofluidic subsystem is mounted on top of the loop slot antenna with the nanofluidic channel filled up with air. It can be also called an empty channel or calibration channel. The EM interaction of the millimeter-wave system integrated with the nanofluidic can be explained as for Fig. 1 (b) but less EM power radiates from the slot loop antenna into the free space and more EM power propagates towards the output port. In this case, the nanofluidic subsystem, implemented by using PTFE as a low-loss material, creates an impedance mismatch between the antenna and the free space resulting in less radiated EM power from
the loop slot antenna and, therefore, more EM power is transmitted to the output port. In Fig.1 (d), the liquid sample is encapsulated inside the nanofluidic channel without any air bubble. The EM wave propagation and interaction, in this case, is similar to Fig.1 (c) but its transmitted signal power to the output port is higher, depending on the material properties of the liquid, e.g. complex dielectric constant and conductivity. As most liquid samples are a high loss material, therefore, a great impedance mismatch between the antenna and the free space is introduced and almost all of the radiated EM power is reflected back into the waveguide and propagates toward the output port. Hence, the magnitude and phase of the transmission coefficient at the output port can be used to characterize liquid content in the liquid mixture because each liquid content possess different characteristic impedance and, thus introduces different reflection and transmission coefficients between the loop slot antenna and free space, which affect the magnitude and phase of the transmission coefficient at the output port.
III. SENSOR DESIGN AND FABRICATION
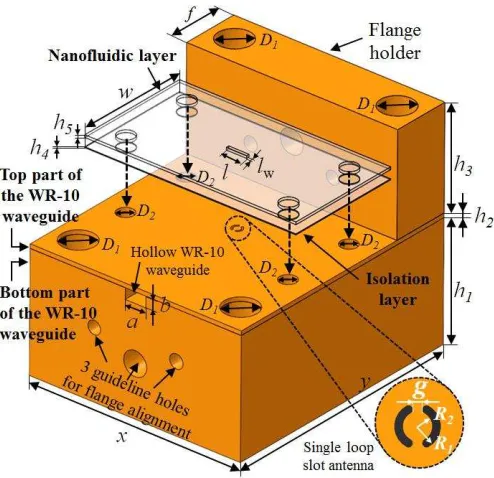
[image:3.612.313.563.50.385.2]rectangular metallic waveguide structure operating in the 75-110 GHz W-band and an integrated single loop slot antenna embedded into the top-side wall of the waveguide. The nanofluidic subsystem is made of two PTFE layers to isolate and encapsulate the liquid sample under test during liquid-mixture characterization. The geometry of the sensor and the values of all necessary design parameters are shown in Fig. 2 and Table I, respectively.
A. Millimeter-wave subsystem design
By using the waveguide splitting technique, the waveguide structure is split in the H-plane, which creates two parts of the WR-10 rectangular waveguide. The bottom part is the rectangular waveguide structure without top metallic wall, resulting in an open rectangular-cross-section slot along the waveguide structure. The top part is the removable metallic lid used as a top wall of the slotted waveguide structure, forming a complete WR-10 rectangular waveguide. By reusing the bottom part of the waveguide structure and only changing the top waveguide lid, the life cycle of the tailor-made WR-10 waveguide is increased. Furthermore, it is simple and cost-effective to machine any desired slotted pattern into the top lid to accommodate various different sensor structures with different measurement purposes. The key requirement for the H-plane split waveguide in this work is to ensure that the top and bottom parts are assembled properly without any gap along the boundary to sustain a continuous current distribution on the waveguide walls without any unintended current and EM-field disruption. The bottom structure of the WR-10 waveguide is made of a copper block with the waveguide cross-section aperture of 2.54 mm 1.27 mm, allowing the TE10 mode to propagate between 75 GHz and 110 GHz in a single-mode pattern.
A single loop slot antenna is embedded into the waveguide lid, which is made of a copper sheet with a thickness of 0.5 mm. The loop slot is located at the center of the copper sheet to maximize the surface current flow around the slot antenna structure, resulting highest EM radiation of the loop antenna. The resonance frequency of this slot is defined as [24]
0
1 2
( ) 2
c f
R R g
(1)
where, R1, R2, and g are the outer radius, inner radius, and gap of loop slot antenna, respectively. For the sensor design in this paper, the resonance frequency is calculated using the parameters listed in Table. I. From CST Studio Suite simulations, smaller slot width achieves better impedance matching at the designed resonance frequency of 91 GHz, resulting in increased dynamic range of the sensor. On the other hand, the wider slot width introduces worse impedance matching and, thus, offers worse dynamic range. In this paper, the slot width of 0.19 mm is selected as the best compromise between the slot width and the sensitivity and accuracy of the sensor due to fabrication limitations of the manufacturing facility in our laboratory.
B. Nanofluidic subsystem design
The nanofluidic subsystem consists of an isolation layer, which is mounted on top of the loop slot antenna to physically isolate the fluidic subsystem from the millimeter-wave one, and a nanofluidic layer. The isolation layer is made of PTFE sheet with a thickness of 0.1 mm (h4 in Fig. 2), preventing any liquid leakage from the nanofluidic channel into the loop slot antenna. On top of the isolation layer, a 0.3-mm PTFE nanofluidic layer (h5 in Fig. 2) with a micro-scale
rectangular-Fig. 2. 3D drawing of the lab-on-a-waveguide liquid mixture sensor composed of a rectangular waveguide with a single loop slot antenna and nanofluidic subsystem on top.
TABLEI SENSOR DESIGN GEOMETRY
Parameter Description Length (mm)
a Width of the waveguide aperture
2.54 b Height of the waveguide aperture 1.27 D1 Diameter of waveguide flange
holder
4
D2 Diameter of the screw holes of the
nanofluidic sub system
2
f Flange holder width 7 g Gap between loop slot antenna 0.17 h1 Copper block height (bottom part of
the WR-10 waveguide structure)
14
h2 Waveguide lid thickness (top part of
the WR-10 waveguide)
0.5
h3 Flange holder height 12
h4 Isolation layer thickness 0.1
h5 Nano-fluidic layer thickness 0.3
l Liquid channel length 2 lw Liquid channel width 0.35
R1 Outer radius of loop slot antenna 0.64
R2 Inner radius of loop slot antenna 0.43
w Width of the PTFE layer (nanofluidic subsystem)
14
x Copper block width of the WR-10 waveguide
26
y Copper bock length of the WR-10 waveguide
[image:4.612.47.294.51.290.2]slot liquid channel is mounted. The liquid channel is located above the center of the loop slot antenna to maximize the EM interaction between the EM signal and fluidic material. The nanofluidic channel has dimensions of 2 mm (length) 0.35 mm (width) 0.3 mm (height), which minimizes the requirement of the liquid volume to only 210 nanoliters. By employing the isolation layer, the nanofluidic subsystem can be simply replaced and other liquid mixture materials can be measured, while still keeping the millimeter-wave subsystem reusable, resulting in a very cost-effective sensor system.
C. Millimeter-wave subsystem fabrication
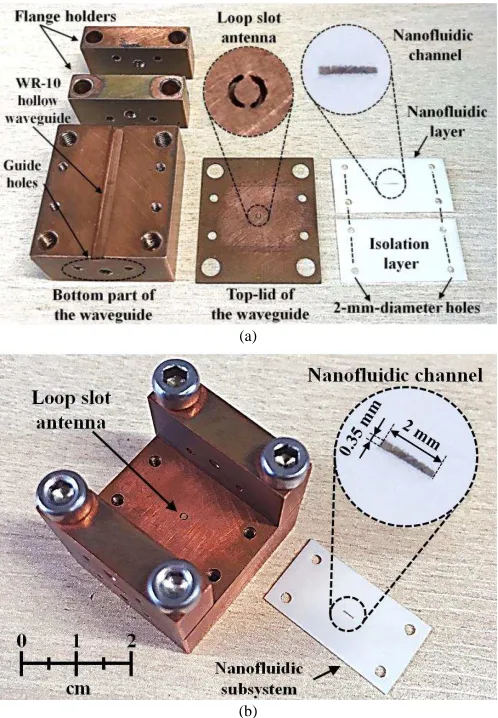
The millimeter-wave subsystem composing of the WR-10 waveguide structure without the top wall, the waveguide lid integrated with the loop slot antenna, and the waveguide flange holders, are fabricated by using subtractive manufacturing LPKF Photo Laser U3. As shown in Fig. 3 (a), to construct the WR-10-waveguide bottom structure, a copper block is laser etched to create a rectangular slot with slot width
to transmit EM power from the input to output port. On both sides of the copper block, three guide holes are fabricated for the alignment of two W-band extender flanges of the network analyzer with the tailor-made WR-10 rectangular waveguide. A 0.5-mm-thick copper sheet is utilized as the waveguide lid to cover the top part of the waveguide structure, completing the WR-10 waveguide. The LPKF Photo Laser U3 is used to fabricate the loop slot antenna by etching through to the waveguide lid. Then, eight screw holes are fabricated for aligning the waveguide structure with the lid embedded with loop slot antenna. Four screw holes (D1 in Fig. 2) located close to the four corners of the waveguide lid are used to mount the flange holders. Likewise, four additional screw holes (D2 in Fig. 2) are fabricated and used to fix the position of the nanofluidic subsystem during measurement. Two copper flange holders, which are made of two smaller copper blocks, are mounted on both edges of the WR-10 waveguide to increase the mechanical and electrical stabilities of the physical interfaces between the waveguide sensor and the W-band extenders from the network analyzer.
D. Nanofluidic subsystem fabrication
The nanofludic subsystem composed of an isolation layer and a nanofluidic layer is fabricated by using LPKF ProtoMat S100. The isolation layer is made of an unpatterned PTFE sheet with a thickness, length and width of 0.1 mm, 26 mm and 14 mm, respectively. The isolation layer is used to prevent any liquid leakage into the loop slot antenna; thus, protecting the millimeter-wave subsystem from any moisture damage. Near the four corners of the isolation layer, four screw holes with a diameter of 2 mm are etched through the layer and are used to fix the position of the nanofluidic subsystem during measurement. The nanofludic layer containing a nanofluidic channel is made of a PTFE sheet with a thickness of 0.3mm. The liquid channel is etched through in the middle of the nanofluidic layer in which the liquid sample is to be encapsulated. Similar to the isolation layer, four screw holes with a diameter of 2 mm are etched through near the corners of the layer serving the same purpose as for the isolation layer. Subsequently, the nanofluidic layer is glued to the top of the isolation layer using the nonconductive adhesive spray.
E. Millimeter-wave and nanofluidic subsystems integration.
The Fig.3 (a) and (b) show the fabricated sensor prototype before and after integration, respectively. To integrate the millimeter-wave subsystem, the top-lid of the waveguide is mounted on top of the fabricated bottom waveguide structure and is well aligned by using eight alignment screw holes, which are fabricated into thetop and bottom waveguide structures. Then, both waveguide flange holders are placed on top of the both edges of the waveguide lid and all waveguide structures are mounted together with M4 screws at the four corners to complete the WR-10 waveguide. On the top of waveguide lid of the millimeter-wave subsystem, the
nanofluidic subsystem is mounted by using fours M2 screws to physically attach both subsystems together and eliminate any air gap along the boundary between them.
(a)
(b)
Fig. 3 (a) Fabricated sensor prototype before integration, which consists of the bottom structure of the waveguide, an integrated single loop slot antenna embedded into the top lid of the waveguide, two flange holders, the isolation layer and the nanofluidic layer. (b) Fabricated sensor prototype after integration comprising the millimeter-wave subsystem and nanofluidic subsystem, which is made from Polytetrafluoroethylene (PTFE) material and the liquid channel (with dimensions 0.35 2 mm2) at the center of the
[image:5.612.49.298.53.412.2]IV. MEASUREMENT RESULTS
A. Measurement Setup and Sensor Calibration
To accurately fill the nanofluidic channel with the liquid-mixture, the liquid solution is carefully dropped into the liquid channel by using micropipette. Moreover, fluidic channel is completely filled without any air bubble during the measurement. The temperature of the liquid mixture sample is well maintained at room temperature of 25˚C. The S-parameter measurement is completed by using the Agilent PNA-X N5242A Network Analyzer with two 75-110-GHz W-band millimeter-wave VNA Extenders mounted at both ports, shown in Fig. 4. Two-port TRL calibration is performed using standard waveguide calibration kit prior to the measurement.
Two unmixed liquid samples, which are the 100% deionized (DI) water and 100% ethanol, are separately characterized and quantified. The measured transmission coefficients, S21, for each unmixed liquid solution are used as the reference parameters. For the frequency band from 90.7 to 91.2 GHz, the measured transmission coefficient |S21| of the unmixed DI
Fig. 8. Measured transmission coefficient |S21| in dB with error bar for
ethanol concentration in the range of 90%, 92%, 94%, 96%, 98%, and 100% in DI water.
Fig. 5. Measured transmission coefficient |S21| in dB with error bar for
ethanol concentration in the range of 0%, 10%, 20%, 30%, 40%, 50%, 60%, 70%, 80%, 90%, and 100% in DI water. In the top, middle, and bottom dashed boxes are the zoomed areas shown in larger scale in Fig. 6, 7, and 8, respectively.
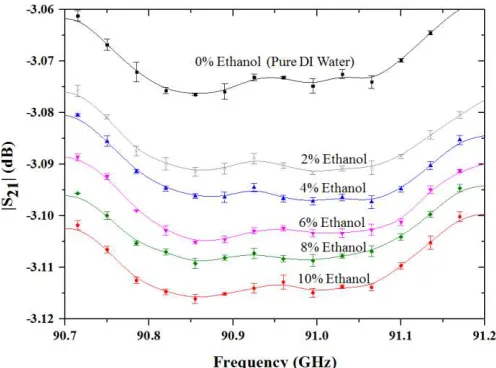
Fig. 6. Measured transmission coefficient |S21| in dB with error bar for
ethanol concentration in the range of 0%, 2%, 4%, 6%, 8%, and 10% in DI water.
Fig. 4. Fabricated sensor after putting the nanofluidic subsystem on top of the microwave subsystem and connecting the sensor to the W-band extender and that to the VNA.
Fig. 7. Measured transmission coefficient |S21| in dB with error bar for
[image:6.612.47.296.48.230.2] [image:6.612.314.561.49.233.2] [image:6.612.45.293.274.457.2] [image:6.612.314.560.275.458.2] [image:6.612.46.294.516.700.2]Fig. 9. Liquid-mixture quantification curve in the relative transmission coefficient changes |∆S21| in dB as a function of Ethanol in DI water
concentration and regression value of 0.99679 from fitting plot.
water is -3.075 dB. For the 100% ethanol, the measured transmission coefficient |S21| is -3.64 dB. The difference in transmission coefficient |S21| of 0.565 dB was observed between the unmixed DI water and the 100% ethanol. The relative transmission coefficient measurement |∆S21| between two liquid-mixture samples is sufficient to perform liquid-mixture discriminations between each different liquid-mixture sample.
B. DI-Water/Ethanol Liquid Mixture Measurement
All liquid-mixture samples are carefully prepared in the laboratory environment by using the micropipette for high precision level of ethanol concentration in each DI-water/Ethanol liquid-mixture sample. The verification of the liquid-mixture sensor was demonstrated using different
concentrations of the ethanol and DI water mixture. The concentrations of ethanol content in the DI water varied from 0 – 100%, which 0% means the liquid solution is composed of only DI water and 100% means only ethanol is in the liquid mixture. Fig. 5 shows the measured transmission coefficient |S21| of the ethanol concentration, which was varied in the step of 10% starting from 0 to 100%. Fig. 6, 7 and 8 depict the measured magnitudes of S21 versus frequencies, with higher measurement resolutions, in three representative groups comprising 0-10%, 50-60% and 91-100% of ethanol content in liquid-mixture, respectively. In the first group, the ethanol content varies in the range of 0%, 2%, 4%, 6%, 8% and 10%. The measurement results clearly show an accurate discrimination of better than 2% ethanol in DI water. At least three measurements for each liquid-mixture sample were repeated and agreeable results are obtained, as indicated by the error bars. The average change in transmission coefficient is approximately 0.005 dB for each 2% step of ethanol in DI water liquid-mixture, as shown in Fig. 6. In the second group, the ethanol content varies in the range of 50%, 52%, 54%, 56%, 58% and 60%. The magnitude of the measured S21 approximately changes by 0.01 dB per 2% step of ethanol in liquid mixture solution, as shown in Fig 7. For the third group, the ethanol content varies in the range of 90%, 92%, 94%, 96%, 98% and 100%. The average transmission coefficient changes by 0.02 dB per 2% step of ethanol concentration in DI water, as shown in Fig. 8. For all the measured results, the maximum, minimum, and average of the standard deviation of measured S21 are 0.00897, 0.00654, and 0.00776, respectively.
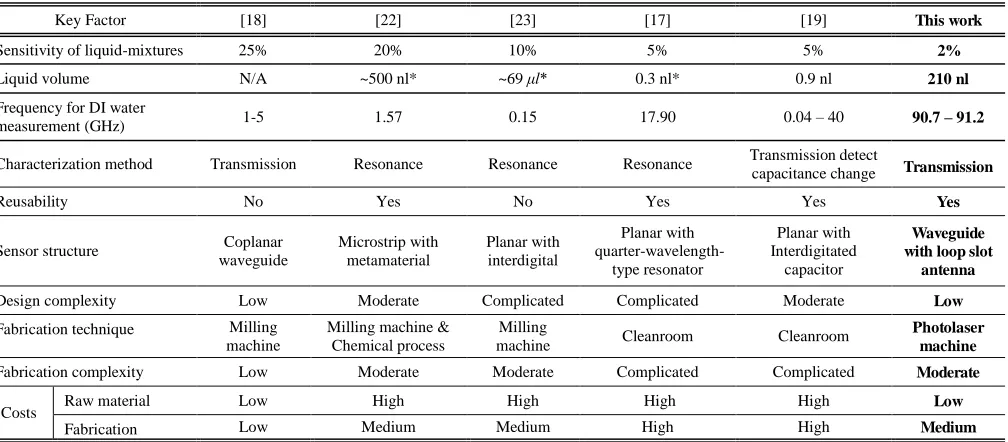
Table II extebsively shows the figure-of-merit coparisions of the lab-on-a-wavguide liquid-mixture sensor with other published works, [17]-[19] and [22]-[23]. The liquid-mixture sensor in this work is the most accurate ethanol/DI water liquid-mixture discriminator and offers many advantages over the state-of-the-art liquid sensors published to date.
Key Factor [18] [22] [23] [17] [19] This work
Sensitivity of liquid-mixtures 25% 20% 10% 5% 5% 2%
Liquid volume N/A ~500 nl* ~69 l* 0.3 nl* 0.9 nl 210 nl
Frequency for DI water
measurement (GHz) 1-5 1.57 0.15 17.90 0.04 – 40 90.7 – 91.2 Characterization method Transmission Resonance Resonance Resonance Transmissiondetect
capacitance change Transmission
Reusability No Yes No Yes Yes Yes
Sensor structure Coplanar waveguide
Microstrip with metamaterial
Planar with interdigital
Planar with
quarter-wavelength-type resonator
Planar with Interdigitated
capacitor
Waveguide with loop slot
antenna
Design complexity Low Moderate Complicated Complicated Moderate Low
Fabrication technique Milling machine
Milling machine & Chemical process
Milling
machine Cleanroom Cleanroom
Photolaser machine
Fabrication complexity Low Moderate Moderate Complicated Complicated Moderate
Costs Raw material Low High High High High Low
Fabrication Low Medium Medium High High Medium
[image:7.612.57.561.77.298.2] [image:7.612.48.294.312.520.2]C. Liquid Mixture Quantification Curve
Fig. 9 shows the calibrated curve for 0% to 100% ethanol volume in the DI water liquid mixture. The regression value (R2) of 0.99677 is generated from the polynomial fitted plot calculated by Origin. The mathematically curve-fitted model for the ethanol/DI water mixture is achievable in two calculation steps. The first calculation step involves the measurement results of the unmixed DI water as a reference point. In the second step, the varied ethanol content from 2 to 100% in the DI water are measured. The mathematical equation, therefore, gives the ethanol percentage in the liquid mixture in terms of the relative transmission coefficient |∆S21|. The liquid-mixture quantification equation of different ethanol contents in the DI water using this sensor is given as
2
21 21
97.277 | | 235.171 | | 0.06448
P
E S S (2)
21 21( ) 21( )
|
S
| |
S
measured
S
DI water|
(3)where |∆S21| is the magnitude of the relative transmission coefficient, which is the difference between the measured transmission coefficient of the liquid mixture (S21(measured)) and the measured reference transmission coefficient of the unmixed DI water (S21(DI water). EP is the percentage of ethanol content in the ethanol/DI water liquid mixture.
D. Environmental Effects
In this study, the temperature of the liquid-mixture sample is well controlled at the room temperature of 25˚C.
At a higher temperature, the value of dielectric loss of the DI water decreases [25], [26], resulting in lower discrimination sensitivity of the liquid-mixture sensor due to slight changes of the transmission coefficient |S21| levels. However, the liquid-mixture sensor is not required to operate at over 78˚C [27] as large quantity of ethanol will evaporate at this boiling point, causing the inaccuracy of the ethanol content in the liquid mixture.
V. CONCLUSION
The miniaturized lab-on-a waveguide liquid-mixture sensor has shown many merits. High discrimination accuracy can be with very small liquid-mixture volume of 210 nanoliters. In this work, a single loop slot antenna is adequate to provide the EM interaction between the radiated near field and the liquid samples. Moreover, the liquid-mixture sensor is able to discriminate ethanol content of approximately 2% in the ethanol/DI water liquid mixture with high repeatability at 91 GHz. By using cost-effective fabrication processes and materials, a low-cost integrated sensor with potential biological and medical applications was developed.
ACKNOWLEDGMENT
This work has been supported by the Thailand Research Fund through the TRF Senior Research Scholar Program with Grant No. RTA6080008, the Royal Golden Jubilee Ph.D. Program with Grant No.PHD/0093/2557and the Commonwealth Scholarship Commission.The data associated
with this paper are openly available from the University of Leeds repository. https://doi.org/10.5518/268
REFERENCES
[1] K. H. Theisen and T. Diringer, “Microwave concentration measurement
for process control in the sugar industry,” in Proc. SIT, 2000, vol. 60, pp. 79-92.
[2] F. Daschner and R. Knochel, “Dielectric microwave sensors with
multivariate calibration,” Adv. Radio. Sci., vol. 1, pp. 9-13, 2003. [3] A. Gregory and R. Clarke, “A review RF and microwave techniques for
dielectric measurements on polar liquids,” IEEE Trans. Dielectr. Electr. Insul., vol. 13, no. 4, pp. 727-743, Aug. 2006.
[4] M. Schueler, C. Mandel, M. Puentes, and R. Jakoby, “Metamaterial inspired microwave sensors,” IEEE Microw. Mag., vol. 13, no. 2, pp. 57-68, Mar./Apr. 2012.
[5] C. Mandel, B. Kubina, M. Schubler, and R. Jakoby, “Passive chipless wireless sensor for two-dimensional displacement measurement,” in Proc. 41st Eur. Microw. Conf., 2011, pp. 79-82.
[6] G. Gennarelli, S. Romeo, M. R. Scarfi, and F. Soldovieri, “A microwave
resonant sensor for concentration measurements of liquid solutions,”
IEEE Sensors J., vol. 13, no. 5, pp. 1857-1864, May 2013.
[7] H.-J. Lee, et al., “A planar split-ring resonator-based microwave biosensor for label-free detection of biomolecules,” Sens. Actuators B, Chem., vol. 169, pp. 26-31, Jul. 2012.
[8] E. Silavwe, N. Somjit, and I. D. Robertson, “A microfluidic-integrated SIW lab-on-substrate sensor for microliter liquid characterization,” IEEE Sensors J., vol. 16, no. 21, pp. 7628-7635, Nov. 2016.
[9] J. Kim, A. Babajanyan, A. Hovsepyan, K. Lee, and B. Friedman,
“Microwave dielectric resonator biosensor for aqueous glucose solution,” Rev. Sci. Instrum., vol. 79, no. 8, pp. 086107-086107-3, 2008. [10] K. Yu, S. G. Ogourtsov, V. G. Belenky, A. B. Maslenikov, and A.
Omar, “Accurate microwave resonant method for complex permittivity
measurement of liquids,” IEEE Trans. Microw. Theory Tech., vol. 48, no. 11, pp. 2159-2164, Nov. 2000.
[11] H. Kawabata and Y. Kobayashi, “Accurate measurements of complex permittivity of liquid based on a TM010 mode cylindrical cavity
method,” in Proc. Eur. Microw. Conf., vol. 1, Oct. 2005, pp. 369-372. [12] B. Kapilevich and B. Litvak, “Optimized microwave sensor for online
concentration measurements of binary liquid mixtures,” IEEE Sensors J., vol. 11, no. 10, pp. 2611-2616, Oct. 2011.
[13] K. Grenier et al., “Integrated Broadband Microwave and Microfluidic
Sensor Dedicated to Bioengineering,” IEEE Trans. Microw. Theory Techn., vol. 57, no. 12, pp. 3246-3253, Dec. 2009.
[14] S. Julrat, M. Chongcheawchamnan, T. Khaorapapong, O.
Patarapiboolchai, M. Kririksh and I. D. Robertson, “Single -Frequency-Based Dry Rubber Content Determination Technique for In-Field
Measurement Application,” IEEE Sensors J., vol. 12, no. 10, pp. 3019-3030, Oct. 2012.
[15] A. H. Sklavounos and N. S. Barker, “Liquid-permittivity measurement using a rigorously modeled overmoded cavity resonator,” IEEE Trans. Microw. Theory Techn., vol. 62, no. 6, pp. 1363-1372, Jun. 2014. [16] A. I. Gubin et al., “Whispering-gallery-mode resonator technique with
microfluidic channel for permittivity measurement of liquids,” IEEE Trans. Microw. Theory Techn., vol. 63, no. 6, pp. 2003-2009, Jun. 2015. [17] T. Chretiennot, D. Dubuc, and K. Grenier, “A microwave and
microfluidic planar resonator for efficient and accurate complex
permittivity characterization of aqueous solutions,” IEEE Trans. Microw. Theory Techn., vol. 61, no. 2, pp. 972-978, Feb. 2013. [18] J. Roelvink, S. Trabelsi, and S. O. Nelson, “A planar transmission-line
sensor for measuring the microwave permittivity of liquid and semisolid
biological materials,” IEEE Trans. Instrum. Meas., vol. 62, no. 11, pp. 2974-2982, Nov. 2013.
[19] T. Chen, D. Dubuc, M. Poupot, J.-J. Fournié, and K. Grenier, “Accurate nanoliter liquid characterization up to 40 ghz for biomedical applications:
toward noninvasive living cells monitoring,” IEEE Trans. Microw. Theory Techn., vol. 60, no. 12, pp. 4171-4177, Dec. 2012.
[20] D. Zhao, G. Rietveld and G. M. Teunisse, “A Multistep Approach for Accurate Permittivity Measurements of Liquids Using a Transmission
Line Method,” IEEE Trans. Instrum. Meas., vol. 60, no. 7, pp. 2267-2274, July 2011.
[22] A. Ebrahimi, W. Withayachumnankul, S. Al-Sarawi, and D. Abbott,
“High-sensitivity metamaterial-inspired sensor for microfluidic dielectric
characterization,” IEEE Sensors J., vol. 14, no. 5, May 2014.
[23] L. Benkhaoua, M. T. Benhabiles, S. Mouissat, and M. L. Riabi,
“Miniaturized quasi-lumped resonator for dielectric
characterization for liquid mixture,” IEEE Sensors J ., vol. 16, no. 6, pp. 1603-1610, Mar. 2016.
[24] K. Aydin, I. Bulu, K. Guven, M. Kafesaki, C. M. Soukoulis, and E. Ozbay, “Investigation of magnetic resonances for different spitl-ring
resonator parameters and designs,” New J. Phys., vol. 7, pp. 168.1-168.15, 2015.
[25] J. B. Hasted, Liquid water: Dielectric properties, in Water A Comprehensive treatise, Vol. 1, Ed. F. Franks (Plenum Press, New York, 1972) pp. 255-209.
[26] R. Buchner, J. Barthel and J. Stauber, The dielectric relaxation of water
between 0˚C and 35 ˚C, Chemical Physics Letters, 306 (1999) 57-63. [27] National Center for Biotechnology Information. “PubChem Compound
Database; CID=702.” https://pubchem.ncbi.nlm.nih.gov/compound/702, [Nov. 5, 2017].
Nonchanutt Chudpooti (S’16) received a
first-class honors B.Sc. degree from the
King Mongkut’s University of
Technology North Bangkok in 2012, where he is currently pursuing the Ph.D. degree supported by the Thailand Research Fund through the Royal Golden Jubilee Ph.D. Program. His main research focuses on the application of microwave microfluidic sensors, millimeter-wave substrate integrated circuit applications and Substrate Integrated Waveguide (SIW) applications. He was a recipient of the Best Presentation Award and Young Researcher Encouragement Award at the Thailand-Japan Microwave in 2015 and 2016, respectively.
Evans Silavwe (S’14) received his MSc
in Communications Engineering in 2008 from the University of Leeds and B.Eng in 2001 from the University of Zambia. He is currently working towards the Ph.D. degree in the Institute of Microwave and Photonics at the University of Leeds. His research interests include development of microwave microfluidic sensors and millimetre wave substrate integrated circuit applications.
Prayoot Akkaraekthalin (M’98)
received the B.Eng. and M.Eng. degrees in Electrical Engineering from King Mongkut's University of Technology North Bangkok (KMUTNB), Thailand, in 1986 and 1990, respectively, and the Ph.D. degree from the University of Delaware, Newark, USA, in 1998. From 1986 to 1988, he worked as a research and development engineer at the Microtek Company, Thailand. In 1988, he joined the Department of Electrical Engineering, KMUTNB. His current research interests include RF/microwave circuits, wideband and multiband antennas, telecommunications, and sensor systems. Professor Prayoot is the author and co-author of over 40 international journals, over 200 conference papers, and 4 books/book chapters.
and EEAAT Associations Thailand. He was the chairman for the IEEE MTT/AP/ED Thailand Joint Chapter from 2007 to 2010 and the vice president and the president of ECTI Association, Thailand from 2012 to 2013 and from 2014 to 2015, respectively. He is now the head of the Senior Research Scholar Project under the grant from Thailand Research Fund (2015-2017).
Ian D. Robertson (F’12) received his
BSc (Eng.) and PhD degrees from King’s
College London in 1984 and 1990, respectively. From 1984 to 1986 he worked in the GaAs MMIC Research Group at Plessey Research, Caswell. After that he returned to King's College, initially as a Research Assistant working on the T-SAT project and then as a Lecturer, leading the MMIC Research Team and becoming Reader in 1994. In 1998 he was appointed Professor of Microwave Subsystems Engineering at the University of Surrey, where he established the Microwave Systems Research Group and was a founder member of the Advanced Technology Institute. In June 2004 he was appointed to the Centenary Chair in Microwave and Millimetre-Wave Circuits at the University of Leeds. He was Director of Learning and Teaching from 2006 to 2011 and Head of School from 2011 to 2016. He has 30 years of teaching experience in RF and microwave engineering and has published over 400 peer reviewed research papers. He edited the book MMIC Design published by the IEE in 1995 and co-edited the book RFIC & MMIC Design and Technology, published in English 2001 and in Chinese in 2007. He was elected Fellow of the IEEE in 2012 in recognition of his contributions to MMIC design techniques and millimetre-wave system-in-package technology. He was General Technical Programme Committee Chair for the European Microwave Week in 2011 and 2016.
Nutapong Somjit (M’10) received the