This is a repository copy of
On the effect of Nb on the microstructure and properties of
next generation polycrystalline powder metallurgy Ni-based superalloys
.
White Rose Research Online URL for this paper:
http://eprints.whiterose.ac.uk/151099/
Version: Published Version
Article:
Christofidou, K.A. orcid.org/0000-0002-8064-5874, Hardy, M.C., Li, H.-Y. et al. (14 more
authors) (2018) On the effect of Nb on the microstructure and properties of next generation
polycrystalline powder metallurgy Ni-based superalloys. Metallurgical and Materials
Transactions A, 49 (9). pp. 3896-3907. ISSN 1073-5623
https://doi.org/10.1007/s11661-018-4682-4
eprints@whiterose.ac.uk https://eprints.whiterose.ac.uk/
Reuse
This article is distributed under the terms of the Creative Commons Attribution (CC BY) licence. This licence allows you to distribute, remix, tweak, and build upon the work, even commercially, as long as you credit the authors for the original work. More information and the full terms of the licence here:
https://creativecommons.org/licenses/
Takedown
If you consider content in White Rose Research Online to be in breach of UK law, please notify us by
TOPICAL COLLECTION: SUPERALLOYS AND THEIR APPLICATIONS
On the Effect of Nb on the Microstructure
and Properties of Next Generation Polycrystalline
Powder Metallurgy Ni-Based Superalloys
KATERINA A. CHRISTOFIDOU , MARK C. HARDY, HANG-YUE LI, CHRISTOS ARGYRAKIS, HIROTO KITAGUCHI, NICHOLAS G. JONES, PAUL M. MIGNANELLI, ALISON S. WILSON, OLIVIER M.D.M. MESSE´, ED J. PICKERING, ROBERT J. GILBERT, CATHIE M.F. RAE, SUYANG YU, ALEX EVANS, DANIEL CHILD, PAUL BOWEN, and HOWARD J. STONE
The effect of Nb on the properties and microstructure of two novel powder metallurgy (P/M) Ni-based superalloys was evaluated, and the results critically compared with the Rolls-Royce alloy RR1000. The Nb-containing alloy was found to exhibit improved tensile and creep properties as well as superior oxidation resistance compared with both RR1000 and the Nb-free variant tested. The beneficial effect of Nb on the tensile and creep properties was due to the microstructures obtained following the post-solution heat treatments, which led to a higher c¢ volume fraction and a finer tertiary c¢ distribution. In addition, an increase in the anti-phase-boundary energy of the c¢phase is also expected with the addition of Nb, further contributing to the strength of the material. However, these modifications in thec¢distribution detrimentally affect the dwell fatigue crack-growth behavior of the material, although this behavior can be improved through modified heat treatments. The oxidation resistance of the Nb-containing alloy was also enhanced as Nb is believed to accelerate the formation of a defect-free Cr2O3scale. Overall, both developmental alloys, with and without the addition of
Nb, were found to exhibit superior properties than RR1000.
https://doi.org/10.1007/s11661-018-4682-4 ÓThe Author(s) 2018
I. INTRODUCTION
T
HE development of Ni-based superalloys has been inextricably linked to the needs of the aerospace industry and its regulators. Jet engines are continuously evolving to provide improved efficiencies combined withreduced environmental and acoustic emissions.[1,2] How-ever, while aerodynamic design optimizations of aircraft engines are possible, the service conditions that can be tolerated by the superalloys used in the critical turbine parts limit the efficiency improvements that can be achieved.
The requirement for increased temperatures and stresses in service and reduced engine core sizes consti-tutes a complex set of conflicting properties for the materials considered for disk rotor applications. For example, the desire to reduce the size and weight of components requires materials with higher strength levels, which can be achieved through a fine grain size and increases in the volume fraction of the strengthening
c¢phase. Yet such microstructures cause deterioration in the time dependent crack growth performance of the material that may limit the design life of the component. While the overall alloy chemistry is critically important in obtaining these properties, microstructure is equally significant in ensuring that the alloy delivers the desired high temperature performance. Alloy design and pro-cessing is further complicated by likely changes in microstructure and phase stability as a result of long duration exposures at temperatures above 700°C.
KATERINA A. CHRISTOFIDOU, NICHOLAS G. JONES, PAUL M. MIGNANELLI, ALISON S. WILSON, CATHIE M.F. RAE, and HOWARD J. STONE are with the Department of Materials Science and Metallurgy, University of Cambridge, 27 Charles Babbage Road, Cambridge, CB3 0FS, UK. Contact e-mail: kc424@cam.ac.uk MARK C. HARDY, CHRISTOS ARGYRAKIS, ROBERT J. GILBERT, and DANIEL CHILD are with Rolls-Royce plc, Derby, DE24 8BJ, UK. HANG-YUE LI, HIROTO KITAGUCHI, SUYANG YU, and PAUL BOWEN are with the Metallurgy and Materials, The University of Birmingham, Pritchatts Road, Birmingham, B15 2TT, UK. OLIVIER M.D.M. MESSE´ is with the Department of Materials Science and Metallurgy, University of Cambridge and also with the Oerlikon Am GmbH, Feldkirchen, Germany. ED J. PICKERING is with the School of Materials, The University of Manchester, Oxford Road, Manchester, M13 9PL, UK. ALEX EVANS is with Rolls-Royce Deutschland, Blankenfelde-Mahlow, Germany.
Herein, two novel polycrystalline alloy compositions capable of withstanding the inimical conditions of the next generation of jet engines are presented.[3] The design methodology and the key factors considered in developing these compositions are discussed. In addi-tion, particular emphasis is placed upon the character-ization of the alloy microstructures and the effects that these features have on the overall material properties, such as oxidation resistance, tensile and creep behavior as well as dwell crack growth.
II. ALLOY DESIGN METHODOLOGY
A state of the art powder metallurgy (P/M) alloy RR1000 was used as the basis for the design of new alloys, and the properties of RR1000 served as the benchmark against which the developmental alloys were compared. The compositions of the alloys, as well as that of RR1000, are provided in TableI. One of the first objectives of the study was to increase the volume fraction of the c¢ precipitates without compromising the solution heat treatment window available, i.e., without causing a significant decrease in the gap between the solidus and c¢ solvus temperatures. How-ever, any increase in the concentration of c¢ forming elements inevitably increases thec¢solvus temperature, particularly if Cr is reduced to avoid the formation of detrimental topologically close packed (TCP) phases. Therefore, judicious alloying with a separate element that lowers the c¢ solvus temperature was crucial. To this end, the Co-Ti system was identified as a promising alloying concept as both elements are common addi-tions to superalloys, with Ti being a potentc¢former, while Co strengthens the c matrix by reducing the stacking fault energy and is also known to depress the
c¢solvus temperature. In addition, a stable L12
precip-itate, Co3Ti, is known to form within Co-Ti alloys,
which is stronger to higher temperatures in its single crystal form than its Ni3Al equivalent.[4–6]Despite this,
superalloys based purely on the Co-Ti system are unsuitable for service at temperatures over 800 °C due to limits in their microstructural stability or their balance of mechanical properties.[7–10]However, co-ad-ditions of Co and Ti to conventional Ni-based super-alloys have been found to confer significant strength benefits to the material.[11–15] In one such study, increasing the concentration of Co and Ti in RR1000 resulted in yield and tensile strengths that were~20 pct greater than that of conventional RR1000. Although the creep life of the modified alloys was found to deteriorate when tested at 750°C and 460 MPa as a
result of the precipitation of the TCPrphase along the grain boundaries.[16]
Consequently, microstructural stability, and in par-ticular the propensity of the alloys towards the precip-itation of the r phase, was another key objective considered throughout the development of these alloys. In order to mitigate the detrimental effects on phase stability observed as a result of the increased Co level, the concentrations of the known r phase forming elements Cr and Mo were reduced. In turn, the lower levels of solid solution strengthening resulting from the reduction in Mo were balanced by an increase in the content of other refractory metal elements,i.e.,W and Ta. However, this strategy to suppress the formation of deleterious phases leads to concerns with regards to the oxidation resistance of the alloys. In particular, the relatively low Cr:Ti ratio of these alloys would be expected to reduce the oxidation resistance to below that of RR1000, as Ti is known to increase the vacancy concentration within the protective chromia scale.[17] Therefore, the oxidation performance of these alloys at 800°C was evaluated in detail, in order to understand their response to environmental factors.
In addition, the effect of Nb on the microstructure of alloys with higher Co concentrations was of particular interest to this study. Conventionally, Nb in Ni-based superalloys has been reported to partition preferentially towards thec¢phase, substituting onto the Al sublattice, causing an increase in thec¢anti-phase boundary (APB) energy and, hence, a concomitant increase in alloy strength.[18,19] In addition, alloys with elevated concen-trations of Nb have been shown to exhibit finer secondary and tertiaryc¢distributions, further increas-ing the strength of the material.[20,21]Nb has also been reported to be a potent solid solution strengthening element when present in sufficient concentrations in the
[image:3.594.65.571.640.697.2]c matrix.[22,23] However, high Nb concentrations have been linked to the precipitation of thed and g phases, both of which are generally considered deleterious to alloy properties.[22,23] Furthermore, recent phase stabil-ity studies on alloys with high Nb concentrations have revealed an increased propensity towards the formation of the r phase.[24,25] The effects of Nb on oxidation resistance are also of particular concern, as several studies have reported aggravated environmental attack in simple ternary Ni-based systems and this has been linked to accelerated crack propagation characteris-tics.[26,27]However, in studies of more complex systems and commercially available alloys, Nb has not been found to adversely affect environmental resistance,[26] and in some cases it has even been shown to be beneficial.[28,29] Hence, the precise effects of Nb on
Table I. Nominal Alloy Compositions of the Two Alloys Studied and RR1000 (Atomic Percent)[3,46]
At. Pct Ni Co Cr Mo W Al Ti Ta Nb Hf B C Zr
RR1000 bal. 17.9 16.5 3.0 0.0 6.35 4.3 0.6 0.0 0.16 0.08 0.13 0.03
Alloy A bal. 23.0 15.1 1.8 0.5 6.25 4.8 1.2 0.0 0.00 0.15 0.14 0.05
polycrystalline Ni-based alloys remains elusive and its particular contributions to alloy properties and microstructure was evaluated for Alloys A and B.
Throughout the development program, modeling was used extensively in order to narrow down the number of promising compositions to be manufactured and tested. In particular, the CalPhaD method was used to deter-mine the equilibrium phases expected and the relevant transition temperatures, such as the c¢ solvus. The commercially available ThermoCalc software was used for all calculations with the TCNi6 database. No phases were suspended in any of the calculations, so as to not inadvertently suppress information that might be useful in determining compositional suitability. Each element in the alloys was varied within a defined range and the effect on key measures of the microstructure was evaluated. In addition, calculations of the variation in mole fraction of all equilibrium phases as a function of temperature were performed for the considered compo-sitions. For Alloys A and B, a~50 pct volume fraction of c¢was expected, whereas the calculations indicated a much lower fraction with the formation of the g phase predicted to occur in both alloys. However, Alloy B was predicted to form a higher fraction ofc¢compared with Alloy A. The formation of thelandrTCP phases was also predicted to occur in both alloys, with a much higher fraction of therphase calculated in Alloy B. The higher r solvus temperature calculated for Alloy B suggested that this alloy would be more microstruc-turally unstable following long duration exposures at high temperatures. However, while thermodynamic modeling can provide useful insights into the relative microstructural behavior of alloys, the complexity of the compositions considered, along with the relative kinetics of precipitation of the phases forming complicate the interpretation and fidelity of the results, and hence, care must be taken when such tools are utilized.[30]
III. EXPERIMENTAL
Powders for the development compositions and RR1000 were produced at ATI Powder Metals (Robin-son) in Pittsburgh, PA. These were sieved to a final screen size of 270 mesh (53lm), filled into mild steel containers and hot isostatically pressed (HIP). Speci-mens from the as HIP material were used to provide an initial estimate of thec¢solvus temperature through heat treatments and metallographic examination prior to the forging operations. Bars of 76 mm in height and about 67 mm in diameter were subsequently machined from the compacts for isothermal forging at ATI Forged Products in Cudahy, WI. The bars were forged down to a height of about 18 mm. Following the forging, samples were taken from the material in order to determine the c¢ solvus, solidus and liquidus tempera-tures of the alloys through differential scanning calorimetry (DSC). A 5-mm-diameter, 1–mm-thick disk was taken from each alloy and tested on a Netzsch 404 calorimeter with a heating/cooling rate of 10 °C min 1 under flowing argon. In addition, circular section test
piece cylinders were electrodischarge machined from the pancake forgings. These were solution heat treated at 1170°C for 1 hour (above the c¢ solvus temperature) and cooled at rates of 1°C/s for RR1000 and at 1.4°C/s for the developmental compositions, to ~1050°C, followed by air cooling. RR1000 cylinders were given a post-solution heat treatment (P-SHT) of 16 hours at 760°C and air cooled. An average grain size of 22±10lm was obtained for Alloy A, Alloy B was
found to have an average grain size of 18±8lm and
RR1000 exhibited an average size of 17±8lm, all of
which were determined using the equivalent area diam-eter method. The effect of P-SHT onc¢distributions of the developmental alloys was evaluated following a P-SHT of 800°C for 4 hours (P-SHT1) and a second P-SHT comprising aging at 800°C for 4 hours with additional aging at 850°C for 2 hours (P-SHT2). Image analysis in order to determine the c¢ particle sizes was performed using the ImageJ software on high resolution secondary electron images obtained on a Zeiss GeminiSEM.
Following the material production, round bar spec-imens, with a gage diameter of 4 mm and a gage length of 20 mm, were machined from the heat treated cylin-ders (P-SHT1) for tensile and creep testing. Tensile testing was performed at room temperature, 600°C, 700°C and 800°C at a constant strain rate of 10 2s 1. Similarly, creep testing was performed at 650°C and a stress of 1000 MPa, at 700°C and a stress of 800 MPa, at 750°C and a stress of 600 MPa and at 800°C and a stress of 300 MPa. Due to the limited availability of round bar specimens that could be extracted from the forged compacts, only a single specimen per testing condition could be evaluated, and hence, no indications of errors are provided herein.
Dwell crack growth resistance was evaluated on square-bar (595 mm2) test pieces, in the P-SHT2
condition (1170°C/1 hour, 800°C/4 hours and 850°C/ 2 hours), and subjected to axial tensile loading. This test piece geometry was selected as it leads to the formation of a quarter-circle profile crack initiated from a corner notch under fatigue loading, which subsequently grows under dwell conditions. Dwell fatigue was evaluated in air under constant amplitude loading at 700°C with a stress ratio of 0.1. A hold period of 3600 seconds was introduced at the peak load (12 kN) of a trapezoidal loading waveform, with the remaining loading segments set to 1 seconds. Dwell crack growth data were mea-sured for a DK range of ~ 15 to 30 MPaÖm. The baseline data of fatigue crack growth were also mea-sured from the same test piece at the beginning and end of dwell fatigue loading by shortening the hold time at peak load to 1 second. The extent of crack growth during testing was evaluated using the direct current potential difference (d.c.p.d.) technique.
2091092 mm3. The surfaces of the cuboids were
polished to a finish ofRaof between 0.2 and 0.3lm and
exposed at 800°C for 100, 300 and 1000 hours. Fol-lowing exposure, the samples were gold coated before being electrolytically nickel plated in a Watts bath using a solution of NiSO4Æ6H2O, NiCl2Æ6H2O, and H3BO3at a
constant current density of 50 mA cm 2. The Ni-plated samples were mounted and polished following standard metallographic procedures and imaged in backscattered electron mode using a Philips XL30 field emission gun scanning electron microscope (SEM). In addition, in order to evaluate the effect of the diffusion affected zone, the samples were electrolytically etched in a 10 pct phosphoric acid solution and imaged in secondary electron mode.
The long term microstructural stability of the alloys was assessed following 3000 hour exposures at 800°C. For these prolonged exposures, samples were encapsu-lated in argon backfilled evacuated quartz ampoules. The resulting microstructures were investigated using Scanning Electron Microscopy coupled with Energy Dispersive Spectroscopy (SEM-EDS) to identify addi-tional phases forming in the alloys. Samples were prepared following standard metallographic procedures, and imaged on an FEI Nova NanoSEM 450 equipped with a Bruker XFlash 6 solid-state EDS detector.
IV. RESULTS
A. Microstructure in the Post-solution Heat Treated Conditions
The secondaryc¢solvus, solidus and liquidus temper-atures of the developmental alloys were determined through differential scanning calorimetry. Thec¢solvus temperatures for the two alloys were not found to differ significantly, with that of Alloy A determined to be
~1140°C, whereas for Alloy B, the c¢ solvus
temper-ature was found to be slightly higher,~1145°C. These results were also in line with the initial c¢ solvus temperatures determined through metallographic exam-ination of heat treated samples from the HIP material. The variation observed in the solidus and liquidus temperatures of the two developmental alloys was more pronounced, Alloy A exhibited a solidus temperature of
~1200°C and a liquidus temperature of ~1355°C,
whereas Alloy B displayed a solidus temperature of
~1210°C and a liquidus temperature of~1335°C.
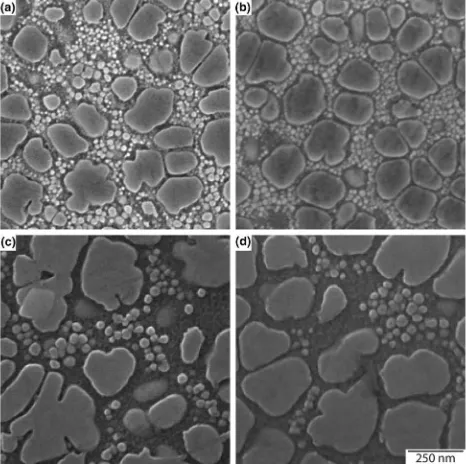
The microstructures of Alloys A and B in the two heat treated conditions (P-SHT1 and P-SHT2) are shown in Figure1. Image analysis indicated that both alloys contained secondary c¢ of similar sizes. Following P-SHT1 Alloy A exhibited an average secondaryc¢size of ~155 nm, while Alloy B had an average size of
~150 nm. Following P-SHT2, the average secondary c¢
size for Alloy A was found to be ~195 nm and that of Alloy B was ~ 215 nm. The secondary c¢ fraction following both P-SHTs for Alloy B was found to be
~50 pct, whereas that of Alloy A was found to be in the
range between ~ 45 and 49 pct. The tertiary c¢
distributions of the two alloys were also found to
coarsen with the additional aging step employed in P-SHT2 (Figures1(c) and (d)), and an average tertiary
c¢ size in the range of~ 20 and 22 nm was obtained in both alloys. However, Alloy A was found to exhibit markedly different behavior compared with Alloy B following P-SHT1, as Alloy A showed a bimodal tertiary c¢ distribution with coarser and finer particles forming in the microstructure, in contrast to the monomodal, fine distribution obtained in Alloy B.
B. Mechanical Properties
A summary of the tensile properties of the alloys is presented in Figure2 along with reference data for RR1000 with a similar grain structure. The data indicated that both developmental alloys were stronger than RR1000 across all of the temperatures tested. Between the two developmental alloys, Alloy B was found to possess greater strength than Alloy A across all of the conditions considered.
An overview of the creep data is shown in Figure3. In order to compare the data from the different alloys, the testing stress was plotted against the Larson–Miller parameter (P), which takes into account both the time to rupture and testing temperature. The Larson–Miller Parameter was calculated using Eq. [1], where t is the time to rupture in hours andhis the testing temperature in degrees Celsius. Higher P values indicate a greater resistance to creep deformation.
P¼ 1
[image:5.594.331.564.36.268.2]1000ð273þhÞðlogð Þ þt 28Þ ½1
Fig. 1—Representative microstructures of Alloy A (a and c) and
Alloy B (b and d) following P-SHT1 (a and b) and after the
The results indicated that both developmental alloys were more resistant to creep deformation than RR1000, with Alloy B displaying a superior resistance than Alloy A, although under lower-stress/higher-temperature con-ditions, their behaviors began to converge.
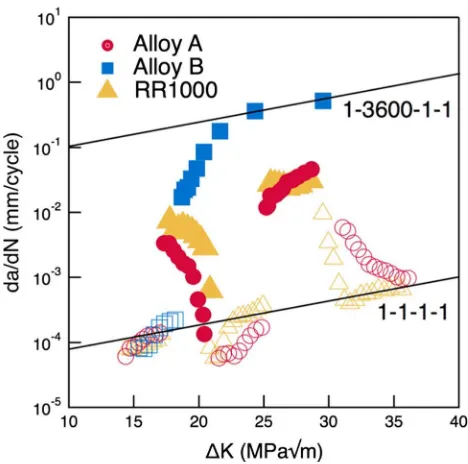
Dwell crack growth testing at 700°C of the develop-mental alloys was performed on material subjected to P-SHT2 in order to minimize the effect of differing c¢
distributions on the obtained results. The crack growth rates obtained are shown in Figure4 along with comparison data from RR1000. It can be seen that crack growth rates under dwell fatigue loading are highly variable at this temperature, ranging from the baseline fatigue crack growth (under a 1-1-1-1 loading waveform) to 3 orders of magnitude greater when subjected to dwell conditions (under a 1-3600-1-1 loading waveform). Alloy A was found to behave similarly to RR1000, whereas the crack growth rates obtained from Alloy B were found to be much more severe. Further aging of Alloy B, either at higher temperatures or for extended times at 850 °C, was found to significantly improve the performance of the alloy under dwell fatigue condition. However, further characterization of the alloys, their resulting c¢
distributions and the inherent strength of the cand c¢
phases is required before the dwell crack growth behavior of the two developmental alloys may be rationalized.
C. Oxidation
[image:6.594.292.525.36.190.2]In order to understand the oxidation behavior of these alloys, furnace exposures were performed at 800°C and samples examined following 100, 300 and 1000 hours. Cross-sectional images of the oxide forma-tions following the 100 and 1000 hour exposures are shown in Figure5, along with an image for coarse grained RR1000 obtained following oxidation for
Fig. 2—0.2 pct yield strength (a) and tensile strength (b) results
[image:6.594.29.264.36.383.2]obtained for Alloys A and B and compared with RR1000 as a function of testing temperature.
Fig. 3—Creep results for Alloys A and B and RR1000 obtained
from tests at 650°C, 700°C, 750°C and 800°C and converted to
the Larson–Miller Parameter for comparison.
Fig. 4—Dwell fatigue crack growth resistance curves (da/dNvsDK)
obtained at 700°C. Open symbols represent the 1-1-1-1 loading
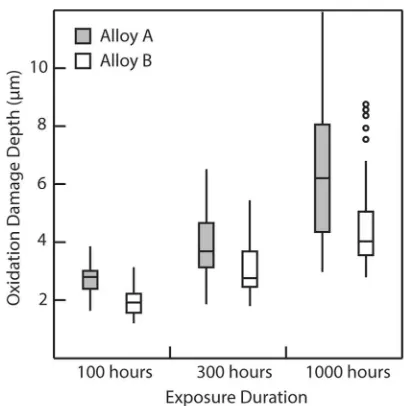
[image:6.594.292.526.259.491.2]100 hours at 800°C. Both developmental alloys were found to exhibit similar features at all exposure times, with SEM-EDS analysis indicating that a continuous chromia scale had formed on the oxidizing surface and that the dark contrast features extending into the bulk were alumina fingers. While the oxide species have not been characterized in detail, the relative thicknesses of the oxide layers and the depth to which the alumina fingers extend were statistically analyzed to provide a measure of the overall oxidation damage in each alloy. These results are shown in a box and whisker plot format in Figure5, in which the box region represents the interquartile range (IQR) (the center 50 pct of the data falls within this region), the lower fence represents the lowest 10 pct of data, whereas the upper fence indicates the 90 pct data limit. The median value of overall damage (the second quartile) is shown as the line running through the box representing the IQR. Values lying outside the lower and upper fences of the data are outliers and are represented by circle markers in Figure6. Taking into account the data in both Figures5
[image:7.594.74.555.35.365.2]and 6, it can be seen that Alloy B showed consistently
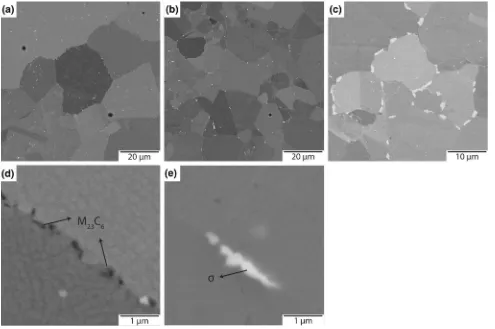
Fig. 5—Cross-sectional examination of the oxidation damage observed in Alloys A and B and RR1000 for comparison, following exposures at
800°C. Subfigures (a) and (d) show backscattered electron images of the damage observed on Alloy A following exposures of 100 and 1000 h (a
and d, respectively). Subfigures (bande) show the equivalent exposures on Alloy B, where (b) corresponds to the backscattered electron image
of the damage observed following 100 h and (e) shows an etched sample imaged in secondary electron mode of the oxidation damage observed
following 1000 h at 800°C in order to illustrate the sub-scale oxidation affected zone. In subfigure (c) a cross section of the oxidation damage
identified on RR1000 following exposure at 800°C for 100 h is shown for comparison.
[image:7.594.345.548.468.671.2]better resistance to oxidation than Alloy A. In addition, Alloy B appeared to be approaching a near-steady-state of damage, with the rate of change in the median oxidation depth as a function of time slowing. Con-versely, the rate of oxidation damage depth accumula-tion in Alloy A appeared to be increasing. However, it is important to note that regions of break-away damage were identified in Alloy B, as indicated by outliers Figure 6, which might present a problem for longer duration exposures. In addition to forming an oxide scale and alumina fingers, needle like features were also observed immediately beneath the oxide scale, as shown in the micrograph from Alloy B following 1000 hours at 800 °C in Figure5, which was etched to aid their observation. These features extended to a depth that was equivalent to that of the diffusion affected zone and were found to be enriched in Ti. Consequently, they were believed to be TiN, in line with features seen in similar superalloys.[17]The thickness of the zone affected by TiN precipitation was found to be similar in both alloys, and therefore it was not included in the overall oxidation damage analysis presented in Figure6. Critically, both alloys displayed oxidation damage that was superior to that observed in RR1000, details of which can be found in the works of Taylor et al.[31]and Cruchleyet al.[32]
D. Microstructural Stability
[image:8.594.35.530.337.666.2]Images from both developmental alloys following the long term exposure of 3000 hours at 800°C are shown in Figure7, along with an image for RR1000 following an exposure of 2500 hours at 800 °C for comparison. While both developmental alloys showed the formation of grain boundary phases, the precipitating species were found to differ. The precipitating phase along the grain boundaries in Alloy A appeared dark-gray in the backscattered electron image, whereas in Alloy B, the most prominent grain boundary phase appeared bright. These differing contrasts suggest a relative composi-tional difference, indicating that the primary grain-boundary phase in Alloy B is composed of heavier elements compared with the precipitating phase in Alloy A. EDX measurements of the relative compositions of the phases in the two alloys showed that the phase precipitating in Alloy A was enriched in Cr and depleted, relative to the matrix, in Co and Ni. In contrast, the grain boundary phase precipitating in Alloy B was found to be enriched in Mo. Although additional crystallographic information is required to conclusively establish the nature of these phases, the EDX measurements along with the morphology and contrast observed suggest that the precipitating phase in
Fig. 7—Backscattered electron images of Alloys A and B, and RR1000 for comparison, following long duration exposures at 800°C.
Subfigures (a) through (c) show low-magnification images of phase precipitation along the grain boundaries in Alloy A (a) and Alloy B (b)
following a 3000 h exposure and RR1000 (c) following 2500 h at 800°C. The grain boundary precipitating phase in Alloy A is shown in greater
Alloy A is the M23C6 carbide, whereas the phase
forming in Alloy B is the TCP r phase. Importantly, both alloys were found to exhibit improved phase stability compared with RR1000, in which the forma-tion of the r phase (blocky, bright phase shown along the grain boundaries in Figure7(c)) was found to occur. In addition to the key grain boundary phases, the formation of MC carbides was observed in both alloys, as well as small fractions of other borides and carbides. The relative fraction of MC carbides (bright phase interspersed intergranularly, was found to be higher in Alloy A compared with Alloy B.
V. DISCUSSION
The preliminary results obtained for Alloys A and B have indicated that both these materials exhibit a combination of properties that are superior to those of RR1000. In addition, comparing the performance of Alloy A to that of Alloy B has provided a wealth of data to elucidate the role of Nb in superalloys with elevated concentrations of Co.
In Figure1, the microstructures of both alloys fol-lowing P-SHT1 (solutioned and aged at 800°C for 4 hours) and P-SHT2 (as P-SHT1 with an additional aging at 850°C for 2 hours) were presented. The addition of Nb was found to lead to an increased c¢
fraction in Alloy B. In addition, while both alloys were found to behave similarly following P-SHT2, the tertiary
c¢ distributions were markedly different following P-SHT1, with Alloy B exhibiting a finer tertiary c¢
distribution, consistent with reports in the literature.[21] The effect of Nb on the material microstructure following P-SHT1 can also be used to understand the tensile behavior of the alloys. The superior tensile properties exhibited by Alloy B are believed to be directly correlated to the Nb content, due to both its effect on increasing the c¢ APB energy as well as in increasing thec¢fraction and producing a refinement in the tertiaryc¢distribution. While the effect of Nb on the lattice parameters of the c and c¢ phases has yet to be quantified, it is not believed to have a sufficient impact on the lattice misfit to further affect the tensile behavior of the alloy through coherency strengthening. Interest-ingly, Nb was found to have a greater influence on the yield strength of the material and less so on the tensile strength, suggesting a reduction in the extent of work hardening due to possible increases in the c stacking fault energy and the relative c¢ distribution. A slight contribution from the smaller grain size obtained in Alloy B is also believed to be observed, as Alloy A exhibited an average grain size of 22 ±10lm compared
to 18±8lm obtained in Alloy B. The improvement in
tensile behavior of both alloys compared with RR1000 was primarily attributed to the increase in thec¢fraction and the additional strengthening of the c¢ precipitates arising from increases in thec¢APB energy.
As with the tensile behavior, the creep performances of both Alloys A and B were found to be superior to that of RR1000. This was again believed to be primarily a result of the increase in thec¢fraction in the new alloys
compared with RR1000. The solid solution hardening of the two alloys was also considered to be a contributing factor to the creep behavior observed, as the addition of W and the increase in the Co-content may compensate for the reduction in Mo. In addition, it is expected that the increase in Co reduces the stacking fault energy of thecmatrix, further improving the creep performance. The increased alloying content in Alloys A and B may also have an effect on the diffusion rates within the alloys, and the increase in B and Zr, which segregate to the grain boundaries or form grain boundary particles may also decrease the grain boundary diffusion. The superior properties of Alloy B compared with Alloy A may be attributed to the differences in the microstruc-ture (following P-SHT1) as a result of the addition of Nb, such as the increasedc¢fraction and the changes in the tertiaryc¢distribution, as well as the effect that Nb will have on the partitioning behavior of the other elements in the alloy, which will further influence the stacking fault energy of the matrix and the bulk diffusion. However, care must be taken as prolonged exposures at 800°C were found to cause the precipita-tion of therphase in Alloy B, which is known to reduce the creep performance of similar alloys.[16]
In order to further elucidate the mechanisms govern-ing the tensile and creep behavior of the developmental alloys, and assess the applicability of current models to novel alloy compositions, modeling of the mechanical properties was performed, and the data were compared to the experimental results. The model described by Parthasarathyet al.[33]was used in the predictions for the yield strength of the alloys. Several coefficients were required in the model, which were estimated using values available in the literature. The description of the solid solution strengthening contribution was based on the model proposed by Gypen and Deruyttere,[34] which assumes a superposition of strengthening of individual solutes based on their concentration in the matrix and precipitate phase, both of which were calculated using thermodynamic models in ThermoCalc. The empirical solid solution strengthening coefficients were derived from the work of Mishima et al.[35] at 77 K and were further calibrated versus temperature using the trough model proposed by Rothet al.[36]An average grain size of 15lm was utilized in the calculations along with a grain size coefficient of 450 MPalm 1/2, as proposed by Parthasarathyet al.[33]As the experimental yield strength data available was obtained on material aged using P-SHT1, the average secondaryc¢size obtained through image analysis for this condition (Figures1(a) and (b)) was used as an input for the models,i.e., the secondaryc¢
noticeable difference in the predicted yield strengths. In addition, the APB energy for the alloys considered was calculated using the approach of Cruddenet al.[37]
The predicted yield strength behavior of the two developmental alloys is shown in Figure8(a), and was found to be in good agreement with the experimental data. Importantly, the model correctly captures the superiority of Alloy B over Alloy A, which was attributed to an increase of ~80 MPa as a result of solid solution strengthening effects of both the matrix and c¢ phase due to the addition of Nb, as well as the effect of Nb on the APB energy of thec¢phase.
Using the same input parameters as for the yield strength model, the creep model proposed by Galindo-Nava et al.,[38] with modifications to account for thec¢distributions, was employed to assess the creep behavior at 700°C and 800 MPa of the two develop-mental alloys and compare the predicted results to the experimental data obtained. Due to the restricted number of testing blanks available, the creep testing was limited to the material in the P-SHT1 condition, however, the models were also used to assess the creep performance of the alloys following P-SHT2 in order to illustrate the trends expected to arise in the creep behavior of the alloys due to microstructural differences. In the creep model formulations, the interparticle spacings of the secondary and tertiary c¢ distributions was accounted for using Eqs. [2] and [3].
1 k¼
1 ksec
þ 1
ktert
½2
k¼ 2p
3f
12d
2; ½3
wherekis the interparticle spacing for each population,
i.e.,ksec is the interparticle spacing for the secondaryc¢
population and ktert is the interparticle spacing for the tertiary c¢ distribution. Each interparticle distribution spacing is calculated using Eq. [3], in which f is the volume (area) fraction of the distribution and d is the average particle diameter. As both the secondary and tertiary c¢ distributions would be expected to coarsen during creep testing, the models also account for this behavior using a typical Lifshitz–Slyozov–Wagner (LSW) dependency.[39,40] For P-SHT 1, the secondary
c¢fraction was taken to be~ 41 pct for Alloy A and~45 pct for Alloy B, with ac¢diameter in the region~152 nm taken for both alloys. For the tertiaryc¢distribution for P-SHT1, a volume fraction of 2.5 pct was assumed for both alloys with a tertiaryc¢diameter ranging between 10 to 15 nm. The predictions obtained from the model
bFig. 8—(a) Yield-strength predictions using microstructural
information from material aged using P-SHT1 for Alloy A and Alloy B (solid lines) overlaid with experimental data (filled circles)
and (b) creep curves modeled at 700°C and 800 MPa (presented as
solid lines with the accompanying experimental data presented as
points) for material in the P-SHT1 condition, and (c) comparison of
creep model predictions (obtained for 700°C and 800 MPa) for
for P-SHT1 are shown in Figure8(b) along with the experimental creep curves obtained under the same testing conditions (700°C and 800 MPa). Similarly to the yield strength model, the creep model correctly captured the superiority of Alloy B over Alloy A. In addition, a better agreement between the predicted and experimental behaviors was recorded for Alloy B. These results further highlighted the dependency of creep behavior on the tertiaryc¢distribution, as a monomodal tertiary distribution was assumed for both alloys, whereas, experimental observations of the microstruc-ture prior to testing (Figures1(a) and (b)) indicated that Alloy A displayed a bimodal tertiary distribution, which will have a profound effect on dislocation motion. To further elucidate the effect of microstructure on the creep properties (at 700°C and 800 MPa), predictions for the creep behavior using the microstructural param-eters obtained following P-SHT2 were obtained and compared against the model predictions for P-SHT1, Figure8(c). The secondary c¢ distribution for Alloy A aged using P-SHT2 was taken to consist of a volume fraction of 46 pct and an averagec¢diameter of 195 nm, whereas a volume fraction of 50 pct secondary c¢
particles with an average dimeter of 215 nm was used for Alloy B. The tertiaryc¢volume fraction was taken to be 2 pct for both alloys following P-SHT2 with the tertiaryc¢size in Alloy A set to 25 nm and that of Alloy B set to 20 nm. As expected, the model predictions indicated that following P-SHT2, the creep behavior for Alloy B remains superior to that of Alloy A. However, this superiority is not as pronounced as that observed following P-SHT1 as a result of the coarser secondaryc¢
distribution obtained in Alloy B. Importantly, the models capture the microstructural dependence of the creep behavior as using the inputs from P-SHT2 resulted in inferior creep performance being predicted from both alloys in this condition compared to that obtained using P-SHT1, Figure8(c).
The contrasting dwell crack growth behavior observed for the developmental alloys at 700°C is likely a result of the environmental embrittlement—‘‘creep brittle’’ mechanism, as found in coarse grain RR1000 at similar temperatures.[41] The improved dwell crack growth resistance in Alloy A (similar to that of RR1000) is believed to be a result of the lower c¢
fraction observed in this alloy and the reduced creep strain accumulation at 700°C (and high stresses) compared with Alloy B. These properties allow for easier matrix deformation and hence, crack tip stress relaxation and blunting. In addition, the slightly larger grain size obtained in Alloy A (22±10lm) compared
to that of Alloy B (18 ±8 lm) would further improve
the resistance of the alloy to dwell crack growth. While, dwell fatigue crack growth is often attributed to embrittlement due to the oxidation occurring in front of the crack tip, no evidence of this mechanism was found in these alloys. However, a detailed, high resolu-tion examinaresolu-tion of the crack tip oxides was not performed, and hence, further work is required to elucidate the effects of oxidation on the dwell fatigue crack growth in these alloys. Nevertheless, from the data available, the dwell fatigue crack growth behavior of
both Alloys A and B was similar to that observed in RR1000,[42]where a transition from a ‘‘creep brittle’’ to a ‘‘creep ductile’’ mechanism was found to occur in the range between 700°C and 750 °C.[41]It is believed that at higher temperatures the behavior of both alloys will be adequate as some degree of creep deformation around the crack tip can effectively relieve the crack tip stresses. In contrast, at temperatures where creep deformation is relatively slow, the rates of dwell crack growth could be expected to increase. Tailoring the microstructure of the alloys towards delivering improved tensile performance at elevated temperatures, such as increasing the c¢ volume fraction, could affect dwell fatigue crack performance significantly below the transition temperature (creep brittle to creep ductile). Due to limitations of available material for further testing, it was not possible to systematically study the alloys at different temperatures and with modified microstructures. However, it was observed that the crack growth rates of Alloy B at 700°C could be improved by overaging, in particular of the tertiaryc¢distribution, for example though an additional heat treatment at 900°C or through a longer exposure at 850°C. This poses additional questions about the effect of the tertiary c¢
distribution on dwell fatigue performance. However, further testing is required to comprehensively understand the behavior of these alloys under dwell conditions and this is beyond the scope of this paper.
The improved oxidation resistance of the alloys compared with RR1000 has been an unexpected out-come. The Cr concentration in both alloys was lower than that of RR1000, while Ti, often linked to poor oxidation performance,[17] was marginally increased. Therefore, the oxidation performance of the alloys was expected to suffer. The extent to which the oxidation resistance has been improved is not yet clear, as additional results are required. However, several hypotheses are discussed. One of the key compositional modifications in the developmental alloys has been the increase in the concentration of Ta. Ta, in concentra-tions low enough to avoid the formation of Ta2O5, has
been shown to improve the oxidation of alumina forming Ni-based superalloys, although the exact mech-anisms remain elusive.[42–44] It has been hypothesized that Ta may contribute towards the formation of protective Ta-containing spinel oxides. In addition, Ta lowers oxygen activity, which further improves oxida-tion resistance. It is also known that Ta has a strong interaction with Al, aiding in the faster formation of a continuous Al2O3 scale.[42] It is therefore conceivable,
that given the similarities in formation of Al2O3 and
Cr2O3 in Ni-superalloys, Ta may also assist in
establishing a protective Cr2O3 scale in polycrystalline
alloys more rapidly, hence improving the oxidation resistance. In addition to the perceived beneficial effects of Ta, the increased concentration of Co in the developmental alloys will increase the partitioning of Cr to the c matrix,[45] as will the increased c¢
The additional improvements in oxidation resistance observed in Alloy B, the Nb-containing variant, were believed to be derived from the addition of Nb, which bares many similarities to Ta as they both exhibit the same oxidation states. In studies of simple quaternary and quinary Ni-alloys, additions of up to 2 wt pct Nb (equivalent to the 1 at. pct found in this study) were found to improve the oxidation resistance of the alloys significantly by promoting the formation of a dense continuous Cr2O3scale, which was also found to exhibit
an improved surface morphology.[28,29]In addition, Nb was also found to decrease the solubility of oxygen in the alloy and limit the diffusion at the metal/oxide interface, which may be used to explain the reduced depth of alumina finger ingress observed in Alloy B. Therefore, these characteristics of Nb, along with the increase in Cr in the matrix as a result of the additional increase in thec¢fraction, are believed to be contributing to the improved oxidation characteristics observed in Alloy B.
The microstructural stability of the alloys against the formation of deleterious intermetallic phases was exam-ined following a 3000 hour exposure at 800°C, and indicated a fundamental difference in the behavior of the two developmental alloys. While both alloys were found to exhibit a lower fraction of grain boundary precipi-tates than RR1000 after an equivalent exposure length, Alloy A was found to predominantly form M23C6
carbides, whereas Alloy B showed the precipitation of the r phase. In the absence of additional data, in particular the composition of the constituent phases, it is difficult to understand the difference in behavior of the two alloys. It is likely that the increased volume fraction of the c¢ in Alloy B leads to an increase in the Cr concentration in thec. Similarly, the addition of Nb will also necessarily change the composition of thec¢phase, and hence, the relative partitioning of other r forming elements like Mo, and in some cases Co, may also increase in the matrix. The change in composition of the matrix will therefore change the thermodynamic sus-ceptibility of the alloy towards the formation of the r
phase at this temperature. Hence, it follows that the fact that Alloy A does not show the formation of therphase is due to the fact that the solvus temperature of this phase is lower than the exposure temperature of 800°C. This conclusion was further supported by the thermo-dynamic modeling results. However, care must be taken when using thermodynamic modeling as several discrep-ancies have been identified between thermodynamic predictions and the experimental data obtained. The g
phase was predicted to occur in both alloys under equilibrium conditions but no g was experimentally observed. It is believed that this discrepancy is due to the definition of thegphase in ThermoCalc, which does not take into account the destabilizing effect that Co has on the precipitation of this phase. The prediction that both alloys would form the g phase does, therefore, also explain the discrepancy observed in the calculated and experimentally obtained c¢ fraction. Similarly, the l
phase was not experimentally identified in either alloy, and it is believed that this is due to the low fraction of carbide and boride species predicted by the
thermodynamic models. The presence of carbides and borides will consume the key chemical constituents that form l phase and, hence, may be responsible for the absence of this phase in the experimental alloys.
VI. CONCLUSIONS
The effect of Nb on the microstructure and properties of two P/M Ni-based superalloys, comprising elevated concentrations of Co, was evaluated, and the results compared with the Rolls-Royce alloy RR1000. Data from all alloys were obtained from tensile and creep testing, dwell fatigue crack growth at 700°C, as well as following oxidation and phase-stability studies at 800°C. The initial microstructures of the two develop-mental alloys were examined following two post-solu-tion heat treatments, P-SHT1 comprising 4 hours at 800°C, while P-SHT2 employed a further aging step at 850°C for 2 hours. Under these conditions, Nb was found to influence the c¢ distribution by increasing the volume fraction of precipitates and reducing the tertiary
c¢ size following P-SHT1, which when combined with the increase in the APB energy of thec¢, led to improved tensile and creep properties being obtained in Alloy B. Little difference was observed between the microstruc-tures following P-SHT2. Material from the P-SHT2 condition was used in dwell fatigue testing, which indicated a marked difference in the behaviors of the developmental alloys, with Alloy A exhibiting improved resistance to dwell crack growth compared with Alloy B when tested at 700°C. While the effect of microstructure could not be isolated to understand the difference in behavior, the crack growth resistance of Alloy B was found to be enhanced by applying overaging heat treatments to the material. The oxidation resistance of both developmental alloys was found to be superior to that of RR1000 despite the lower Cr:Ti ratios in these alloys, which was believed to be due to the addition of Ta. The Nb-containing Alloy B was also found to exhibit improved environmental resistance compared with the Nb-free Alloy A. These observations were theorized to be due to Ta and Nb enhancing the formation kinetics of the Cr2O3 scale, as well as
decreasing the solubility of oxygen in the alloy and limiting the diffusion at the metal/oxide interface, although further work is required to confirm these hypotheses. Following long–term aging at 800°C for 3000 hours, both developmental alloys were found to show grain boundary precipitation: Alloy A exhibited the formation of M23C6 particles along the grain
boundaries, whereas the addition of Nb in Alloy B led to the formation of the deleterious r phase at the temperature examined. Comparing the experimentally obtained data with the thermodynamic predictions for the alloys indicated that care must be taken when such tools are used in the design of new compositions. In particular, an improvement of the definitions of the g
in much lower fractions than those experimentally observed that further affected the predicted TCP phases expected to form in the material. Nevertheless, thermo-dynamic calculations are useful in helping to clarify some of the trends observed in the alloys. In summary, both developmental alloys were found to exhibit supe-rior properties than RR1000, with the Nb-containing variant displaying improved tensile and creep behaviors and environmental resistance compared with the Nb-free developmental alloy.
ACKNOWLEDGMENTS
This work was supported by the Rolls-Royce/EPSRC Strategic Partnership under EP/H022309/1, EP/H500 375/1, and EP/ M005607/1. The Swansea Materials Research and Testing Ltd (SMaRT) is thanked for per-forming the tensile and creep tests. The original research data are available at https://doi.org/10.17863/CAM. 23125.
OPEN ACCESS
This article is distributed under the terms of the Creative Commons Attribution 4.0 International License (http://creativecommons.org/licenses/by/4.0/), which permits unrestricted use, distribution, and reproduction in any medium, provided you give appropriate credit to the original author(s) and the source, provide a link to the Creative Commons license, and indicate if changes were made.
REFERENCES
1. European Commission:European Aeronautics: a Vision for 2020, 1st ed., Office for publications of the European Communities, Luxembourg, 2001, p. 14.
2. European Commission:Flightpath 2050 Europe’s Vision for Avia-tion, 1st ed., Publications office of the European Union, Luxem-bourg, 2001, p. 15.
3. M.C. Hardy, H.J. Stone, N.G. Jones, K.A. Christofidou, and S. Neumeier,A Nickel Alloy,European Patent EP 3 042 973 B1, 2017. 4. H. Bibring and R. Graf: Academie Des Sciences, Physique des
Me´taux, 1961, pp. 4160–62.
5. R.W. Fountain and W.D. Forgeng:Trans. Metall. Soc. AIME, 1959, vol. 215, pp. 998–08.
6. T. Takasugi, S. Hirakawa, O. Izumi, S. Ono, and S. Watanabe: Acta Metall., 1987, vol. 35, pp. 2015–26.
7. J.M. Blaise, P. Viatour, and J.M. Drapier:Cobalt, 1970, vol. 49, pp. 192–95.
8. P. Viatour, J.M. Drapier, and D. Coutsouradis: Cobalt, 1973, vol. 3, pp. 67–74.
9. C. Rogister, D. Coutsouradis, and L. Habraken: Cobalt, 1967, vol. 34, pp. 3–10.
10. C.H. Zenk, I. Povstugar, R. Li, F. Rinaldi, S. Neumeier, D. Raabe, and M. Go¨ken:Acta Mater., 2017, vol. 135, pp. 244–51. 11. C.Y. Cui, A. Sato, Y. Gu, and H. Harada:Metall. Mater. Trans.
A, 2005, vol. 36A, pp. 2921–27.
12. C.Y. Cui, A. Sato, Y.F. Gu, D.H. Ping, and H. Harada:Metall. Mater. Trans. A, 2006, vol. 37A, pp. 3183–90.
13. C.Y. Cui, Y.F. Gu, D.H. Ping, T. Fukuda, and H. Harada:Mater. Trans., 2008, vol. 49, pp. 424–27.
14. Y. Gu, H. Harada, C. Cui, D. Ping, A. Sato, and J. Fujioka:Scr. Mater., 2006, vol. 55, pp. 815–18.
15. Y.F. Gu, T. Fukuda, C. Cui, H. Harada, A. Mitsuhashi, T. Yokokawa, J. Fujioka, Y. Koizumi, and T. Kobayashi:Metall. Mater. Trans. A, 2009, vol. 40A, pp. 3047–50.
16. N.G. Jones, K.A. Christofidou, P.M. Mignanelli, J.P. Minshull, M.C. Hardy, and H.J. Stone:Mater. Sci. Technol., 2014, vol. 30, pp. 1853–61.
17. S. Cruchley, H.E. Evans, M.P. Taylor, M.C. Hardy, and S. Stekovic: Corros. Sci., 2013, vol. 75, pp. 58–66.
18. Superalloys II, 1st ed., C.T. Sims, and N.S. Stoloff, and W.C. Hagel, eds.,Superalloys II, 1st ed., Wiley, New York, 1987, pp. 104–10. 19. A.K. Jena and M.C. Chaturvedi:J. Mater. Sci., 1984, vol. 19,
pp. 3121–39.
20. P.M. Mignanelli, N.G. Jones, M.C. Hardy, and H.J. Stone:Mater. Sci. Eng. A, 2014, vol. 612, pp. 179–86.
21. H. Hisazawa, Y. Terada, F. Adziman, D. Crudden, D. Collins, D. Armstrong, and R. Reed:Metals, 2017, vol. 7, pp. 71–82. 22. E. C. Guo and F. J. Ma:Superalloys 1980 (Fourth International
Symposium), 1980, pp. 431–38.
23. S. Antonov, M. Detrois, D. Isheim, D. Seidman, R.C. Helmink, R.L. Goetz, E. Sun, and S. Tin: Mater. Des., 2015, vol. 86, pp. 649–55.
24. S. Antonov, J. Huo, Q. Feng, D. Isheim, D.N. Seidman, R.C. Helmink, E. Sun, and S. Tin:Mater. Sci. Eng. A, 2017, vol. 687, pp. 232–40.
25. S. Antonov, J. Huo, Q. Feng, D. Isheim, D.N. Seidman R.C. Helmink, E. Sun, and S. Tin:Scr. Mater., 2017, vol. 138, pp. 1–4.
26. C.T. Sims:High Temp. Technol., 1984, vol. 2, pp. 185–201. 27. M. Gao, D. J. Dwyer, and R. P. Wei: inSuperalloys 718, 625, 706
and Various Derivatives, 1994, pp. 581–92.
28. F. Weng, H. Yu, C. Chen, and K. Wan: Surf. Interface Anal., 2014, vol. 47, pp. 362–70.
29. F. Weng, H. Yu, K. Wan, and C. Chen: J. Mater. Res., 2014, vol. 29, pp. 2596–03.
30. K.A. Christofidou, N.G. Jones, E.J. Pickering, R. Flacau, M.C. Hardy, and H.J. Stone:J. Alloys Compd., 2016, vol. 688, pp. 542–52. 31. M.P. Taylor, H.E. Evans, S. Stekovic, and M.C. Hardy:Mater.
High Temp., 2012, vol. 29, pp. 145–50.
32. S. Cruchley, M.P. Taylor, H.E. Evans, M.C. Hardy, and D.J. Child:Mater. Sci. Technol., 2014, vol. 30, pp. 1884–89.
33. S. I. Parthasarathy, D. M. Rao, D. Dimiduk:Superalloys 2004 (Tenth International Symposium),2004, pp. 887–96.
34. L.A. Gypen and A. Deruyttere: J. Mater. Sci., 1977, vol. 12, pp. 1028–33.
35. Y. Mishima, S. Ochiai, N. Hamao, M. Yodogawa, and T. Suzuki: Trans. Jpn. Inst. Met., 1986, vol. 27, pp. 648–55.
36. H.A. Roth, C.L. Davis, and R.C. Thomson:Metall. Mater. Trans. A, 1997, vol. 28A, pp. 1329–35.
37. D.J. Crudden, A. Mottura, N. Warnken, B. Raeisinia, and R.C. Reed:Acta Mater., 2014, vol. 75, pp. 356–70.
38. E.I. Galindo-Nava and C.M.F. Rae:Mater. Sci. Eng. A, 2016, vol. 651, pp. 116–26.
39. C. Wagner:Z. Elektrochem., 1961, vol. 65, pp. 581–91. 40. L.C. Brown:Acta Metall., 1989, vol. 37, pp. 71–77.
41. H.Y. Li, J.F. Sun, M.C. Hardy, H.E. Evans, S.J. Williams, T.J.A. Doel, and P. Bowen:Acta Mater., 2015, vol. 90, pp. 355–69. 42. S.W. Yang:Oxid. Met., 1981, vol. 15, pp. 375–97.
43. S.-J. Park, S.-M. Seo, Y.S. Yoo, H.W. Jeong, and H. Jang:Corros. Sci., 2015, vol. 90, pp. 305–12.
44. S.-J. Park, S.-M. Seo, Y.S. Yoo, H.W. Jeong, and H. Jang:J. Nanomater., 2015, vol. 2015, pp. 1–11.
45. S.C.H. Llewelyn, K.A. Christofidou, V.J. Araullo-Peters, N.G. Jones, M.C. Hardy, E.A. Marquis, and H.J. Stone:Acta Mater., 2017, vol. 131, pp. 296–04.
![Table I.Nominal Alloy Compositions of the Two Alloys Studied and RR1000 (Atomic Percent)[3,46]](https://thumb-us.123doks.com/thumbv2/123dok_us/1932680.152876/3.594.65.571.640.697/table-nominal-alloy-compositions-alloys-studied-atomic-percent.webp)