Int. J. Electrochem. Sci., 11 (2016) 5154 – 5164, doi: 10.20964/2016.06.72
International Journal of
ELECTROCHEMICAL
SCIENCE
www.electrochemsci.org
Simultaneous Determination of Clenbuterol and Salbutamol
with a Graphene-Nafion Nanocomposite Modified Electrode
Yanli Zhou1,2,*, Huanqing Zhang2, Zhu Chang1, Baoxian Ye2, Maotian Xu1,2,*
1
Henan Key Laboratory of Biomolecular Recognition and Sensing, College of Chemistry and Chemical Engineering, Shangqiu Normal University, Shangqiu 476000, China
2
College of Chemistry and Molecular Engineering, Zhengzhou University, Zhengzhou 450001, China
*
E-mail: zhouyanli@mails.ucas.ac.cn (Y. Zhou), xumaotian@sqnc.edu.cn (M. Xu).
Received: 14 March 2016 / Accepted: 13 April 2016 / Published: 4 May 2016
A highly sensitive electrochemical sensor for the simultaneous determination of clenbuterol (CLB) and salbutamol (SAL) was fabricated by the modification of graphene-Nafion (GN-Nafion) composite film on a glassy carbon electrode (GCE). Both CLB and SAL caused a pair of redox peaks at the GN-Nafion/GCE in 0.04 M Britton-Robinson buffer solution. Obvious anodic peak currents for the oxidation of both CLB and SAL were observed under the optimal condition. The difference of oxidation peak potentials for CLB and SAL was about 200 mV, which made it possible for simultaneous determination of these compounds using the GN-Nafion/GCE. The detection limit for CLB and SAL was 0.13 μM and 0.11 μM (S/N=3), respectively. The proposed method was applied to simultaneously detect CLB and SAL in pork meat with satisfactory results. Otherwise, the excellent reproducibility, stability and selectivity were obtained at the proposed electrode.
Keywords: clenbuterol; salbutamol; graphene; Nafion; nanocomposites; electrochemical sensor
1. INTRODUCTION
β2-agonists are phenylethanolamines, which have different substituent groups on the terminal
amino group and the aromatic ring [1]. According to the different substituent on the phenyl ring, β2
-agonists are divided into two types of aniline-type and phenol-type. β2-agonists have been utilized in
the symptomatic treatment of asthma and chronic bronchitis, as well as the prevention of exercise-induced asthma [2]. In the livestock industry, β2-agonists have been used as growth promoter. When
animals being fed, β2-agonists can improve growth rate and reduce carcass fat [3]. However, the
accumulation of β2-agonists in the body can enter the body through food, which may cause poisoning
ensure food safety. Nonetheless, driven by economic interests, the addition of illegal abuse of β2
-agonists never stops. Among them, clenbuterol (CLB, IUPAC name: 4-amino-3,5-dichloro-α-[[[1,1-di(methyl-d3)ethyl-2,2,2-d3]amino]methyl] Benzenemethanol) and salbutamol (SAL, IUPAC name: 2-(tert-butylamino)-1-(4-hydroxy-3-hydroxymethylphenyl)ethanol) are two important types and they exist simultaneously. Therefore, sensitive and simultaneous determination of CLB and SAL in various matrices are required to eliminate the abuse of the two β2-agonists.
At present, different analytical approaches have been developed for the β2-agonists detection
in animal feeds and animal tissues. These methods mainly include liquid chromatography, GC-MS capillary electrophoresis, enzyme-linked immunoassay and spectroscopy [5-11]. There methods have been developed to detect of β2-agonists in meat products. However, these methods are time-consuming
and require complicated and expensive instruments. It is very important to develop a rapid simple and sensitive method for determination of β2-agonists. Among them, electrochemical method has unique
advantages, such as high sensitivity, good selectivity, low instrument and fast analysis [12-15]. Boron-doped diamond electrode modified with pyrrole-DNA has been utilized as voltammetric sensor for CLB detection [16]. Huang et al. also have fabricated the polyaniline/poly (acrylic acid) and Au-hybrid graphene nanocomposites -modified electrode for the determination of SAL [17]. However, to date, there has been little simultaneous determination of CLB and SAL in the design of an electrochemical sensor.
On the other hand, graphene, a nano-carbon material with a two-dimensional monoatomic thick and a honeycomb lattice structure, has stimulated a vast amount of research in recent years [18]. Graphene is fairly stable at room temperature and has unique characteristics including high surface area (2630 m2∙g-1), remarkable electrical conductivity [19] (200,000 cm2∙V-1∙s-1), and high thermal conductivity (~5000W∙m-1∙K-1
). The electronic properties enable graphene to be a promising electrochemical material [20,21], which provides a new strategy to design electrochemical sensors and biosensors with high performances.
In this work, the simultaneous determination of CLB and SAL was reported at graphene-Nafion composite film modified GCE. The electrochemical responses of the fabricated electrode to simultaneous detection of CLB and SAL such as, sensitivity, linear range, selectivity, and stability were evaluated. The applicability of the electrode was demonstrated through determining CLB and SAL in real samples.
2. EXPERIMENTAL PART
2.1. Reagents and apparatus
CLBand salbutamolwere purchased from aladdin and used as reserve liquid. Nafion (wt, 5%) was purchased from the Shanghai HeSen Electric CO, Ltd. Graphite powder. H2SO4, NaNO3, KMnO4,
H2O2, HCl were purchased from Chinese Medicine Group chemical reagent CO, Ltd. All other
All electrochemical measurements were carried out on a CHI 660D electrochemical workstation (Chen-Hua, Shanghai, China) with a conventional three-electrode system. A bare or modified glassy carbon electrode (GCE), a platinum electrode, and a saturated calomel electrode (SCE) were used as working electrode, counter electrode, and reference electrode, respectively. The scanning electron microscope (SEM) image was performed with a Quanta 200 microscope (FEI Company, Netherlands). All experiments were performed at room temperature.
The high-performance liquid chromatography (HPLC) analyses were carried using an Agilent 1260 HPLC system. Chromatographic separation was perfomed on Agilent Eclipse C18 analytical columns (250 mm × 4.5 mm i.d, 5.0 µm). The mobile phase was acetonitrile + phosphate solution (pH 3.0) and the volume ratio was 30:70 at a flow rate of 1.0 mL min-1. The injection volume was 20 µL, and the detection wavelength of the detector was set at 202 nm. The external standard method was used to determine the accuracy of the modified electrode.
2.2. Synthesis of graphene oxide and graphene
Graphene oxide (GO) was prepared from the natural graphite powder according to Hummer’s method [22]. In brief, graphite powder, NaNO3, H2SO4 were added into the ice bath and stirred for 30
min, and then KMnO4 was added into the solution. After 60 min, the reaction temperature was 98 oC.
Then being stirred for 5 min, H2O2 were used until no bubbles. Finally, the mixture was filtered,
washed, centrifuged, and dissolved.
Graphene (GN) used in this work was prepared by electrochemical reduction of GO [23]. GO/GCE was reduced by cyclic voltammetry in phosphate buffer solutions. Thus, the GN modified electrode (GN/GCE) was constructed.
2.3. Preparation of GO-Nafion/GCE[24]
10 µL 5% Nafion solution and 200 µL prepared graphene oxide solution were diluted to 1 ml, followed by ultrasonication for 30 min to form a stable and homogenous solution, which was used as modified electrode material. Before modification, the bare GCE (3 mm in diameter) was polished with 0.3 µm and 0.05 µm alumina powder, and then sonicated with ethanol and ultrapure water in turn. The GO-Nafion/GCE was prepared by casting 5 µL of GO-Nafion complex solution onto GCE surface and dried under infrared lamp. Before using, the modified electrode is immersed in the buffer system for a few minutes, and the water is washed repeatedly to remove the loose nanocomposite material.
2.4. Sample preparation
Different pork samples purchased from local supermarkets. At first, 5 g of crushed pork was added into 10 mL 0.1 M HClO4 solution, then sonicated for 20 min and heated at 80 oC for 30 min
Finally, washed repeatedly with ethanol and 0.1 M HCl in turn, the actual sample can be obtained with BR buffer (pH 5).
3. RESULTS AND DISCUSSION
3.1. Characterization of GN-Nafion composites
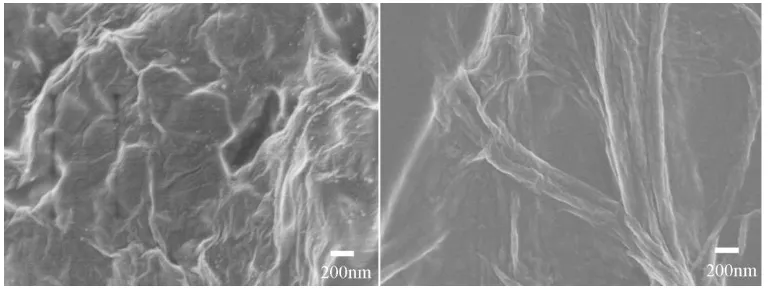
[image:4.596.106.492.397.541.2]The GN-Nafion composites, formed by ultrasonic, have good dispersion and stability. The composites were used as modified electrode material. Among them, graphene is expected to improve sensitivity, while Nafion plays a role in recognition due to the negatively charged surface. The composite was characterized by scanning electron microscopy (SEM). The result was shown in Fig. 1. It was clear that Nafion dispersed graphene show wrinkled flake-like shapes. This kind of sheet structure of graphene made it uneasy to split back to the graphite structure [26-28], which was good for keeping a large surface area of the electrode surface. This was further evidence that the GN-Nafion layer could provide a larger surface area and electrochemical surface area for the GCE. The results showed that the surface effective area of the electrode could be significantly improved after modification with composite materials.
Figure 1. The SEM image of graphene (left) and graphene-Nafion composite (right).
Fig. 2A shows the cyclic voltammetry curves of GCE (a), GN/GCE (b), Nafion/GCE (c), GN-Nafion/GCE (d) in 5 mM [Fe(CN)6]3-/4- 0.1 M KCl. The GCE showed a reversible redox process by
diffusion controlled with peak-to-peak separation (ΔEp) of 80 mV. When the electrode was modified
with Nafion, the redox peak disappeared completely, which could be owing to the negatively charged Nafion, blocking the electron transfer from solution to the electrode surface. However, when the electrode coated with GN-Nafion composites, the redox peak current was significantly enhanced compared with Nafion/GCE, which shows that the [Fe(CN)6]3-/4- electron transfer rate can be
effectively improved by good electrical conductivity of graphene.
insulating properties of the electrode/electrolyte interface. Fig. 2B shows the impedance diagrams of GCE (a), GO/GCE (b), Nafion/GCE (c), GN-Nafion/GCE (d). It can be seen, that the Ret value of
about 220 Ω at high frequency was obtained at the bare GCE. After coated with graphene, the electrode shows a small semicircle with a Ret of about 200 Ω, indicating that graphene is excellent
conductive material and accelerates the electron transfer. When Nafion is modified, the impedance value is obviously increased. This phenomenon may be caused by the Nafion film itself, blocking electronic conduction. However, the Ret decreases to about 360 Ω after the GN-Nafion modified
[image:5.596.107.482.222.363.2]electrode, suggesting good conductivity of graphene. This phenomenon also shows that the GN-Nafion composite material was successfully immobilized on the electrode.
Figure 2. (A) Cyclic voltammograms of 5 mM [Fe(CN)6]3- in 0.01 M KCl with scan rate 100 mV s-1
and (B) Nyquist plots of different electrodes from 10-1 to 105 Hz in 5 mM [Fe(CN)6]
3-/4-solution containing 0.01 M KCl. GCE (a); GN/GCE(b); Nafion/GCE (c); GN-Nafion/GCE (d).
Figure 3. Cyclic voltammograms of 0.01 mM CLB and 0.01 mM SAL obtained at GCE(a); GN/GCE(b); Nafion/GCE(c) ; GN-Nafion/GCE (d) in 0.4 M BR (pH 5) at scan rate of 100 mV s-1.
3.2. Electrochemical behavior of CLB and SAL
[image:5.596.219.380.438.576.2]
and SAL, respectively. The peak-to-peak separation (ΔEp) was 150 mV. The phenomenon could be
attributed to the negatively charged Nafion, absorbing the positively charged CLB to enhance the signal. Compared to the electrochemical performances at the Nafion/GCE, the oxidation peak currents of CLB and SAL obtained at GN-Nafion/GCE(c) increased significantly and the ΔEp value broadened
to 200 mV. The phenomenon indicated that graphene had excellent electrocatalytic activity and could improve the sensitivity of the experiment. This also further indicated that the composites could simultaneously determinate of CLB and SAL. This is mainly attributed to the negatively charged Nafion and the electrochemical properties of graphene.
3.3. Optimization of experimental conditions
Different experimental conditions (supporting electrolyte, pH, scanning speed), the GN-Nafion/GCE has different effects on electrochemical determination. Firstly, the effect of supporting electrolyte on the simultaneous determination of SAL and CLB has been performed. The experiment was examined in the HAc-NaAc, PBS, and BR buffer solutions, respectively. As showed in Fig. 4A, the maximum response occurred in the BR buffer solution. Thus, BR buffer solution was selected as the optimum supporting electrolyte in this study.
The pH is another important parameter for simultaneous determination of SAL and CLB. The effect of solution pH on electrochemical response at GN-Nafion/GCE towards the simultaneous determination of 0.01 mM SAL and 0.01 mM CLB was studied in the pH range from 2 to 8. From Fig. 4B, it appeared that the peak potential difference increased with the increasing pH. However, considering both the peak-to-peak separation and peak current value, pH 5 was chosen as the detection solution.
Figure 4. (A) Cyclic voltammograms of 0.01 mM CLB and 0.01 mM SAL obtained in PBS (black line); BR (red line); HAc-NaAc (green line) buffer solution with scan rate 100 mV s-1 at Nafion/GCE. (B) Plots of the peak potential difference of CLB and SAL vs. pH at GN-Nafion/GCE.
[image:6.596.121.476.492.632.2]
peak currents Ip was proportional to the square roots of the scan rate, and the linear regression equation
can be expressed as Ip = 2.23 - 30.05 v1/2 (R=0.992), indicating that the oxidation process is typical
adsorption controlled process in the scan rate from 10 to 150 mV s-1. For SAL, only an oxidation peak was observed, which proved once again that the oxidation process is a totally irreversible electrode process (Fig. 5B). The oxidation current followed the linear regression equations of Ip = -0.42-25.35
v1/2 (R=0.993). The result indicated that the oxidation process of SAL is adsorption-controlled in the selected scan rate range.
[image:7.596.105.466.192.327.2]Figure 5. Effect of scan rate on the oxidation behavior of 0.01 mM CLB (A) and 0.01 mM SAL(B). Scan rate increased from inner to outer (10~150 mV s-1). Inset: linear relationship of the oxidation peak current against v1/2
Figure 6. (A) DPV graphs of different concentration CLB in the presence of 40 mM SAL in BR (pH 5). CLB concentrations (from a to g): 2, 4, 8, 12, 20, 30, 40 µM; (B) DPV graphs of of different concentration SAL in the presence of 40 mM CLB in BR (pH 5). SAL concentrations (from a to f ): 2, 4, 8, 12, 30, 50 µM. The amplitude was 0.005 V and the pulse width was 0.1 s.
3.4. Individual determination of CLB and SAL
[image:7.596.115.480.404.541.2]
range of 2-40 μM with the linear regression equation of I= 0.032 - 0.100 c (R=0.990). Similarly, as shown in Fig. 6B, the oxidative peak current increased linearly with increasing the concentration of SAL with the linear regression equation of I = 0.027 - 0.074 c (R=0.994). Therefore, the proposed method allowed the simultaneous determination of CLB and SAL without interference with each other.
3.5. Simultaneous determination of CLB and SAL
In order to further evaluate the feasibility of the method, the simultaneous and quantitative determination of the two compounds at GN-Nafion/GCE was carried out by differential pulse voltammetry. As shown in Fig. 7, two well-defined oxidation peaks were observed at 0.920 V and 0.670 V, corresponding to the oxidation of CLB and SAL, respectively. The oxidation peak currents of CLB and SAL increased linearly with their concentration in the range of 0.4 µM~ 30 µM (I = -3.958-0.286 c) for CLB, and (I = -3.064-0.169 c) for SAL, with the correlation coefficients of 0.993 and 0.988, with the detection limit of 0.13 μM and 0.11 μM (S/N=3), respectively. Therefore, the simultaneously selective and sensitive determination of CLB and SAL was achieved at GN-Nafion/GCE. Compared with the recently reported methods including HPLC, LC-MC, CE, and molecularly imprinted electrode [3, 29-32], the GN-Nafion/GCE exhibited higher and comparative sensitivity. This behavior indicated the graphene modified on the electrode improved the electron transfer between the and the electrode. The above analysis of CLB and SAL in food samples require additional solid phase extraction to purify sample, making the operation complex. However, the sensitivity of proposed electrode was lower than the antibody or aptamer-modified electrode [33-35]. Note that the bioactive molecules is easy to lose activity, which reduce the low long-term stability. Thus, the sensitive and simple detection of CLB and SAL on the presented electrode is practical for the analysis for the real samples.
[image:8.596.193.405.500.670.2]
3.6. Reproducibility, stability and interference
The reproducibility was estimated by determining CLB and SAL in BR buffer solution using eight modified electrodes made independently. The relative standard deviation (RSD) of CLB and SAL were 3.11% and 4.09%, respectively. The low RSD value demonstrated that the modified electrode had excellent reproducibility. When the modified electrode was stored at 4 ºC for 48 h, only a small decrease of the oxidation peak current was observed with the signal change of 2.21% for CLB and 3.01% for SAL. The experiments indicated that the modified electrode had good stability for the simultaneous determination of CLB and SAL.
In addition, some common inorganic ions or organic compounds may affect on the simultaneous determination of CLB and SAL. It is found that 100-fold Ca2+, Zn2+, Mg2+, SO42-, NO3-,
glucose, starch, uric acid and ascorbic acid do not interfere with the determination, but 50-fold L-cysteine has certain influence on experimental determination.
3.7. Analytical applications
[image:9.596.49.549.566.669.2]To investigate the applicability of the proposed method for the simultaneous determination of CLB and SAL, pork meat samples were used as quantitative analysis. The treated sample was diluted 200 times with BR buffer solution, and the sample was determined by the above method. No CLB and SAL was detected in food samples. So the standard solution with different concentrations were spiked into the sample, and then the samples were analyzed under same conditions. Table 1 listed the results. The recoveries were 98.2%~103.5% and 98.6%~102.2% for CLB and SAL, respectively, which indicated the applicability and reliability of the modified electrode. Samples were also analysed by HPLC method, and the results are also showed in Table 1. These results suggest that the proposed method have the similar accuracy to HPLC method, and importantly the sample pretreatment and the operation by the proposed method are simpler than those by HPLC method.
Table 1. Determination of CLB and SAL in pork meat.
Sample no.
Sample Added (µM) This method HPLC
Found (µM) Recovery(%) Found (µM) Recovery(%)
1 CLB 6 5.89 98.2 6.03 100.5
SAL 6 5.92 98.6 5.91 98.5
2 CLB 14 14.5 103.5 14.6 104.3
SAL 14 14.2 101.4 14.2 101.4
3 CLB 18 17.8 98.9 18.3 101.7
SAL 18 18.4 102.2 17.6 103.4
4. CONCLUSIONS
composite of graphene and Nafion can effectively enhance the oxidation peak current and increase the peak potential difference. The difference between the peak potentials of CLB and SAL in at the modified GCE showed that the simultaneous determination of them was possible. The fabricated electrode showed excellent sensitivity, high selectivity, reproducibility and good stability. The method was applied to determine CLB and SAL in pork meat with satisfactory results, which indicated that the sensor has very good prospects application in the food safety.
ACKNOWLEDGEMENTS
This work was supported by grants from National Natural Science Foundation of China (Grant Nos. 21475084, 21572126 and 21405102), Program for Science & Technology Innovation Talents in Universities of Henan Province (16HASTIT005), and Innovation Scientists and Technicians Troop Construction Projects of Henan Province (No: 41).
References
1. P.L. He, Z.Y. Wang, L.Y. Zhang, W.J. Yang, Food Chem., 112 (2009) 707-714. 2. L. Shen, Z. Li, P.L. He, Electrochem. Commun, 12 (2010) 876-881.
3. W.Y. Cao, H.Y. Xiong, X. Gao, X.H. Zhang, S.F. Wang, Anal. Methods, 6 (2014) 2349-2355. 4. L. Wang, R. Yang, J. Chen, J.J. Li, L.B. Qu, P. B. Harrington, Food Chem., 164 (2014) 113-118. 5. M.I. Churchwell, C.L. Holder, D. Little, S. Preece, D.J. Smith, D.R. Doerge, Rapid Commun.
Mass Spectrom., 16 (2002) 1261-1265.
6. M. Machnik, H. Geyer, S. Horning, A. Breidbach, P. Delahaut, W. Schanzer, J. Chromatogr. B, 723 (1999) 147-155.
7. L.Y. Fan, Q. Chen, W. Zhang, C.X. Cao. Anal. Methods, 5 (2013) 2848-2853.
8. Y. Xie, H.F. Chang, K. Zhao, J.G. Li, H. Yang, L.Y. Mei, S.M. Xu, A.P. Deng, Anal. Methods, 7 (2015) 513-520.
9. H.Y. Xiong, C.H. Guo, P. Liu, W. Xu, X.H. Zhang, S.F. Wang, Anal. Chem., 86 (2014) 4729-4738. 10.P.L. He, L. Shen, R.Y. Liu, Z.P. Luo, Z. Li, Anal. Chem., 83 (2011) 6988-6995.
11.J.J. Song , M.X. Xu, K. Zhao, A.P. Deng, J.G. Li, Anal. Methods, 6 (2014) 3152-3158.
12.Y.J. Lai, J. Bai, X.H. Shi, Y.B. Zeng,Y.Z. Xian, J. Hou, L.T. Jing, Talanta, 107 (2013) 176-182. 13.J.C. Li, Q. Li, Y.Q. Zeng, T. Tang, Y.D. Pan, L. Li, RSC Adv., 5 (2015) 717-725.
14.G.W. He, X. Yang, Y.J. Hu, F. Zhang, Int. J. Electrochem. Sci., 9 (2014) 6962-6974.
15.W.Q. Bai, H.Y. Huang, Y. Li, H.Y. Zhang, B. Liang, R. Guo, L.L. Du, Z.W. Zhang, Electrochim. Acta., 117 (2014) 322-328.
16.J. Wu, X.L. Li, X.M. Wu, S.Y. Huan, G.L. Shen, R.X. Yu, Chem. J. Chinese, 21 (2005) 517-521. 17.J.D. Huang, Q. Lin, X.M. Zhang, X.R. He, X.R. Xing, W.J. Lian, M.M. Zuo, Q.Q. Zhang, Food
Res. Int., 44 (2011) 92-97.
18.F. Schedin, A.K. Geim, K.S. Novoselov, E.W. Hill, P. Blake, M.I. Katsnelson, K.S. Noveselov, Nat. Mater., 6 (2007) 183-191.
19.Y.L. Zhou, H. Dong, L.T. Liu, Y.Q. Hao, Z. Chang, M.T. Xu, Biosens. Bioelectron., 64 (2015) 442-448.
20.D. Li, M.B. Mueller, S. Gilje, R.B. Kaner, G.G. Wallace, Nat. Nanotech., 3 (2008) 101-105. 21.H.S. Yin, Y.L. Zhou, Q. Ma, S.Y. Ai, P. Ju, L.S. Zhu, L.N. Lu, Process Biochem., 45 (2010)
1707-1712.
22.J.F. Ping, Y.X. Wang, Y.B. Ying, J. Wu, Anal. Chem., 84 (2012) 3473-3479. 23.K.Q. Deng, J.H. Zhou, X.F. Li, Colloids. Surf. B, 101 (2013) 183-188.
25.C. Wu, D. Sun, Q. Li, K.B. Wu, Sens. Actuators B, 168 (2012) 178-184.
26.H.C. Schniepp, J.L. Li, M.J. McAllister, H. Sai, D.H. Adamson, R.K. Prud’homme, R. Car, D.A. Saville, I.A. Aksay, J. Phys. Chem. B, 110 (2006) 8535-8539.
27.X.B. Fan, W.C. Peng, Y. Li, X.Y. Li, S.L. Wang, G.L. Zhang, F.B. Zhang, Adv. Mater., 20 (2008) 4490-4493.
28.Y.L. Zhou, H. Dong, L.T. Liu, J. Liu, M.T. Xu, Biosens. Bioelectron., 60 (2014) 231-236.
29. W. Xu, P. Liu, C.H. Guo, C. Dong, X.H. Zhang, S.F. Wang, Microchim. Acta., 180 (2013) 1005-1011.
30.C. Cai, H. Cheng, Y. Wang, M. Yang, Y. Yang, Anal. Methods, 5 (2013) 4978-4983.
31.K. Yan, H. Zhang, W. Hui, H. Zhu, X. Li, F. Zhong, X. Tong, C. Chen, J. Food Drug Anal., 24 (2016) 277-283.
32.J.C. Domínguez-Romero, J.F. García-Reyes, R. Martínez-Romero, E. Martínez-Lara, M.L. Moral-Leal, A. Molina-Díaz, J. Chromatogr. B, 923-924 (2013) 128-135.
33.H. Wang, Y. Zhang, H. Li, B. Du, H. Ma, D. Wu, Q. Wei, Biosens. Bioelectron., 49 (2013) 14-19. 34.D. Chen, M.Yang, N. Zheng, N. Xie, D. Liu, C. Xie, D. Yao, Biosens. Bioelectron., 80 (2016)
525-531.
35.X. Lin, Y. Ni, S. Li, S. Kokot, Analyst, 137 (2012) 2086-2094.
![Figure 2. (A) Cyclic voltammograms of 5 mM [Fe(CN)6]3- in 0.01 M KCl with scan rate 100 mV s-1 and (B) Nyquist plots of different electrodes from 10-1 to 105 Hz in 5 mM [Fe(CN)6]3-/4- solution containing 0.01 M KCl](https://thumb-us.123doks.com/thumbv2/123dok_us/1840113.140257/5.596.219.380.438.576/figure-cyclic-voltammograms-nyquist-different-electrodes-solution-containing.webp)


