This is a repository copy of Adhesion between oppositely-charged polyelectrolytes. White Rose Research Online URL for this paper:
http://eprints.whiterose.ac.uk/110072/ Version: Accepted Version
Article:
Alfhaid, L., La Spina, R., Tomlinson, M.R. et al. (6 more authors) (2018) Adhesion between oppositely-charged polyelectrolytes. Journal of Adhesion, 94 (1). pp. 58-76. ISSN
0021-8464
https://doi.org/10.1080/00218464.2016.1265947
[email protected] https://eprints.whiterose.ac.uk/
Reuse
This article is distributed under the terms of the Creative Commons Attribution (CC BY) licence. This licence allows you to distribute, remix, tweak, and build upon the work, even commercially, as long as you credit the authors for the original work. More information and the full terms of the licence here:
https://creativecommons.org/licenses/
Takedown
If you consider content in White Rose Research Online to be in breach of UK law, please notify us by
Full Terms & Conditions of access and use can be found at
http://www.tandfonline.com/action/journalInformation?journalCode=gadh20
The Journal of Adhesion
ISSN: 0021-8464 (Print) 1545-5823 (Online) Journal homepage: http://www.tandfonline.com/loi/gadh20
Adhesion between oppositely-charged
polyelectrolytes
Latifah Alfhaid, Rita La Spina, Michael R. Tomlinson, Amy R. Hall, William D. Seddon, Nicholas H. Williams, Fabrice Cousin, Stanislav Gorb & Mark Geoghegan
To cite this article: Latifah Alfhaid, Rita La Spina, Michael R. Tomlinson, Amy R. Hall, William D. Seddon, Nicholas H. Williams, Fabrice Cousin, Stanislav Gorb & Mark Geoghegan (2016): Adhesion between oppositely-charged polyelectrolytes, The Journal of Adhesion
To link to this article: http://dx.doi.org/10.1080/00218464.2016.1265947
© 2016 The Author(s). Published by Informa UK Limited, trading as Taylor & Francis Group
Accepted author version posted online: 06 Dec 2016.
Submit your article to this journal
Article views: 135
View related articles
A
cce
pt
ed
M
an
uscr
ip
t
Adhesion between oppositely-charged polyelectrolytes
Latifah Alfhaid,1† Rita La Spina,1,2‡* Michael R. Tomlinson,1 Amy R. Hall,1§ William D.
Seddon,3 Nicholas H. Williams,3 Fabrice Cousin,4 Stanislav Gorb,2¶ and Mark Geoghegan1
1
Department of Physics and Astronomy, University of Sheffield, Hounsfield Road, Sheffield S3 7RH, United Kingdom
3
Evolutionary Biomaterials Group, Department of Thin Films and Biological Systems, Max Planck Institute for Metals Research, Heisenbergstrasse 3, Stuttgart 70569, Germany
3
Department of Chemistry, University of Sheffield, Brook Hill, Sheffield S3 7HF, United Kingdom
4
Laboratoire Léon Brillouin, CEA-CNRS, Saclay, 91191 Gif-sur-Yvette Cedex, France
Present addresses:
†
Department of Physics, University of Hail, Ha’il, Kingdom of Saudi Arabia
‡
Institute for Health and Consumer Protection, Joint Research Centre, Via Enrico Fermi 2749, 21027
Ispra, Italy
§
Biomedical Diagnostics Institute, Dublin City University, Glasnevin, Dublin 9, Ireland
¶
Department of Functional Morphology and Biomechanics, Christian-Albrecht-University of Kiel, Am
Botanischen Garten 1-9, 24098 Kiel, Germany
The adhesion between a grafted polyelectrolyte layer (brush) and a gel of an oppositely
charged polyelectrolyte has been measured as a function of applied pressure, and the
interface has been traced using neutron reflectometry. The interface (in aqueous
medium at pH 6) between the (polycationic) brush and the (polyanionic) gel has a
limited pressure-dependence, with a small amount of deformation of the interface at the
brush-gel contact. Brushes with a dry thickness of up to 13 nm exhibit weak adhesion
(measured using a mechanical force tester) with an adhesive failure when the gel is
A
cce
pt
ed
M
an
uscr
ip
t
geometry, whereby a polycationic brush is replaced with a polyanion and the
polyanionic gel is replaced with a polycation reveals that the pH-dependence of the
adhesion is moderately symmetric about pH 6, but that the maximum force required to
separate the polycation gel from the polyanion brush over the range of pH is greater
than that for the polycation brush and polyanion gel. The polyanion used is
poly(methacrylic acid) (PMAA) and polycations of poly[2-(diethyl amino)ethyl
methacrylate] (PDEAEMA) and poly[2-(dimethyl amino)ethyl methacrylate]
(PDMAEMA) were used.
Keywords: acid-base interactions; polymers; novel adhesives; pressure-sensitive;
surface roughness/morphology.
Subject classification codes: include these here if the journal requires them
1.
Introduction
Adhesion between polymer interfaces has attracted considerable interest, partly due to its
industrial importance [1, 2]. The use of ‘smart’ materials for adhesive applications has
become an area of some significant effort [3]. Charged polymers are of particular importance
in the field of adhesion because of the possibility of using an environmental stimulus, such as
salt, temperature, or pH to control the adhesion in situ, including the ability to reverse the
adhesion of a system that has already bonded [4, 5, 6, 7, 8, 9]. A true environmentally
switchable adhesive system should be able to detach spontaneously as the relevant
environmental parameter is changed, but for practical purposes a sufficient reduction in the
adhesion might suffice.
Aqueous adhesion involving charged polymers is controlled by a number of parameters
beyond pH or the ionic strength of the medium, such as the applied load or compression [6, 7,
8], the time during which the load is applied [8], the relative speed at which the two surfaces
are separated [8], temperature [4], and layer thickness [6]. The origin of the adhesion between
the polymers is likely to have different mechanisms depending on the materials used, and in
many cases more than one might contribute to the adhesion. These mechanisms would
include the interdigitation of components so that one layer becomes entangled in the other
[10, 11, 12], hydrogen bonding at the interface between the polymers [13, 14, 15, 16, 17], and
A
cce
pt
ed
M
an
uscr
ip
t
the pH dependence of the adhesion between oppositely charged polyelectrolytes with that
between two similar polyelectrolytes [19]. In that work, the frictional adhesion between two
grafted polyelectrolytes was measured using friction force microscopy. Such grafted layers
are frequently called polymer brushes [20, 21]. It was concluded that the adhesion between
oppositely charged polyelectrolytes of poly(methacrylic acid) (PMAA) and
poly[(2-dimethylamino)ethyl methacrylate] (PDMAEMA) is largely due to electrostatic interactions
and van der Waals forces, with the latter dominating when only one component is charged
and the former when both polymers are charged. Another possibility is that the free
polyelectrolyte chains can interpenetrate (interdigitate) across the boundary, as has been
described for neutral chains [11]. Such a mechanism was not considered in the FFM
measurements [19] because it is inappropriate for a brush-brush system, but it was dismissed
on the basis of neutron reflectometry data for a system of oppositely charged polyelectrolytes
[7].
Previous experiments investigating the adhesion between two polyelectrolytes of differing
charge, whilst useful, are not completely general and different mechanisms are likely to apply
for different systems. The mechanisms listed above include electrostatic interactions,
hydrogen bonding, van der Waals forces, and morphological properties, including chain
entanglements. In this work the adhesion between PMAA with two similar polycations
(PDMAEMA and poly[(2-diethylamino)ethyl methacrylate], PDEAEMA) is considered.
Neutron reflectometry is used to reveal the pressure dependence of the interfacial profiles of
PDEAEMA brushes in contact with a PMAA gel. The adhesive behavior of PDEAEMA and
PDMAEMA in contact with PMAA is presented using mechanical testing data.
2.
Experimental
2.1 Brush synthesis
All brushes were grafted from silicon wafers purchased from Prolog Semicor (Kiev) with the
following characteristics: diameter, 50 mm; dopant p-type boron with orientation (100) cut to
within 1°; and thickness, 4000 ± 50 µm. The surfaces used for PDMAEMA brushes were
cleaned by washing with acetone and toluene. They were then rendered hydrophilic by
exposure to a UV ozone lamp for an hour. An initiator layer could be deposited directly onto
(11-(2-bromo-2-A
cce
pt
ed
M
an
uscr
ip
t
methyl)propionyloxy)undecyl trichlorosilane (the initiator) in dry toluene. The resulting
substrate was therefore ready for PDMAEMA brush synthesis. A different procedure was
used for growing PDEAEMA and PMAA brushes. The silicon substrates were cleaned using
the RCA method [22], before immersion in a 2% (v/v) solution of ethanol and
3-aminopropyltriethoxysilane (APTES) (Aldrich: Dorset, UK; 98%) for 10 min. The substrate
was then rinsed with ethanol, dried under nitrogen, and annealed under vacuum at 120°C for
30 min. The substrate was then immersed in a solution of 3 mmol -bromoisobutyryl
bromide (Aldrich, 98%), and 3 mmol triethylamine (Aldrich, 99%) in 90 ml dichloromethane
(Aldrich, 99%) for 30 min. The initiator-coated substrate was finally rinsed with
dichloromethane and ethanol before drying under nitrogen.
Atom transfer radical polymerization (ATRP) was used for all brush syntheses [23, 24]. The
activating catalysts for polycation syntheses were copper(I) chloride (Aldrich, 99%) for
PDMAEMA brushes and copper(I) bromide (Aldrich, 99%) for PDEAEMA. CuCl was
purified before use by stirring overnight in glacial acetic acid before being filtered and
washed with ethanol and diethyl ether a few times and then left to dry under vacuum.
Copper(II) bromide (Aldrich, 97%) was used as the deactivating catalyst. The ATRP ligand
for polycation brush synthesis was 2,2’-bipyridyl (bipy; Aldrich, 99%). The solvent for
DEAEMA brush synthesis was a mixture of deionized (DI) water and methanol, whereas DI
water and acetone was used for synthesizing PDMAEMA brushes. CuBr, CuBr2, bipy,
acetone, methanol, DI water, 2-(dimethylamino)ethyl methacrylate (DMAEMA; Aldrich,
98%), and 2-(diethylamino)ethyl methacrylate (DEAEMA; 99%, Aldrich) were all used as
received. Solid species were degassed for between 10 and 30 min, whereas liquids were
purged under nitrogen for 20 min.
The synthesis of PDMAEMA brushes was carried out using a procedure described previously
[7]. The ATRP reaction is performed in a tightly sealed 200 ml flask which had been
degassed under nitrogen for 20 min. The reagents were added into the flask in the following
order: firstly the species in the solid state, 0.210 mmol of CuCl, 0.0062 mmol of CuBr2, and
0.4802 mmol of bipy. These were stirred and degassed for 10 min after which 5.3 ml of
acetone and 0.5 ml of DI water were added. Finally 0.0213 mol of the DMAEMA monomer
was added. The solution was left for an hour at room temperature in a nitrogen environment
to allow equilibration between the catalyst and the ligand. Afterwards the reaction solution
A
cce
pt
ed
M
an
uscr
ip
t
initiator layer. The reaction was performed at 35°C, which yielded a measured polymer
growth rate of 1.6 nm/h.
The synthesis of PDEAEMA brushes was carried out using a procedure described elsewhere
[25]. The solvent mixture, composed of 8 ml of methanol and 2 ml of DI water, was added to
54 mmol of DEAEMA. CuBr (0.9 mmol), CuBr2 (0.3 mmol), and bipy (2.5 mmol) were
subsequently added. The solution was stirred and degassed under nitrogen for 30 min and
then transferred into a sealed cell glass container that contained the initiator-coated silicon
substrate and left at room temperature for 24 h. Finally, the substrate was washed with
methanol and ethanol and then dried under a nitrogen stream. For neutron reflectometry
experiments, in order to determine contrast between the brush, gel, and aqueous environment,
deuterated DMAEMA (Polymer Source: Dorval, Canada) was used. The (ellipsometric) dry
thickness of the PDEAEMA brush was 27.8 ± 0.1 nm.
The synthesis of PMAA brushes followed a procedure described elsewhere [26]. A mixture
of 0.061 mol of tert-butyl methacrylate in 0.059 mol of 1,4-dioxane was prepared. PMDETA
(0.479 mmol) and CuCl (0.050 mmol) were added to this solution. After degassing, the
solution was transferred into a cell containing the silicon substrate and left overnight inside
an oil bath at 50ºC. The resulting poly(tert-butyl methacrylate) brush was hydrolyzed to
PMAA by immersing the substrate inside a solution of 1,4-dioxane (10 mL) and p-toluene
sulfonic acid (0.38 g) for 24 h at 100ºC. Finally, the PMAA brush was washed with
1,4-dioxane and ethanol and dried under a N2 stream. The dry thickness of the PMAA brush as
measured by ellipsometry was 32.2 ± 0.2 nm.
2.2 Gel synthesis
Both PDEAEMA and PMAA gels were synthesized using the relevant monomer (DEAEMA
or methacrylic acid) and 2,2’-azobis(2-methylpropionamide) dihydrochloride (AMPA;
Aldrich, 98%) as initiator. PMAA gels were made in DI water and PDEAEMA gels in a
mixture of DI water and methanol. N,N’-methylene bisacrylamide (MBA; Aldrich, 98%) was
used as the crosslinking agent for PMAA and ethylene glycol dimethacrylate (EGDMA;
Aldrich 98%) for PDEAEMA. The methacrylic acid (Aldrich, 98%) was distilled under
vacuum before use.
Different compositions of PMAA gels were made for their interaction with PDEAEMA and
A
cce
pt
ed
M
an
uscr
ip
t
solutions were initially prepared: one containing 0.80 mol of methacrylic acid mixed with
6.35 mmol of MBA (with a yield of approximately 123 monomers per crosslink), and the
other containing 8 ml of DI water and 4.76 mmol of AMPA. When the two solutions were
completely dissolved, they were stirred together for 20 min under nitrogen. The solution was
then transferred to an airtight glass mold that had been degassed for 1 h under nitrogen. The
reaction was performed for 45 min in a preheated oven at 90°C. After the reaction was
completed, the hydrogels were placed in water and then washed in acid and then under basic
conditions to remove any residual starting materials, and finally equilibrated to the required
pH. For gels that were used for experiments with PDEAEMA brushes the compositions used
were 0.55 mol methacrylic acid (1.4 × 10⁴ monomers per crosslink), 0.23 mol AMPA 0.01
mmol, and 0.04 mmol MBA in 10 ml DI water. After mixing, the degassed solution was
transferred into a special sealed glass container and then placed inside an oven for 2 h at
70°C. After cutting the PMAA gel into hemispherical pieces, it was then washed with
copious amounts of water to remove any residue that had not reacted. The hemispherical
hydrogels were stored in DI water. Equilibration at the required pH was performed before the
experiments. The very different crosslinking densities of the PMAA and PDEAEMA gels
allowed for comparable moduli, which is necessary for comparative experiments such as
these.
For the neutron reflectivity experiments, flat sheets of PMAA hydrogels were required in
order to maintain good contact with the PDMAEMA brush layer. The synthesis was therefore
performed on a glass Petri dish of 7 cm radius, and afterwards the gel was divided into disks
of 3.5 cm diameter.
For the PDEAMA gel, a solution containing 2.9 mmol AMPA, 7.9 mmol EGDMA, and 0.20
mol DEAEMA in a mixture of methanol (50 ml) in water (30 ml) was stirred and degassed
for 30 min and then transferred into a special degassed glass container, which had a
removable glass base that contained hemispherical holes of 4 mm diameter. The glass
container was then placed inside an oven at 70°C for an hour. The polycationic gel so formed
was cut into hemispherical pieces and stored inside DI water to be used later in the adhesion
A
cce
pt
ed
M
an
uscr
ip
t
2.3 Neutron reflectometry
Neutron reflectometry measurements were performed by using the time-of-flight EROS
reflectometer of the Orphée reactor at the Laboratoire Léon Brillouin. The neutrons were
collimated to a wavelength range of between 0.3 and 2.5 nm. The neutron beam was
collimated to 3.9 mm to ensure that the beam footprint was focused onto the sample. Two
angles were used in order to increase the range of neutron wave vector. For the experiments
the gel was gently pressed onto the brush in a specially designed Perspex® sample cell. Care
was taken to avoid contact with the cell during alignment of the beam. In these experiments,
as in those of the earlier experiments [7], the neutrons were incident on the brush through the
silicon substrate. This was necessary because of the large incoherent scattering of water. The
disadvantage of this sample geometry is that, for thin brush layers, there is no total reflection
(R = 1), which can be a useful means to normalize the data. A D2O interface with silicon in
the same sample cell was therefore used as a control in order to normalize the data. The exact
normalization factor could then be obtained through fitting the data. The brush volume
fraction profiles were obtained by optimizing the scattering length density and thickness of an
increasing series of layers to minimize χ2 as described previously [27].
2.4 Mechanical testing
For adhesion measurements, two different set-ups were used. For experiments between a
PDMAEMA brush and PMAA gel, the experiments were performed in a liquid cell situated
between a lamp and a high resolution camera (M125, Leica: Mannheim, Germany). The gel
was observed from the side. The liquid cell consists of a 300 ml glass square container where
the substrate is placed to equilibrate under known pH solution. The hydrogel is brought in
contact to the disk and pulled off by a micromanipulator (Model DC300 1R, World Precision
Instruments: Berlin, Germany) connected to a 100 g force transducer (World Precision
Instruments). The micrometer is set to a velocity of 20 m/s (1.2 mm/min) in both the loading
and unloading stages. The experimental procedure consists of clamping the disk in the glass
support and leaving the solution to equilibrate for 2 h; after which the hemispherical gel is
clamped onto a Perspex® support and brought into contact with the wafer until a force of 20
mN, is reached. The gel and the wafer are left in contact for 15 min and then the gel is pulled
until it is detached from the surface.
For experiments investigating the adhesion of PDEAEMA and PMAA a mechanical tester
A
cce
pt
ed
M
an
uscr
ip
t
perform the pull-off experiments by bringing a hemispherical piece of the hydrogel in contact
with an oppositely charged polyelectrolyte brush in distilled or DI water. The tester
comprises a mechanical probe which is used to fix the hemispherical gel inside its plastic
jacket and a platform on which the brush substrate is placed. The mechanical probe brings the
hydrogel in contact with the polymer brush surface (Figure 1). The mechanical tester was set to apply 0.5 N on the interface between the gel and brush interface. The interface was
illuminated with a lamp and side-view images of the interface were taken using a camera.
The applied force studied here was therefore substantially greater than the 20 mN used for the
PDMAEMA brush samples, although the basic experiment was the same. The gel was left in
contact with the brush at an applied force of 0.5 N for 2 min before being retracted at a speed
of 50 mm/min.
For measurements of the elastic modulus of PMAA gels, the gel was placed in contact with a
silicon surface immersed in aqueous solution at the required pH. Different loads P were
applied and the contact diameter 2a determined. The silicon surface is slightly negatively
charged or uncharged under most pH and there is no strong adhesion with the PMAA, which
allows the modulus K to be calculated using the Hertz equation [28],
a3 = PR/K, (1)
where R the radius of the gel. The gradient of a plot of a3 as a function of P reveals the
modulus, since R is known. For PDEAEMA gels the modulus was calculated using an
APTES-coated silicon wafer so that the positively charged gel had no additional adhesive
interactions with the surface.
3.
Results and discussion
3.1 Neutron reflectometry determination of depth profiles
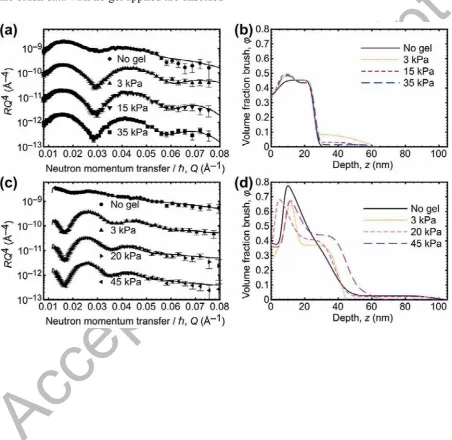
Neutron reflectometry data and fits are shown in Figure 2 for PDMAEMA brushes of 11 and 20 nm thickness as pressure is increased on the brush.The fits are of a very good quality and
we can therefore be confident in the volume fraction profiles shown. The volume fraction
profiles are extracted from the scattering length density profiles which is possible if there are
only two components. Here, the components are brush, gel, and water which means that an
A
cce
pt
ed
M
an
uscr
ip
t
the aqueous medium have similarly small scattering length densities, it is reasonable to treat
them as identical and analyze the data as for a binary system. In all samples the brush volume
fraction increases from the silicon substrate over a few nm. It is likely that this at least partly
reflects the initiator monolayer attached to the native oxide layer on the silicon substrate.
With no gel attached, the brushes are relatively compact and do not extend deep into the
solution. These PDMAEMA brushes are therefore behaving in a similar manner to the
PDEAEMA brushes in water in an earlier study [27]. As pressure is applied to the gel the
behavior changes a little for the 20 nm brush (Figure 2d), whereby an extra layer is necessary in the fitting profile to accommodate a slightly extended region of constant volume
fraction ( ≈ 0.4). The 11 nm brush (Figure 2b) changes very little, except for during the application of 3 kPa, where a more stretched brush is observed, but only at a small volume
fraction. This may well reflect an effect of non-conformal contact between the brush and the
gel at this low pressure. The changes in structure for all of the data do not necessarily mean
that the brush is interdigitating into the gel; it is equally possible that the gel-brush interface
is buckling and that there is a lateral structure but no interdigitation. This is possible because
the gel is relatively soft, with a modulus K ≈ 170 kPa. Alternatively, a combination of
buckling and interdigitation may be possible. Despite the ambiguity, it is clear from the
neutron reflectometry data that there is a thickness dependence of the structure, and it is not
unreasonable to conclude that this could affect the adhesion.
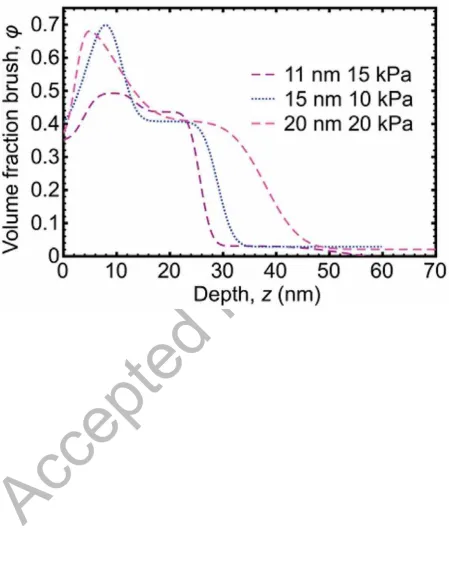
To consider the thickness dependence in more detail, in Figure 3 the volume fraction-depth profile is shown for three brushes of different thickness but under similar applied pressures.
Here it can be seen that the extension of the brush into the gel gradually increases with
increasing brush thickness. The thicker brushes have more capacity to extend into the gel,
and the brush profile also becomes slightly broader (i.e. there is an increase in the width of
the extended interface) with thickness.
3.2 Brush thickness-dependent failure of the PMAA-PDMAEMA interface
To test the effect of different brush thicknesses on the adhesion of the two components a
mechanical force tester was used to bring the two components into contact, and then to
separate them. Sample data are shown in Figure 4. Here both the applied force on withdrawal of the gel from the brush layer and the contact diameter are shown and their behavior are
A
cce
pt
ed
M
an
uscr
ip
t
s, although the force still increases. This plateau corresponds to a ‘neck’ forming (Figure 5), which does not appear in the 13 nm sample. Systems which exhibit such a ‘neck’ invariably
end in cohesive failure at the interface, as can be seen from the optical images of the interface
in Figure 5. The two thinner brush layers (3 nm and 13 nm) did not exhibit a ‘neck’ and cohesive failure did not occur (or was negligible). In the neutron reflectometry experiments, a
pressure was applied, whereas the mechanical tester here applied a force of 20 mN. In fact,
this force was applied over a contact diameter of ~1.3 mm in both cases, corresponding to a
nominal pressure of 15 kPa, which is equivalent to that in the neutron experiments. This
means that a comparison with the data of Figure 3 is tempting, whereby the brush volume fraction profile has two distinct parts, as opposed to the more uniform structure of the thinner
layer. Whilst strong conclusions cannot be drawn about the correlation between the volume
fraction profile and cohesive failure with these limited data, it cannot be excluded that the
brush interpenetrates the gel to some degree for cohesive failure to occur. The difference in
the failure mechanisms is clear from the data in Figure 5. In the case of the 16.5 and 31 nm brushes, the contact between the brush and gel remains as the gel is retracted; this is
highlighted on the image for the 31 nm brush. There is no such contact on the two thinnest
brushes, for which adhesive failure is observed. In Figure 4, these can be differentiated because there is a substantial time period (between 7 and 25 s) where the contact diameter
remains unchanged for the 31 nm brush, but an equivalent period is not observed for the
thinner 13 nm brush.
3.3 Comparison between polycation brush/polyanion gel and polyanion
brush/polycation gel
To consider whether or not the geometry (polycation brush and polyanion gel) is the
determining factor in the adhesion it is necessary to reverse the roles, so that a polycation gel
is used in concert with a polyanion brush. To this end pH-dependent adhesion experiments
were performed on a PMAA gel in contact with a PDEAEMA brush and a PDEAEMA gel
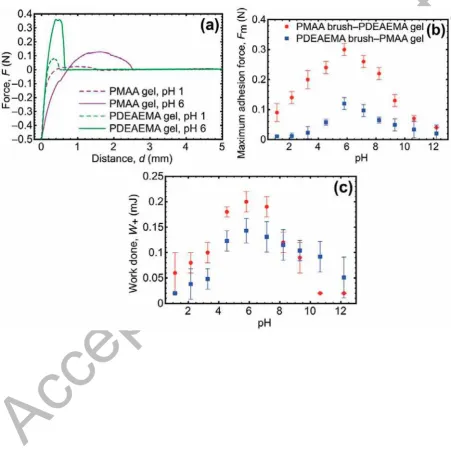
adhering to a PMAA brush. The results for these experiments are shown in Figure 6, both as maximum force required to separate the brush and the gel (Fm) and the work done (W+) in
separating them (the area under the force-distance curve for F > 0, which therefore excludes
repulsive interactions).
The adhesion (force and work done) is at first glance symmetric about pH 6 for both the
A
cce
pt
ed
M
an
uscr
ip
t
greater force to be detached from the PMAA brush at pH 6 than the PMAA gel does from the
PDEAEMA brush. It is appealing to attribute this behavior to mechanical properties: here the
PMAA gel has a modulus of 0.30 ± 0.04 MPa in DI water (pH 6) [9], while for the
PDEAEMA, K = 0.48 ± 0.03 MPa. Furthermore, the swollen gels have a smaller modulus
than those that are uncharged. The PMAA gel has a modulus that changes from K = 0.42
MPa at pH 1 to 0.17 MPa at pH 12 [9], whilst the PDEAEMA gel changes from K = 0.37 ±
0.01 MPa at pH 1 to 0.63 ± 0.02 MPa at pH 12. This means that the PDEAEMA and PMAA
gels have similar moduli at pH 1, but significantly different values for the maximum force
and work of adhesion at this pH. These are 3 and 8 times greater respectively for the
PDEAEMA gel than the PMAA gel.
Whilst the modulus plays an important role in the adhesion (as it must, through the JKR
equation) it is also important which component is swollen and which contracts. The effect of
charge on the polymers is key. These brushes are expected to be swollen by the osmotic
pressure of their counter-ions, and so they are unlikely to retain the charge expected for
polymers in dilute solution at a given pH because counter-ion condensation will result in the
denser grafted polymer layer [29]. The pKa of a weak polyelectrolyte is necessarily measured
in dilute solution. In the brush, however, the presence of nearby chains and associated
counter-ions would raise the energy of the system due to the increased Coulombic energy.
This energy can only be reduced by counter-ions condensing on the chain, with the result that
weak polyelectrolyte brushes are not expected to be as charged as the equivalent chains in
dilute solution, and also that their neutralization point is shifted relative to chains in dilute
solution. There is a much greater effect of charge (and thus osmotic pressure) in the PMAA
brush than in the PDEAEMA brush (these brushes are of similar dry thicknesses, and so are
comparable) because the PMAA brush has the greater change in thickness. The PDEAEMA
brush does not change as much in thickness (a factor of two) between high and low pH as the
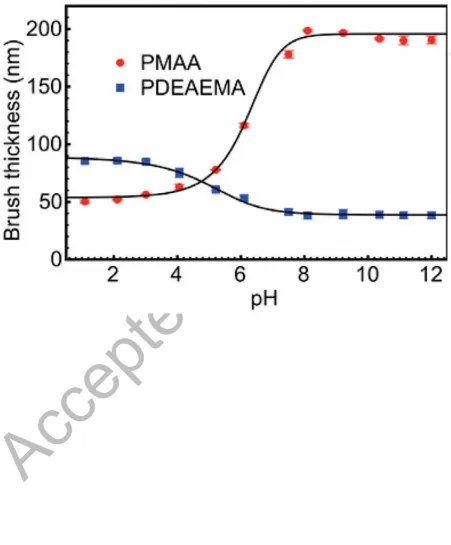
PMAA does between low and high pH (a factor of four) (Figure 7). The maximum swelling of the two gels was similar, so effects due to swelling are dominated by the brush layer. This
is not surprising because a gel can swell in three dimensions, whereas a brush can do so in
only one. In order to consider the possible effect of counter-ion condensation, the
pH-dependent thickness of the two brushes in aqueous media was measured using ellipsometry
(M-2000V rotating compensator ellipsometer, J. A. Woollam Co., Inc.: Lincoln, USA).
A
cce
pt
ed
M
an
uscr
ip
t
l=l2+
(
l1−l2)
2 1+tanh
pH-Δ1
σ 1
tanh pH-Δ2
σ 2
, (2)
where l1, l2, Δ1, Δ2, 1, and 2 are fitting parameters. This equation is purely empirical, but it
does allow a calculation of the second derivative (with respect to pH), which is zero
(inflexion) at pH = 5.3 for PDEAEMA and 6.4 for PMAA. These pH values can be compared
with the pKa of the two polymers, which are 7.3 [30] and 5.7 [31] in dilute solution
respectively. It is therefore clear that in both cases there is a shift compared to the pKa, which
can be attributed to counter-ion condensation.
The question of counter-ion condensation is important because at low pH the difference in
adhesion between PDEAEMA and PMAA is significantly more than at high pH, where the
work done in removing a PMAA gel from the brush surface is greater than that for the
PDEAEMA gel. The PDEAEMA brush thickness transition has a greater shift compared to
its pKa, than that for PMAA suggesting that more counter-ion condensation occurs in the
PDEAEMA which may explain why it has a lower adhesive force with a PMAA gel at low
pH than the PMAA brush with the PDEAEMA gel at high pH. (This would also explain the
smaller thickness change as a function of pH of the PDEAEMA brush than the PMAA
brush.) Counter-ion condensation is likely when there is a large grafting density in the brush,
increasing the electrostatic energy of the counter-ions. As mentioned above, there is not
expected to be as much counter-ion condensation in the gels, because these can swell in three
dimensions reducing the density of charges. The PDEAEMA gel swelling ratio decreases
from 22 ± 4 at pH 1.3 to 3 ± 2 at pH 12.2, whereas the PMAA gel increases from 6 ± 2 to 65
± 18 over the same range, which are changes of a factor 7 ± 5 and 11 ± 5 for the two
respective gels.
It is also the case that the decrease in adhesion (for both gel and brush configurations) is
slightly greater when the environment is more acidic. The origin of this behavior is likely to
be related to the respective swelling of PMAA and PDEAEMA brushes; the PMAA brush
A
cce
pt
ed
M
an
uscr
ip
t
3.4 Thermodynamic work of adhesion
The thermodynamic work of adhesion can be calculated from these experiments assuming
that the adhesion follows Johnson-Kendall-Roberts (JKR) behavior [32]. Under this
formalism the work of adhesion is related to the maximum force by
Fm = 3πRWt/2, (3)
where Wt is the thermodynamic work of adhesion. This simple equation shows that the
maximum (pull-off) force depends linearly on the radius of the gel and the work of adhesion,
and is generally used for the adhesion between deformable media. As such the JKR equation
is appropriate for the work described here. The JKR equation reduces to the Hertz form
(Equation 1) in the absence of adhesion. This work of adhesion is generally presented as a function of the stress at the interface [33], because this represents the effect of the applied
load at the contact line, i.e. the edge of the circular contact. Contact stresses are a
longstanding problem in contact mechanics [34] and although their measurement has been of
longstanding interest [2] new techniques for the in situ measurement of the stress are
continually being developed [35]. The stress is given by
σ =
3alKWt
2
(
al2−af2)
−3K al2−af2
2 R , (4)
where al is the radius during the application of the load, and af is the contact radius after the
load was removed. The first term represents the effect of the load, and the second term
represents a Hertzian component. When the Hertzian component is larger than the first term,
the stress is compressive. This is typically the case when unloading from large loads. When
the first term is the larger, the stress is tensile. This formalism requires that the gel be
incompressible, and this is not the case for hydrogels under large loads. A full understanding
of this limitation is lacking, but indications are that there are circumstances when it may be
significant [36]. It is also notable that in the present experiments, for a given system as a
function of applied load, the adhesion increased with both compressive and tensile stress. In
both cases an increased load corresponds to an increased (absolute) stress. For the pH 1
results this might be considered surprising since an increased tensile stress is associated with
weaker adhesion, but at pH 1 the work of adhesion increased from 2.5±0.3 J/m2 at an applied
A
cce
pt
ed
M
an
uscr
ip
t
between 0.1 N and 2 N (al/af = 1.1) but al increased by 50% as the load increased. Therefore
the increased work of adhesion is mainly responsible for the increase in the tensile stress with
applied load at pH 1. Although the errors are significant, the trend at pH 1 (as for the other
pH results) is real and the origins of this behavior would be of some interest. It is possible to
speculate that the increased compression at pH 1 gives rise to increased hydrogen bonding,
although this was thought to be unlikely in the case of brush-brush interactions at much
smaller forces [19].
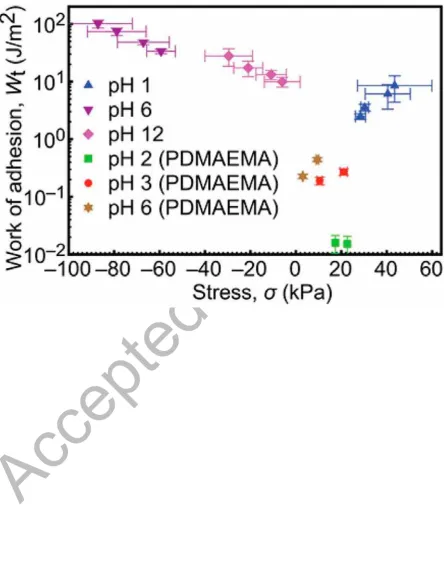
The adhesion increases with increasing stress with the pH 6 data representing the largest
adhesion (Figure 8). The data for pH 12 show a larger adhesion than that at pH 1, which is consistent with the results presented in Figure 6. The results for the earlier experiments [7] are also shown for a complete comparison. The adhesion for the least adhesive system in the
present work: that of the PDEAEMA brush with the PMAA gel at pH 1, which has a greater
work of adhesion (2.5 ± 0.3 J/m2 at an applied force of 0.1 N) than the most adhesive system
in the earlier study (0.44 ± 0.05 J/m2 at 60 mN [7]). These two results may reflect the role of
the stress in this comparison rather than the slight dissimilarity between the two polycationic
brush layers: a 16 nm-thick PDMAEMA brush subjected to a 190 kPa gel [6] with an applied
force of 60 mN at pH 6 is here compared with 28 nm-thick PDEAEMA brush subjected to a
310 kPa gel with an applied force of 0.1 N at pH 1.
Given that the JKR theory describes equilibrium behavior, it would be expected that a
chemical description of the components would be sufficient to describe adhesion phenomena;
i.e. the work of adhesion between the same components in a given geometry should be
independent of load. However, it is well known that there is hysteresis in the adhesion
between soft materials; i.e. the maximum pull-off force (Fm) will yield a different (unloading)
work of adhesion than that obtained during compression, i.e. the loading work of adhesion
[33]. As the (compressive) stress described by Equation (4) increases, i.e. the stress becomes more negative, the unloading work of adhesion, which is here a proxy for the maximum
adhesion (pull-off) force, increases significantly. The data presented in Figure 8 therefore demonstrate that, even for relatively similar systems, the effect of compressive stress cannot
be ignored; a system considered adhesive in previous experiments [6, 7] has a smaller work
of adhesion than pH 1 values provided in the present work. Again pH 12 data do not provide
as good a means of detaching the gel as those at pH 1; in fact the stress in these data is even
A
cce
pt
ed
M
an
uscr
ip
t
3.5 Equilibrium considerations
A contact time of 2 min is a good proxy a physically realistic (real-world) contact, but it does
not necessarily represent thermodynamic equilibrium. However, should longer contact times
affect adhesive properties, they would also affect the stress at the interface, so the results
presented here retain a useful generality, i.e. the work of adhesion corresponds to the stress
applied. More important therefore is the rate of detachment, which should be slow enough to
ensure that the system remains in quasi-static equilibrium as the gel is detached. If the gel is
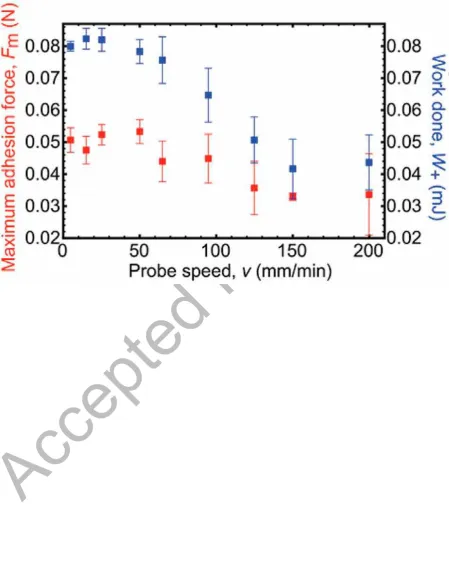
removed too rapidly, premature cohesive failure may occur. To test for this, the maximum
adhesion force is compared against the work done (Figure 9). Above a retraction speed of 60 mm/min the work of adhesion decreases, although there is much less of an effect on Fm
above this speed. Because both the force and work done remain unchanged for the slower
speeds, it is likely that equilibrium considerations apply to the adhesion couple and thus to
the 50 mm/min used in the current work. At the faster speeds this is not possible. In any case,
for the measurements of Wt, it is only necessary that Fm remain constant as the probe speed is
changed. A limitation of course is that any effects in regimes slower than 5 mm/min are
inaccessible in the experimental geometry used here.
4
Conclusion
The adhesion between oppositely charged polyelectrolytes is a complex multi-parameter
problem, and the effects of some of these have been highlighted. Here the interaction
between a brush and a gel has been considered. The thickness of the brush layer is a
particularly important parameter. If the brush is too thin, then the adhesion is weak. Neutron
reflectometry showed that the brush volume fraction profile was significantly less uniform
for thicker brushes, and the volume fraction profile also changed with increased applied
pressure.
The adhesion behavior is generally symmetric; adhesion weakens both at high and low pH,
and the same behavior is observed if the polyelectrolytes are swapped, i.e. if a polycationic
gel and a polyanionic brush combination is used. There are certain differences, insofar as the
adhesion at low pH is a little less than that at high pH. This is likely to be due to the
differences in the swelling of the PMAA brush with respect to the PDEAEMA brush. The
same observation is made to explain why the PMAA brush adheres more strongly to the
A
cce
pt
ed
M
an
uscr
ip
t
That there is less adhesion at pH 1 than pH 12 is quantified by calculating the stress at the
interface. The sample at pH 1 is dominated by tensile stress, whereas those at pH 12 and 6
experience compressive stress, and also greater adhesion.
Acknowledgements
The Ministry of Education of the Kingdom of Saudi Arabia represented by Ha’il University
is acknowledged for a PhD scholarship for LA. The EPSRC is acknowledged for PhD
scholarships for WDS and ARH. RLS acknowledges the Deutscher Akademischer
Austauschdienst for supporting a period in Stuttgart. MG, RLS, and MRT acknowledge
financial support from MRTN-CT-2004-504052 [POLYFILM]. Access to the Orphée reactor
at the LLB for this project was supported by the European Commission under the 6th
Framework Programme through the Key Action: Strengthening the European Research Area,
Research Infrastructures; contract RII3-CT-2003-505925.
References
[1] Awaja F., Gilbert M., Kelly G., Fox B., Pigram P. J., Prog. Polym. Sci. 34, 948-68 (2009).
[2] Creton C., Ciccotti M., Rep. Prog. Phys.79, 046601 (2016).
[3] Banea M. D., da Silva L. F. M., Campilho R. D. S. G., Sato C., J. Adhes. 90, 16-40 (2013).
[4] Kobayashi M., Takahara A., Polym. Chem.4, 4987-92 (2013).
[5] Kobayashi M., Terada M., Takahara A., Soft Matter7, 5717-22 (2011).
[6] La Spina R., Chiche A., Tomlinson M. R., Geoghegan M., Eur. Coat. J. 22-8 (2011). [7] La Spina R., Tomlinson M. R., Ruiz-Pérez L., Chiche A., Langridge S., Geoghegan
M., Angew. Chem. Int. Ed.46, 6460-3 (2007).
[8] Sudre G., Olanier L., Tran Y., Hourdet D., Creton C., Soft Matter8, 8184-93 (2012). [9] Alfhaid L., Seddon W. D., Williams N. H., Geoghegan M., Soft Matter12, (2016). [10] Brochard-Wyart F., de Gennes P. G., Léger L., Marciano Y., Raphael E., J. Phys.
Chem.98, 9405-10 (1994).
[11] Geoghegan M., Clarke C. J., Boué F., Menelle A., Russ T., Bucknall D. G.,
Macromolecules32, 5106-14 (1999).
[12] O'Connor K. P., McLeish T. C. B., Macromolecules26, 7322-5 (1993).
[13] Ahn B. K., Lee D. W., Israelachvili J. N., Waite J. H., Nature Mater. 13, 867-72 (2014).
[14] Erel-Unal I., Sukhishvili S. A., Macromolecules41, 3962-70 (2008).
[15] Lefèvre N., Daoulas K. C., Müller M., Gohy J.-F., Fustin C.-A., Macromolecules43, 7734-43 (2010).
[16] Wang R., Xie T., Langmuir26, 2999-3002 (2010).
[17] Yan X., Li S., Pollock J. B., Cook T. R., Chen J., Zhang Y., Ji X., Yu Y., Huang F., Stang P. J., Proc. Natl Acad. Sci. USA110, 15585-90 (2013).
A
cce
pt
ed
M
an
uscr
ip
t
[19] Raftari M., Zhang Z. J., Carter S. R., Leggett G. J., Geoghegan M., Macromolecules 48, 6272-9 (2015).
[20] Weir M. P., Parnell A. J., Polymers3, 2107-32 (2011).
[21] Zhao B., Brittain W. J., Prog. Polym. Sci.25, 677-710 (2000). [22] Kern W., J. Electrochem. Soc.137, 1887-92 (1990).
[23] Edmondson S., Osborne V. L., Huck W. T. S., Chem. Soc. Rev.33, 14-22 (2004). [24] Patten T. E., Matyjaszewski K., Adv. Mater.10, 901-15 (1998).
[25] Fielding L. A., Edmondson S., Armes S. P., J. Mater. Chem.21, 11773-80 (2011). [26] Ryan A. J., Crook C. J., Howse J. R., Topham P., Jones R. A. L., Geoghegan M.,
Parnell A. J., Ruiz-Pérez L., Martin S. J., Cadby A., Menelle A., Webster J. R. P., Gleeson A. J., Bras W., Faraday Discuss.128, 55-74 (2005).
[27] Geoghegan M., Ruiz-Pérez L., Dang C. C., Parnell A. J., Martin S. J., Howse J. R., Jones R. A. L., Golestanian R., Topham P. D., Crook C. J., Ryan A. J., Sivia D. S., Webster J. R. P., Menelle A., Soft Matter2, 1076-80 (2006).
[28] Hertz H., J. reine angew. Math.92, 156-71 (1881).
[29] Dukhin S. S., Zimmermann R., Werner C., J. Phys. Chem. B111, 979-81 (2007). [30] Bütün V., Armes S. P., Billingham N. C., Polymer42, 5993-6008 (2001).
[31] Ruiz-Pérez L., Pryke A., Sommer M., Battaglia G., Soutar I., Swanson L., Geoghegan M., Macromolecules41, 2203-11 (2008).
[32] Johnson K. L., Kendall K., Roberts A. D., Proc. R. Soc. London A 324, 301-13 (1971).
[33] Silberzan P., Perutz S., Kramer E. J., Chaudhury M. K., Langmuir 10, 2466-70 (1994).
[34] Barthel E., J. Phys. D: Appl. Phys.41, 163001 (2008).
[35] Neubauer J. W., Xue L., Erath J., Drotlef D.-M., del Campo A., Fery A., ACS Appl. Mater. Interfaces8, 17870-7 (2016).
[36] Jensen K. E., Sarfati R., Style R. W., Boltyanskiy R., Chakrabarti A., Chaudhury M. K., Dufresne E. R., Proc. Natl Acad. Sci. USA112, 14490-4 (2015).
A
cce
pt
ed
M
an
uscr
[image:20.595.73.523.172.722.2]ip
t
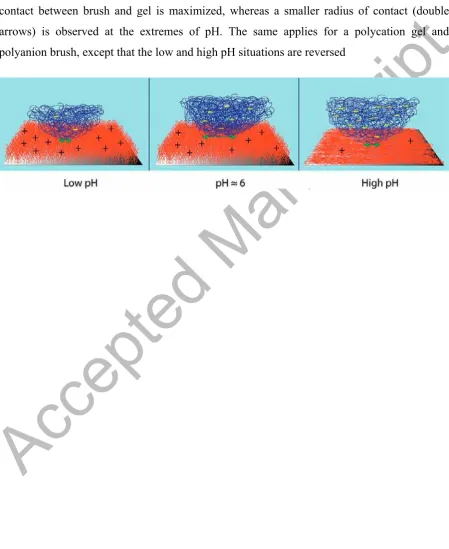
Figure 1. Schematic diagram of the process for a polyacid gel being brought into contact with a polybase grafted polymer layer. At low pH, the brush is fully swollen but the gel
excludes water and contains limited charge. At pH 6, both the brush and the gel are swollen,
while at high pH the brush layer loses most of its charge and collapses to exclude water. The
adhesion is maximized when both of these are charged, i.e. at pH close to 6. At this pH, the
contact between brush and gel is maximized, whereas a smaller radius of contact (double
arrows) is observed at the extremes of pH. The same applies for a polycation gel and
A
cce
pt
ed
M
an
uscr
[image:21.595.73.526.207.647.2]ip
t
Figure 2. Neutron reflectometry data and volume fraction profiles for PDMAEMA brushes in contact with a PMAA gel in water (pH 5.8) at different pressures. (a) Reflectometry data
for an 11 nm brush with (b) corresponding volume fraction profiles. (c) Reflectometry data
for a 20 nm brush with (d) corresponding volume fraction profiles. The reflectometry data are
shown in the Porod formalism (RQ4(Q)) because this better illustrates the quality of the fits
than R(Q). For clarity, the neutron data are scaled by a decade for each increasing pressure;
A
cce
pt
ed
M
an
uscr
[image:22.595.73.523.122.707.2]ip
t
A
cce
pt
ed
M
an
uscr
[image:23.595.73.523.143.712.2]ip
t
Figure 4. Force measured during retraction of the PMAA gel from the PDMAEMA brush
surface along with the contact diameter (CD) as a function of time (and distance) for two
A
cce
pt
ed
M
an
uscr
[image:24.595.76.523.190.724.2]ip
t
Figure 5. (Top) Photographs of a PMAA gel (K = 170 kPa) as it is detached from
PDMAEMA brush surfaces for the four different brush thicknesses shown. (Bottom) The
brush surface is photographed after the gel is removed. The scale bar is 1 mm, and the scale
is the same in all four lower images. The contact between the gel and the brush is highlighted
A
cce
pt
ed
M
an
uscr
[image:25.595.72.524.202.655.2]ip
t
Figure 6. Example force-distance curves (a) for PMAA and PDEAEMA gels being brought to PDEAEMA and PMAA brushes respectively. The maximum adhesion force (b) and
corresponding work done (c) are plotted for the two different geometries (the legend is the
same in both plots), whereby the gel component is the PDEAEMA and the brush PMAA, and
vice versa. The gel was brought into contact with the brush for 2 min with an applied force of
A
cce
pt
ed
M
an
uscr
[image:26.595.72.524.166.712.2]ip
t
Figure 7. Ellipsometric water-swollen thickness of PDEAEMA and PMAA brushes as a
function of pH. The dry thicknesses were 28 and 32 nm respectively. These solid lines are a
A
cce
pt
ed
M
an
uscr
[image:27.595.76.521.144.727.2]ip
t
Figure 8. Thermodynamic work of adhesion for the PDEAEMA brush/PMAA gel adhesion
couples measured in this experiment. The results from the earlier work [7] of PDMAEMA
A
cce
pt
ed
M
an
uscr
[image:28.595.74.524.146.719.2]ip
t
Figure 9. Maximum adhesion force and work done as a function of the probe retraction speed. For speeds above about 60 mm/min, the work done starts to decrease. A similar, but