Int. J. Electrochem. Sci., 10 (2015) 6146 - 6163
International Journal of
ELECTROCHEMICAL
SCIENCE
www.electrochemsci.orgMott–Schottky and Morphologic Analysis of
Poly(Pyrrole-N-Propionic Acid) in various electrolyte systems
Tolga Karazehir1,2, Murat Ates2 and A. Sezai Sarac1* 1
Department of Chemistry, Polymer Science & Technology, Istanbul Technical University, Maslak, 34469, Istanbul, Turkey
2
Department of Chemistry, Faculty of Arts and Sciences, Namik Kemal University, Degirmenalti Campus, 59030, Tekirdag, Turkey
*
E-mail: [email protected]
Received: 28 April 2015 / Accepted: 22 May 2015 / Published: 24 June 2015
In this study, pyrrole-N-propionic acid (PPA) was electrochemically polymerized on a glassy carbon electrode (GCE) in various electrolytes (NaClO4, Et4NBF4, Bu4NClO4,and Bu4NPF6) using cyclic voltammetry (CV). The structure and morphology of the modified electrode was characterized by FTIR-ATR, visible-near-infrared spectroscopy (Vis-NIR), scanning electron microscopy (SEM), and atomic force microscopy (AFM). The morphological characterizations of the poly(PPA) films synthesized in the various supporting electrolyte solutions were demonstrated by SEM and AFM. Electrochemical impedance spectroscopy (EIS) and Mott–Schottky (M–S) analysis were performed to collect information about the semiconducting properties of the poly(PPA) films. From the Mott– Schottky analysis, the carrier densities (ND) of the poly(PPA) films obtained were 3.25×1016,1.59×1016, 1.17×10¹⁶, and 0.52×10¹⁶
cm-3,and the flat-band potentials were 0.41, 0.32, 0.37, and 0.36 V for the poly(PPA)films in NaClO4, Et4NBF4, Bu4NClO4, Bu4NPF6 , respectively. The resulting Mott–Schottky plots of the poly(PPA) films indicate that the films are p-type semiconductors. EIS analysis were performed to determine the capacitive behaviors by variation of electrolyte types in a monomer-free solution. An equivalent-circuit model of R(W(CR)(QR))(CR) was used to fit the theoretical and experimental data to interpret the polymer electrode/electrolyte interface properties and to provide information about equivalent circuit parameters.
Keywords: Poly(pyrrole-N-propionic),electrochemical impedance spectroscopy, equivalent-circuit model, Mott–Schottky analysis, electrolyte, AFM.
1. INTRODUCTION
emitting diodes, supercapacitors, and corrosion inhibitors [1-6]. The semiconducting properties of CPs, such as the free-carrier concentration, flat-band potential, and conductivity type are vital for the successful performance of these materials in device fabrication. These properties can be determined from a Mott–Schottky (M–S) plot, which consists of the inverse square of the space-charge-layer capacitance (CSC) versus the bias potential [7]. Among CPs, polyaniline and polypyrrole have received huge considerable attention due to their promisingunique physical and chemical properties, such as low density, high conductivity, facile synthesis, and potential for device fabrication [8-12]. Polypyrroles are known to exhibit stability in the oxidized state and more reversibleinteresting redox properties [13-17]. However, the limited permeability of the PPy film hinders the diffusion of the target analyte [18,19]. Recently, the pyrrole derivative, pyrrole-1-propionic acid (PPA) has emerged as a novel material polymer matrix for biosensorimmunosensor applications, and it has been reported in several papers [20-25].
In this study, PPA was electrodeposited onto glassy carbon electrodes (GCE) with various electrolyte systems in the solvent acetonitrile. The modified polymer electrodes were characterized by CV, FTIR–ATR, SEM, AFM, and Vis-NIR spectroscopy. EIS and M–S analysis were used to examine the semiconducting properties of the modified polymer electrodes. Nyquist, magnitude, Bode-phase graphs of poly(PPA) were also comparatively studied to determine the capacitive behaviors by variation of electrolyte types in a monomer-free solution. An equivalent-circuit model of R(W(CR)(QR))(CR) was used to fit the theoretical and experimental data to interpret the polymer electrode/electrolyte interface properties and to provide information about equivalent circuit parameters. It was aimed to provide an overview of the semiconducting properties of poly(PPA) films that were synthesized in various supporting electrolytes and to provide insight into the role of the electrolyte nature on the impedance, morphology, and optical properties. The results indicated that the various supporting electrolytes affected the semiconducting properties of the synthesized polymer.
2. EXPERIMENTAL
2.1. Materials
Pyrrole-N-propionic acid (PPA), 97%, sodium perchlorate (NaClO4), 98%, tetrabutylammonium hexafluorophosphate (Bu4NPF6), 99%, tetraethylammonium tetrafluoroborate (Et4NBF4), 99%,and tetrabutylammonium perchlorate (Bu4NClO4), 99%, were purchased from Sigma-Aldrich (Steinheim, Germany) and used as obtained after drying in a vacuum oven without further purification. Acetonitrile (ACN), anhydrous, 99.8%, was used as received from Sigma-Aldrich (Steinheim, Germany). Indium tin oxide-coated glass slide with surface resistivity values of 30-60 Ω/sq were also obtained from Sigma-Aldrich (Steinheim, Germany).
2.2. Instrumentation
carbon electrodes (CFMEs). CV was performed using Ivium Vertex (software, Iviumsoft and Faraday cage, BAS Cell Stand C3) in a three-electrode electrochemical cell employing a GCE with 0.07 cm2 area, an ITO-coated glass electrode (ITO CE) as the working electrode, a platinum wire as the counter electrode, and an Ag wire as the reference electrode, which was externally calibrated using a 5 mM solution of ferrocene (Fc/Fc+) in 0.1 M NaClO4, Et4NBF4, Bu4NPF6, Bu4NClO4/ACN, for which the E1/2(Fc/Fc+) values of ferrrocene were 0.40, 0.50, 0.56,and 0.58 V, respectively. Before electropolymerization, the GCE working electrode was polished with a 0.5-µm alumina slurry and sonicated forit was immersed in an ultrasonich bath at least 2 minutes in distilled water and acetone, respectively. Then, the electrode was then dried under a nitrogen atmosphere. Morphological investigations were performed using a Gemini Leo Supra 35 VP scanning SEM with an electron beam energy of 10 or 15 keV on an electrocoated thin film of polymer on ITO CE. AFM analysis was performed using a Nanosurf Easy Scan AFM with a scan head of 10 µm. The images were obtained using the non-contact mode of AFM. Vis-NIR spectra were obtained for each electrochemically polymer-coated ITO CE using a T80+ UV/Vis PG spectrometer. EIS measurements were obtained at room temperature (23 ± 2°C) by Ivium Vertex (software; IviumSoft), using a conventional three-electrode cell configuration in a monomer-free electrolyte solution with a perturbation amplitude of 10 mV over a frequency range of 10 mHz to 100 kHz at open-circuit potential, for which the stabilization potential (EOC) was reached at a constant value of ± 5 mV for 30 min. The impedance spectra were analyzed using a ZSimpWin V3.22. An equivalent-circuit model of R(W(CR)(QR))(CR) was used to interpret the theoretical and experimental data. The semiconducting properties of the poly(PPA) films were determined by employing the M–S approach, using the Ivium Vertex equipment. The M-Scapacitance measurements were performed at a frequency of 10 kHz. As indicated in the literature, the frequency dependence of the capacity-voltage curve is not affected near 10 kHz [26]. Thus, in this work, Mott–Schottky measurements were performed at thea frequency of 10 kHz was chosen for the Mott–Schottky measurements with the voltage applied at successive steps of 50 mV from 100 to 800 mV. In all experiments, dDissolved oxygen was removed from all solutions by bubbling nitrogen gas for ten minutes before each test.
3. RESULTS & DISCUSSION
3.1. Electrochemical Polymerization of Pyrrole-N-Propionic Acid
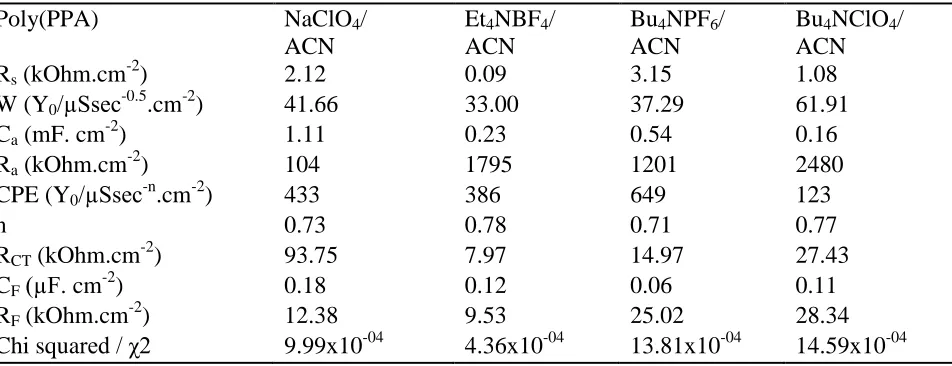
observed for the electrogrowth of PPA in all of the supporting electrolyte solutions (Fig.1). (Fig.1 a-e). This result is compatible with the reports of the electrochemical polymerization of pyrrole in water-free solvents such as ACNACN. because Tthe oxidation of pyrrole during the first scanning cycle leads only to reduction peaks for polypyrrole, but not to an oxidation peak for pyrrole during the first scan [27, 28].
Figure 1. Cyclic voltammogram of the electrogrowth of poly(pyrrole-N-propionic acid) on a glassy carbon electrode. Polymerization conditions: [PPA]0 = 10 mM; potential range = 0-1.4 V; scan rate = 50 mV s-1;and eight cycles in a) 0.1M NaClO4/ACN, ΔQ=17.47 mC; b) 0.1M Bu4ClO4/ACN, ΔQ=17.33mC; c) 0.1M Bu4NPF6/ACN, ΔQ=38.01mC; and d) 0.1M Et4NBF4/ACN, ΔQ=25.95mC. The inset figures show the scan-rate dependences of the cyclic voltammograms of the poly(PPA) filmsin the various supporting electrolyte solutions.
[image:4.596.68.535.178.529.2]
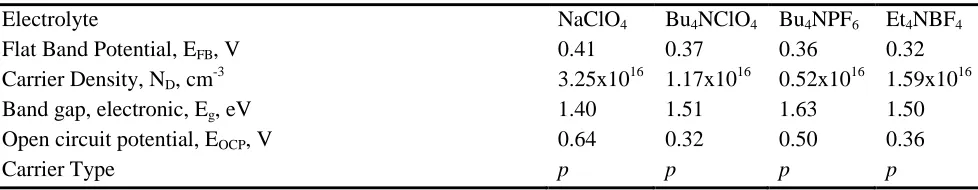
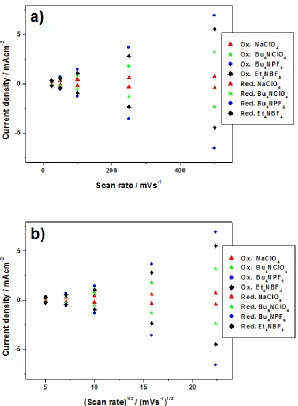
potential shift of the peaks was due to the increase in the electrical resistance of the polymer, requiring the over potential to overcome this resistance. Two peaks frequently appeared in the oxidation portion of the cyclic voltammograms of the poly(PPA) films for the 0.1 M Et4NBF4 and Bu4NPF6 electrolyte systems, suggesting that the redox reaction of the poly(PPA) film might involve two electron-transfer steps [30]. Linear sweep voltammetry was also recorded for the PPA monomer, and the corresponding graphs are shown in Fig. 2. The onset potential of the monomers occurred at 1.08, 1.18, 1.22, and 1.24 V for NaClO4, Bu4NPF6, Bu4NClO4, and Et4NBF4, respectively. This clarifies that PPA exhibited distinct electro-oxidation pathways for each of the electrolyte solutions. The decrease in the oxidation onset potential of PPA is attributed to the increase in the p-conjugated chain of the starting oligomers, and it indicates that the oxidation of PPA in 0.1 M NaClO4 was much easier than for the others. The redox behavior of the modified films was also investigated in monomer-free solution. The inset in Fig. 1 shows the scan-rate dependence of the poly(PPA) film in a monomer-free solution. The peak current increases linearly in direct proportion to the increasing scan rate, presenting the influence of the dopantincorporated anions. It is shown in all studies that a pair of peaks signifies the polymer’s redox processes, but this was not observed in NaClO4 at a high scan rate. This indicates that this system shows an absence of a kinetic or transport limitation [31]. The anodic and cathodic peak current densities related to the oxidation and the reduction of poly(PPA) were plotted versus the scan and the square root of scan rate (Fig. 3). The correlation coefficient of the oxidation peaks and the reduction peaks were found to be approximately 1. This result demonstrates that during the electrochemical process, both electroactive (nanostructured) thin-film formation and a diffusion-controlled process occur simultaneously during the electrochemical process [32].
[image:5.596.153.426.454.682.2]
Figure 3. Anodic and corresponding cathodic peak current vs. a) scan rate and b) the square root of the scan rate of the poly (PPA) films in monomer-free media.
3.2. FTIR-ATR Measurements
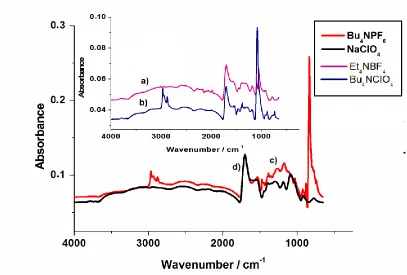
Figure 4. FTIR-ATR spectra of poly(PPA) films: a) poly(PPA)-Et4NBF4, b) poly(PPA)-Bu4ClO4, c) poly(PPA)-Bu4NPF6, and d) poly(PPA)-NaClO4.
3.3 Visible-Near-Infrared Spectroscopy of Poly(PPA) Films
[image:7.596.93.500.78.353.2]
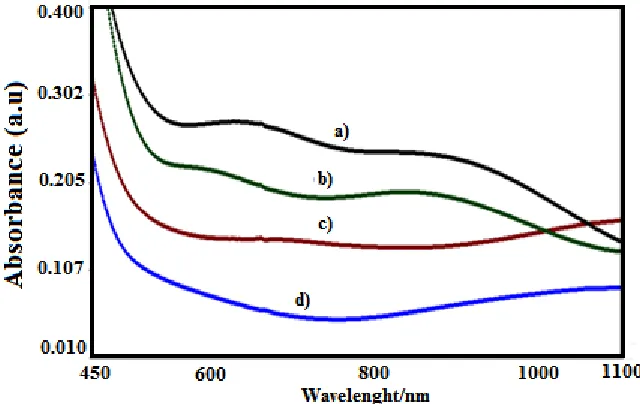
near-IR region, the presence of a strong, broad absorbance in conjugated polymers such as polyaniline and polypyrrole is called the “free-carrier tail” [44,45]. This free-carrier tail is obtained when the polymer includes bipolaron charge carrier contains as a large population in polymeric backbone of bipolaron charge carrier, and The electrical conductivity it is strongly correlated with the electrical conductivity bipolaron charge carrier, length of the polymer chain, and conjugation length, and which is which is proportional to the intensity of the free-carrier tail. These specific absorption peaks are also indicative of the nature of the charge carrier present in the film [46,47]. The broad peaks observed in the range of 800 to 1100 nm are associated with the free-carrier tail in all spectra and indicate that the poly(PPA) film is doped. This is because the intensity of the free-carrier tail is proportional to the length of the polymer chain, and the highest peak intensity is obtained for poly(PPA)-NaClO4. One can conclude that it has the highest conjugation length, followed by the others in decreasing order: Et4NBF4, Bu4ClO4, and Bu4NPF6. This result is consistent with the ND value that is obtained by Mott– Schottky analysis in section 3.6. As the free-carrier tail is indicative of the nature of the charge carriers in the polymeric film, the highest ND value is obtained for poly(PPA)-NaClO4,and the others decrease in the following order:Et4NBF4, Bu4NClO4, and Bu4NPF6,which corresponds to the peak intensity in the near-IR region of the spectrum (Fig.5).
Figure 5. The Vis-NIR spectra of the modified poly(PPA) films on the ITO CE. a) poly(PPA)-NaClO4,b) poly(PPA)-Et4NBF4, c) poly(PPA)-Bu4ClO4,and d) poly(PPA)-Bu4NPF6.
3.4. Surface Morphology of the Poly(PPA) Films
[image:8.596.130.450.371.573.2]
different from the structures morphologies of poly(PPA) on GCE. The surface morphology of poly(PPA) depends on the preparation conditions. Poly(PPA)-Bu4NClO4 and poly(PPA)-Bu4NPF6 films have similar morphologies with the same cracked, compact surface structure. Moreover, it was observed that these films did not reveal the presence of nodular structures (Fig.6a,d). Nevertheless, the poly(PPA)-Bu4NPF6 film appeared to have a denser and less cracked surface structure, which is consistent with the roughness obtained from AFM analysis. The roughness of the poly(PPA)-Bu4NPF6film (4.96 nm) was less than the roughness of the poly(PPA)-Bu4NClO4 film (6.67 nm).
Figure 6. SEM images of poly(PPA) electrochemically obtained by cyclic voltammetry on ITO CE: [PPA]0 = 10 mM; potential range = 0-1.4 V; scan rate = 50 mV s-1; eight cyclesfor a) in 0.1M Bu4ClO4/ACN; b) 0.1M Et4NBF4/ACN; c) 0.1M NaClO4/ACN;and d) 0.1M Bu4NPF6/ACN. The 3D AFM topographies are given in the inset of the figure.
[image:9.596.106.492.214.574.2]
shown a strong effect on the thickness of the polymer film and the progress of the polymerization. Thus, the film morphology was no longer smooth and did not have a compact surface, but it appeared that a cauliflower structure forms that consists of hemispheres of several micrometers in diameter when the thickness of the polypyrrole films exceeds 1-2 µm [48-50]. Faraday’s law was used to calculate the mean film thickness of poly(PPA) estimated from the electrical charge (Q), assuming that the current efficiency for poly(PPA) formation is 100%,that the number of electrons (z) involved is 2.25 [51], and that the nominal density for the poly(PPA) films was 1.5 g cm−3 [52], as for polypyrrole [53]. The film thicknesses were calculated as 0.99 µm for poly(PPA)-NaClO4, 0.85 µm for poly(PPA)-Et4NBF4, 0.47 µm for poly(PPA)-Bu4ClO4, and 0.43 µm for poly(PPA)-Bu4NPF6. Furthermore, the similarity in the observations shows that the morphology of the film depends on the film thickness and the electrolyte type. It was demonstrated that increased thickness of the polymer films led to spherical, grainy surfaces. In general, the roughness and pore size of the polymer films increased with the film thickness, as was reported in the literature [54,55]. Similar results are observed in our study as well. Nodular surface structures were observed in the thicker poly(PPA) films. In contrast, ITO CE that was covered by thinner poly(PPA) films exhibited more compact films than those observed for the thicker (poly(PPA)-NaClO4 and poly(PPA)-Et4NBF4) films.
3.5. The Electrochemical Impedance Behavior of the Poly(PPA) Films in Various Electrolytes
In the polymerization process, the counter-ion type affects the morphological, spectral, impedimetric, and voltammetric properties [56-57]. Thus, EIS experiments were performed on the electrolyte/poly(PPA) half-cell electrodes to investigate the effect of the counter-ion type and the interfacial properties. Nyquist, Bode magnitude, and Bode phase plots of the polymeric thin films that were doped with different anions are depicted in Fig. 7. In all EIS studies, the Nyquist plots revealed a depressed, small semicircle in the high-frequency region, which is caused by the parallel combination of the resistive and capacitive components of the electrode material, and low-frequency spikes that exhibit an upward slope [58]. The low-frequency capacitance (Csp) values of the poly(PPA) films (at 0.01 Hz) were calculated using the equation Csp=(2f.Zim)-1, where Csp is the specific capacitance,and (Zim) is the slope of a plot of the imaginary component of impedance versus the inverse of the frequency (f) [59,60]. The capacitance of the polymer film decreases with increased frequency, and the film behaves like a pure resistor at higher frequency because the ions are unable to penetrate under high frequencies, and thus, zero capacitance is observed.
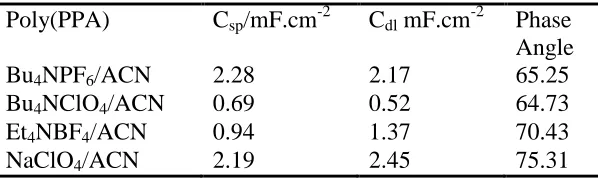
Table 1. Capacitance and phase angle values obtained for poly(PPA) in the various electrolyte solutions.
Poly(PPA) Csp/mF.cm-2 Cdl mF.cm-2 Phase Angle
Bu4NPF6/ACN 2.28 2.17 65.25
Bu4NClO4/ACN 0.69 0.52 64.73
Et4NBF4/ACN 0.94 1.37 70.43
[image:10.596.150.449.676.765.2]
As can be seen from Table 1, in the lower frequency region, Csp, the specific capacitance increased with increased dopant ionic radius (in the following sequence: BF4- < ClO4- < PF6-). It was found that the Bu4NPF6 electrolyte system has the highest capacitance value of 2.28 mFcm-2in the initial monomer concentration of 10 mM. The other Csp values were calculated as 2.19 mFcm-2 for NaClO4, 0.94 mFcm-2 for Et4NBF4, and 0.69 mFcm-2 for Bu4NClO4, respectively (Table 1). The inclined spike arises fromdisplays the formation of double-layer-capacitance charge accumulation at the polymer–solution interface, Cdl. This is the other main characteristic of the electrode at the electrode–electrolyte interface because of due to the migration of ions at low frequency Itand is determined by the formation conditions of the double layer. in the pores of the modified carbon material. Moreover, the spike inclination at an angle less than 90° to the real axis is due tobecause of the roughness of the electrode–electrolyte interface [61,62]. As seen from Table 1, the value of Cdl can be calculated from a Bode-magnitude plot as shown in Fig.7.b, by extrapolating the linear section to the value ω=1 (logω=0), employing the relationship IZI=1/Cdl. The highest double-layer capacitance was obtained for poly(PPA)-NaClO4(2.45 mFcm-2), and the minimum double-layer capacitance was obtained for poly(PPA)-Bu4NClO4 (0.52 mFcm-2) from the Bode-magnitude plot (Fig.7.b).
[image:11.596.119.471.353.637.2]
The nature of the dominant conductive behavior of the polymeric film, a resistor or a capacitor, affects the real and imaginary components of the impedance and the phase angle (φ), within the system at a given frequency range. The imaginary part of the impedance is represented as resistive behavior, and its associated phase angle is φ= 0o
. The real part of the impedance is represented as capacitive behavior with a phase angle of φ= 90o
. The Bode-phase plots in different electrolytes indicate the prevailing influence of the electrolyte resistance (Fig. 7.c). The films behave like ideal resistors with a very low Bode-phase angle. For Bu4NClO4, Bu4NPF6, and Et4NBF4/ACN, a plateau appeared in the frequency range of 0.1–10 Hz, and the films show a transition from resistor to capacitor behavior. This plateau was absent, however, for NaClO4/ACN. At frequencies lower than 0.1 Hz, the Bode-phase angle approaches a semi-plateau region on the time scale that the electric signal reaches maximum penetration into the pores of the poly(PPA) film electrode (Fig. 7.c) [63]. One relaxation process, at the maximum phase angle, which may be due to the diffusion of dopant anions into the polymer matrix [64], occurred at the polymer film−electrolyte interface. The maximum phase angle (75.31o) can be observed for NaClO4/ACN at a frequency of 0.01 Hz, and the minimum value was obtained for Bu4NClO4/ACN (64.73o) at a frequency of 0.01 Hz.
3.6. Electrical Equivalent-circuit Modeling
One of the aims of this work is to find a relationship between the impedance data obtained for poly(PPA) films synthesized in various supporting electrolyte solutions and a suggested electrical equivalent circuit (EEC).This can provide a reason for the characteristic features of the system and, at the same time, allow a choice among different possible assumptions about the system. The electrochemical parameters of the poly(PPA) films in the electrolytes were fitted considering the electrical equivalent circuit R(W(CR)(QR))(CR) (shown in the inset of Fig.7b).This was performed by taking into consideration the statistical importance of the parameters and their standard deviations [65]. The components of the proposed circuit and data are given in Table 2.
Table 2. Electrolyte dependence of the parameters for poly(PPA) calculated from the equivalent-circuit model R(W(CR)(QR))(CR).
Poly(PPA) NaClO4/
ACN
Et4NBF4/ ACN
Bu4NPF6/ ACN
Bu4NClO4/ ACN
Rs (kOhm.cm-2) 2.12 0.09 3.15 1.08
W (Y0/µSsec-0.5.cm-2) 41.66 33.00 37.29 61.91
Ca (mF. cm-2) 1.11 0.23 0.54 0.16
Ra (kOhm.cm-2) 104 1795 1201 2480
CPE (Y0/µSsec-n.cm-2) 433 386 649 123
n 0.73 0.78 0.71 0.77
RCT (kOhm.cm-2) 93.75 7.97 14.97 27.43
CF (µF. cm-2) 0.18 0.12 0.06 0.11
RF (kOhm.cm-2) 12.38 9.53 25.02 28.34
[image:12.596.64.540.574.757.2]
The EEC model is composed of the electrolyte and pore resistance (Rs), the adsorption capacitance and resistance (Ca and Ra), a constant-phase element used to compensate for the roughness of the electrode and used as a model for the double-layer capacitor (Cdl) and inhomogeneity in the system, the charge-transfer resistance (Rct), the Warburg impedance, the diffusive capacitance line (W), and the resistance and capacitance of the polymer film on the GCE (Rf and Cf). Ra and Ca are related to the charging/discharging process at the surface of the film. The solvent resistance Rs is defined as the sum of the resistances of the ion resistance of the electrolyte, the interface contact resistance between the electrode and the electrolyte, and the intrinsic resistance of the electrode. The solvent resistances of the poly(PPA) films in the NaClO4/ACN and Bu4NPF6/ACN supporting electrolyte solutions were higher than the solvent resistances of the poly(PPA) films in the Et4NBF4 and Bu4NClO4/ACN supporting electrolyte solutions. This resulted from the different shapes of the polymers, arising from the varying lengths of the chains, different morphologies, and conductivity of the poly(PPA) layer [66].
(1)
3.6. Mott–Schottky Analysis of the Poly(PPA) Films
The impedance measurements were performed at various applied biases to enable Mott– Schottky analysis, in whichwhere the electrochemical behavior of many semiconductor films can be interpreted when the doping level is situated between the Fermi level and the empty conduction band [73]. The solid/electrolyte interface can be categorized as three layers, which are called the Gouy layer (G), the Helmholtz layer (H), and the space-charge layer in the semiconductor (SC). These layers contribute to the total capacitance of the solid/electrolyte interface, but as both the Gouy and Helmholtz layers are very thin, their capacitance contributions can be neglected [74]. Thus, the total capacitance values that are found by impedance spectroscopy are equal to the space-charge-region capacitance (CSC) [75-77], and a Mott–Schottky plot is constructed when 1/CSC2 is graphed against the applied potential. Thus, the flat-band potential (EFB) of the semiconductor can be determined by intersecting the E-axis of the linear region of plot, and the carrier density (ND) can also be conveniently found by determining ε (in the present study, the assumption is that ε=10), the area (A), and the slope (α) by using equation 2 and 3, respectively [78,79].
(2)
(3)
[image:14.596.55.544.568.663.2]Here, CSC is the space-charge capacitance, A is the area, ND is the carrier density, E is the applied voltage, kB is Boltzmann’s constant, T is the absolute temperature, e is the electronic charge, ɛ is the vacuum permittivity, ɛp is the relative polymer permittivity, and α is the slope of the straight line. A linear relationship between CSC-2 and the applied potential E was observed in Fig. 8. Outside this linear region, the plots are nonlinear due to the inhomogeneity of the charge carriers in the bulk of the semiconductor and at the interfaces [80]. It can be concluded that the capacitance of the interface is dominated by that of the semiconductor (Fig. 8). This means that the poly(PPA) film has semiconductor properties.
Table 3. Semiconductor parameters of the poly(PPA) films.
Electrolyte NaClO4 Bu4NClO4 Bu4NPF6 Et4NBF4
Flat Band Potential, EFB, V 0.41 0.37 0.36 0.32
Carrier Density, ND, cm -3
3.25x10¹⁶ 1.17x10¹⁶ 0.52x10¹⁶ 1.59x10¹⁶
Band gap, electronic, Eg, eV 1.40 1.51 1.63 1.50
Open circuit potential, EOCP, V 0.64 0.32 0.50 0.36
Carrier Type p p p p
electrolyte, as for the position of the band edges, are conveniently expressed by flat band potential (EFB). That is, EFB is the potential necessary to apply to the semiconductor to reduce the band bending to zero [83]. The EFB of the polymer electrode shifts toward the positive potential for Et4NBF4, Bu4NPF6,Bu4NClO4, and NaClO4,the values of which were 0.32, 0.36, 0.37, and 0.41 V, respectively. The increase in EFB helps transfer the charge carriers on the interface [84]. The band-gap energy (Eg) is a very important parameter related to the electronic structure of a semiconducting electrode. The electronic band gap calculated from the CV measurement (graphs are not shown here) is estimated by using the oxidation onset (Eox)and reduction onset (Ered) values and the external ferrocene potential (E1/2ferrocene). The calculations were made using the following equations [85]:
(4) ELUMO=-([Ered-E1/2ferrocene] + 4.8) (5) EHOMO=-([Eox-E1/2ferrocene] + 4.8) (6) Eg= ELUMO-EHOMO
where the Eg values obtained for poly(PPA)-Bu4NPF6,Bu4NClO4, Et4NBF4,and NaClO4 were 1.63, 1.51,1.50,and 1.40 eV (Table 3). This result is important, considering that the semiconductor surface band-edge position is affected by the electrolyte type and also that Eg is inversely proportional to ND. Additionally, Semiconductor type can be revealed from the Mott–Schottky plot reveals whether a semiconductor is p-or n-type. The negative slope of the Mott–Schottky plot indicates p-type conductance, and p-doping occurs in the poly(PPA) film showing a negative slope in the linear region of the plot.
Figure 8. Mott–Schottky Plot for poly(PPA).The inset shows the HOMO-LUMO energy levels and electrochemical band gap obtained for the poly(PPA) films.
4. CONCLUSION
[image:15.596.149.450.404.602.2]
poly(PPA)-Bu4NClO4,and poly(PPA)-Bu4NPF6 films, ND values of 3.25x1016,1.59x1016, 1.17x10¹⁶, and 0.52x1016 cm-3 and flat-band potentials of 0.41, 0.32, 0.37, and 0.36 V, respectively, were obtained for the polymer-modified electrodes. The band-gap energies were derived from cyclic voltammetry. Values of Eg =1.40 eV for poly(PPA)-NaClO4, Eg=1.50 eV for poly(PPA)-Et4NBF4, Eg=1.51 eV for poly(PPA)-Bu4NClO4, and Eg=1.63 eV for poly(PPA)-Bu4NPF6 were obtained. These values varied with the various supporting electrolyte types. These results demonstrate that on a semiconductor surface, the band-edge position is affected by the electrolyte nature. Mott–Schottky plots for these poly(PPA) films reveal that the polymer films are semiconducting materials with narrow band gaps, high carrier densities, and p-type majority carriers. From impedance measurements, the highest value of CDL (2.45 mFcm−2) was obtained for NaClO4/ACN. The effects of various anions on the interfacial properties of the poly(PPA) films were explained by modeling the EIS experimental data. The impedance data were fitted by the equivalent circuit R(W(CR)(QR))(CR), which was used to interpret the polymer electrode/electrolyte interface properties. The surface morphology of poly(PPA) depends on the preparation conditions, and electrolyte nature which affect the optical, morphologic, impedance, and ND properties of the films.
ACKNOWLEDGMENTS
This work was supported by The Scientific & Technological Council of Turkey (TUBITAK)-214Z200 Project.
References
1. S. Sadeghi, E. Fooladi and M. Malekaneh, Appl. Biochem. Biotechnol., 175 (2015) 1603 2. A.T. Mallajosyula, S.S.K. Iyer and B. Mazhari, Curr. Appl. Phys., 13 (2013) 677
3. L. Xia, Y. Xia and Z. Liu, Electrochim.Acta, 151 (2015) 429
4. S.K. Ahn, T. Ban, P. Sakthivel, S.-H. Jin, Y.-S. Gal and J.H. Lee,Macromol. Res., 20 (2012) 459 5. U. Male, B.S. Singu, P. Srinivasan, J.Appl. Poly. Sci., 132 (2015) 42013
6. Y. Luo, Y. Sun, J. Lv, X. Wang, F. Wang, Appl. Surf. Sci., 328 (2015) 247
7. L. Hamadou, L. Aïnouche, A. Kadri, S. Ait Ali Yahia and N. Benbrahim, Electrochim. Acta, 113 (2013) 99
8. K. Potje-Kamloth, Crit. Rev. Anal. Chem. 32 (2002) 121
9. B. Li, G.Sauve , M.C. Iovu, M. Jeffries-El , R. Zhang , J. Cooper , S. Santhanam , L. Schultz , J.C. Revelli , A.G. Kusne, T. Kowalewski, J.L. Snyder, L.E. Weiss, G.K. Fedder, R.D. McCullough and D.N. Lambeth, NanoLett. 6 (2006) 1598
10.J. Janata and M. Josowicz, Nat. Mater., 2 (2003) 19
11.D.W. Hatchett and M. Josowicz, Chem. Rev., 108 (2008) 746.
12.J. Zhang, X. Liu, L. Zhang, B.Cao and S.Wu, Macromol. Rapid Commun., 34 (2013) 532 13.N. Lakshmi and S. Chandra, J. Mater. Sci., 37 (2002) 256
14.Y. Chujo, Mater. Sci., 1 (1996) 811
15.C. Sanchez, F. Ribot, F. Banse, M. Lachini and B. Jousseaume, J. Sol–Gel Sci., Technol,. 8 (1997) 529
16.P. Judeinstein and C. Sanchez, J. Mater. Chem., 6 (1996) 511 17.A.A. Khan and L. Paquiza, Synth. Met. 161 (2011) 899
19.H. Dong, C.M. Li, W. Chen, Q. Zhou, Z. X. Zengand and J. H. T. Luong, Anal. Chem., 78 (2006) 7424
20.H. Dong, X. Cao, C. M. Liand and W. Hu, Biosens. Bioelectron., 23 (2008) 1055 21.W. Hu, C.M. Li, X. Cui, H. Dongand and Q. Zhou, Langmuir, 23 (2007) 2761 22.Y. Hu, Z. Zhao, Q. Wan, Bioelectrochem., 81 (2011) 59
23.A. Glidle, C.S.Hadyoon, A.E.G.Cass and J.M.Cooper, Electrochim. Acta, 45 (2000) 3823 24.M. Senel and C. Nergiz, Curr. Appl. Phys.,12 (2012) 1118
25.M.Yasuzawa,T. Nieda, T. Hirano and A. Kunugi, Sens. and Actuators B, 66 (2000) 77 26.E. Sikora and D.D. Macdonald, J. Electrochem. Soc., 147 (2000) 4087
27.M. Zhou and J. Heinze, J. Phys. Chem. B, 103 (1999) 8451
28.S. Carquigny, O. Segut, B. Lakard, F. Lallemand and P. Fievet, Synth. Met., 158 (2008) 453 29.A. Elmansouria, A. Outzourhit, A. Lachkar, N. Hadik, A. Abouelaoualim, M.E. Achour, A.
Oueriagli and E.L. Ameziane, Synth. Met. 159 (2009) 292
30.E.M. Genies and J.M. Pernaud, J. Electroanal. Chem., 191 (1985) 111 31.P. Nunziante and G. Pistoia, Electrochim. Acta, 34 (1989) 223
32.M.C. Turhan, A.S. Sarac, A. Gencturk, H.-D. Gilsing, H. Faltz and B. Schulz, Synth. Met., 162 (2012) 511
33.P. Liu, X. Wang and H. Li, Synth. Met., 181 (2013) 72
34.W. Chen, X. Li, G. Xue, Z. Wang and W. Zou, Appl. Surf. Sci. 218, (2003) 215
35.G. Zotti, S. Zecchin, G. Schiavan, R. Seraglia, A. Berlin and A. Canavesi, Chem. Mater. 6 (1994) 1742
36.V. Papez, O. Inganas, V. Cimrova and S. Nespurek, J. Electroanal. Chem. Interfacial Electrochem., 282 (1990)123
37.A.S. Sarac, M. Ates, E.A. Parlak and E.F. Turcu, J. Electrochem. Soc., 154 (2007) 283 38.C. Bora and S. KrDolui, Polym. Int., 63 (2014) 1439
39.S. Konwer, J. Maiti and S.K. Dolui, Mater. Chem. Phys.,128 (2011) 283
40.J. Deng, Y. Peng, C. He, X. Long, P. Li and A.S. Chan, Polym. Int., 52 (2003) 1182 41.A. Chen, K. Kamata, M. Nakagawa, T. Iyoda, H.Wang and X. Li, J. Phys. Chem. B, 109
(2005)18283
42.T.A. Skotheim and J. R. Reynolds, Handbook of Conducting Polymers, CRC Press Taylor & Francis Group, Boca Raton (2007).
43.W.J. Bae, K.H Kim, W.H. Jo and Y.H. Park, Macromol., 38 (2005)1044 44.M.V. Kulkarni and B.B. Kale, Sens. and Actuators B, 187 (2013) 407 45.S. Little, S.F. Ralph, C.O. Too, G.G. Wallace, Synth. Met., 159 (2009) 1950
46.G.G. Wallace, P.R. Teasdale, G.M. Spinks and L.A.P. Kane-Maguiresy, Conductive Electroactive Polymers: Intelligent Polymer Systems, CRC Press LLC, Florida (2000)
47.E.H. Katarzyna, R.P. Socha and G.D. Sulka, J. Phys. Chem. C, 117 (2013) 19382 48.T. Osaka, K. Naoi, S. Ogano and S. Nakamura, Chem. Lett., 1687 (1986).
49.S.J. Hahn. W.E. Skchina, W. J. Gadja and P.Vogeihut, J. Electron. Mater.,15, (1986) 145 50.A. Yassar, J. Roncali and F. Garnier, Macromol., 22 (1989) 804
51.F.A. Harraza, J. Electrochem. Soc., 153 (2006) C349
52.J.J.L. Cascales and T.F. Otero, J. Chem. Phys., 120 (2004) 1951
53.J. Dejeu, A. Et Taouil, P. Rougeot, S. Lakard, F. Lallemand and B. Lakard, Synth. Met. 160 (2010) 2540
54.M.F. Suarez, R.G. Compton, J. Electroanal. Chem., 462 (1999) 211
55.V.M. Jovanovic, A. Dekanski, G. Vlajnic and M.S. Jovanovic, Electroanal., 9 (1997) 564
56.M. Iseki, K. Saito, M. Ikematsu, Y. Sugiyama, K. Kuhara and A. Mizukami, J. Electroanal. Chem., 358, 221 (1993).
57.M.A. Vorotyntsev, E. Vieil and J. Heinze, J. Electroanal. Chem., 450, 121 (1998).
59.P. Fiordiponti and G. Pistoia, Electrochim. Acta, 34 (1989) 215
60.F.G. Guler, H.-D. Gilsing, B. Schulz and A.S. Sarac, J. Nanosci. and Nanotechnol., 12 (2012) 1 61.C.S. Ramya and S. Selvasekarapandian, G. Hirankumar, T. Savitha, P.C. Angelo, J. Non-Cryst.
Solids, 354 (2008) 1494
62.M. Ravi, S. Bhavani, K.K. Kumar and V.V.R. Narasimaha Rao, Solid State Sci.19, (2013) 85 63.A.S. Sarac, S.E. Ozgul, A. Gencturk, B. Schulz, H.-D. Gilsing and H. Faltz, Prog. in Org. Coat.,
69 (2010) 527
64.A. Ehsani, M.G. Mahjani, M. Bordbar and S. Adeli, J. Electroanal. Chem.,710, (2013) 29 65.F.G. Guler and A.S. Sarac, Express Poly. Lett., 5 (2011) 493
66.Q. Liu, Y. Wang, Y. Zhang, S. Xu and J. Wang, Synth. Met., 162 (2012) 655
67.M. Fall, A.A. Diagne, M. Guène, C.D. Volpe, P.L. Bonora, F. Deflorian and S. Rossi, Bull. Chem. Soc. Ethiop., 20 (2006) 279
68.U. Rammelt and G. Reinhard, Electrochim. Acta, 35 (1990) 1045 69.Z. Stoynov, Electrochim. Acta, 35 (1990) 1493
70.R. Hurt and J. MacDonald, Solid State Ion., 20 (1986) 111
71.C.S.C. Bose and K. Rajeshwar, J. Electroanal. Chem., 333 (1992) 235 72.C. Johne, R. Fritzsch and A. Ignaszak, Electroanal., 26, 1560 (2014).
73.A.J. Bard and L.R. Faulkner, Electrochemical Methods, John Wiley&Sons, New York, (1980) 74.M. Radecka, M. Rekas, A. Trenczek-Zajac and K. Zakrzewska, J. Power Sour., 181 (2008) 46 75.Z.A. Rotenberg and O.A. Semenkhin, Soviet Electrochem., 25 (1989) 652
76.S. Sunde, G. Hagen and R. Odegard, J. Electroanal. Chem., 345 (1993) 59 77.J. Bobacka, M. Grzeszczuk and A. Ivaska, Electrochim. Acta, 37 (1992)1759
78.U. Rammelt, S. Bischoff, M. El-Dessouki, R. Schulze, W. Plieth and L. Dunsch, J. Solid State Electrochem., 3 (1999) 406
79.C. Pirvu, C.C. Manole, A.B. Stoian and I. Demetrescu, Electrochim. Acta, 56 (2011) 9893 80.N.M. Hemed, A. Inberg, Y. Shacham-Diamand, Electrochim. Acta, 130 (2014) 728
81.X.D. Dang, C.M. Intelmann, U. Rammelt and W. Plieth, J. Solid State Electrochem., 8 (2004) 727 82.J. Ivanco, F. P. Netzer and M.G. Ramsey, J. Appl. Phys., 101(2007) 103712
83.J. Chermiti, M.B. Ali, C. Dridi, M. Gonchar, N. Jaffrezic-Renault and Y. Korpan, Sens. and Actuators B, 188 (2013) 824
84.S. Kumari, C. Tripathi and A.P. Singh, Curr. Scı., 91 (2006)1062
85.A. Shafiee, M.M. Salleh and M. Yahay, Sains Malaysiana, 40 (2011)173
![Figure 6. SEM images of poly(PPA) electrochemically obtained by cyclic voltammetry on ITO CE: [PPA]0 = 10 mM; potential range = 0-1.4 V; scan rate = 50 mV s-1; eight cyclesfor a) in 0.1M Bu4ClO4/ACN; b) 0.1M Et4NBF4/ACN; c) 0.1M NaClO4/ACN;and d) 0.1M Bu4](https://thumb-us.123doks.com/thumbv2/123dok_us/1888987.146430/9.596.106.492.214.574/figure-electrochemically-obtained-cyclic-voltammetry-potential-cyclesfor-naclo.webp)
![Figure 7. a)Nyquist plots, b) Bode-Magnitude plots,and c) Bode-Phase plots for poly(PPA) electrocoated onto GCEswith [PPA]0 =10 mM in 0.1 M NaClO4/ACN,Et4NBF4/ACN, Bu4NClO4/ACN, and Bu4NPF6/ACN solutions](https://thumb-us.123doks.com/thumbv2/123dok_us/1888987.146430/11.596.119.471.353.637/figure-nyquist-magnitude-phase-electrocoated-gceswith-naclo-solutions.webp)