Int. J. Electrochem. Sci., 8 (2013) 3357 - 3370
International Journal of
ELECTROCHEMICAL
SCIENCE
www.electrochemsci.org
Determination of Equivalent Circuit Parameters of a
Contactless Conductive Detector in Capillary Electrophoresis by
an Impedance Analysis Method
Zhenli Zhang1,2, Yaolong Li1, Zhongshi Xu1, Xilei Zhu1, Qi Kang1*, Dazhong Shen1,3* 1
The Key Lab in Molecular and Nano-materials Probes of the Ministry of Education of China, College of Chemistry, Chemical Engineering and Materials Science, Shandong Normal University, Jinan, 250014, P.R. China.
2
Zibo Institute of Product Quality Supervision & Inspection, Zibo, 250063, P.R.China 3
Key Laboratory of Chemical Biology and Traditional Chinese Medicine Research (Hunan Normal University), Ministry of Education, Changsha,410081, P.R.China
*
E-mail: qikang@sdu.edu.cn;dzshen@sdnu.edu.cn;
Received: 29 December 2012 / Accepted: 6 February 2013 / Published: 1 March 2013
The equivalent circuit parameters of a capacitively coupled contactless conductive detector (C4D) were measured by an impedance analysis method. The change in the equivalent circuit parameters was explained by an electrical line distribution model. It was shown that the total impedance of a C4D under capillary electrophoresis conditions is composed mainly of the impedance from the wall capacitor (CW). The value of CW is much less than that predicted from a cylinder capacitor model. With increasing solution conductivity in the capillary, the value of CW increases. As the electrode length increases, Cw increases and attains to a plateau value. The effective electrode length is obviously less than its geometrical length. As the operating frequency increases, the value of Cw reduces dramatically. The response of a C4D is due to the changes in both of Cw and solution resistance.
Keywords: Contactless conductivity detector; Capillary electrophoresis; Impedance analysis, Equivalent circuit parameter
1. INTRODUCTION
easy handle alternative to the contact conductivity method. The applications of C4D were reported in high-performance liquid chromatography [9,10], ion chromatography [11,12] and flow injection analysis [13], non-invasive characterization of monolithic stationary-phase coatings [14,15], measurement of electroosmotic flow [16], and conductivity of aqueous droplets in segmented flow[17].
A C4D makes use of two sensing electrodes placed in close proximity to a microchannel where detection is performed. An alternating actuator voltage is applied to the input electrode and coupled capacitively through the solution in microchannel to signal electrode. The pick-up current is subsequently detected as the response signal of C4D in a chromatogram. The theoretical aspects related to the response of C4D are helpful to show how the detector can be optimized further. The equivalent electrical models were reported to describe the response of C4D [2,18,19]. The influences of the factors such as operating frequency [20-22], excitation voltage [23], detection cell geometry [24], wall thickness of capillary [25], stray capacitance [26,27], and design of detection system [28] on the response of C4D were investigated. To our best knowledge, the measurement of equivalent circuit parameters of C4D under capillary electrophoresis conditions has not been reported.
In this work, the equivalent circuit parameters of C4D were measured by an impedance analysis method. The influences of solution conductivity, operating frequency, electrode length and electrode gap size on the wall capacitance (CW), solution resistance (RS) and solution capacitance (CS) of C4D were investigated. The changes in these parameters were analyzed by an electrical line distribution model.
2. EXPERIMENTAL
2.1. Reagents and instrumentation
A schematic representation of the experimental setup for impedance measurement of C4D is presented in Fig.1.
16
1
…
…
23 4
4294A Impedance
Analyzer 16
1
…
…
23 4
4294A Impedance
Analyzer 1
…
…
23 4
4294A Impedance
[image:2.596.194.404.553.697.2]Analyzer
Fused silica capillary (with inter diameter of 50 m, outside diameter of 325 m and thickness of polyimide-coated layer of 20 m) was production of Yongnian Optical Fiber Factory (Hebei, China). The contactless electrodes were fabricated from syringe cannulas of a given length (1-18 mm). The gap size between the input and signal electrodes was measured by a magnifying glass provided with a scale. To increase the signal-to-noise ratio in impedance data, the parallel array of 16 C4Ds with the same electrode geometry was employed and set in a grounded shielding box. A grounded copper plate (thickness of 0.5 mm) was mounted between the input and signal electrodes to minimize the stray capacitance. Sixteen holes (with diameter of 0.45 mm) were bored in the copper plate and Teflon insulation film (thickness of 0.2 mm) to pass the array of capillary. Impedance measurements were performed in an impedance analyzer (Model 4294A, Agilent) at the constant laboratory temperature of 25 1C. A user program written in Visual Basic 6.0 was used to acquire and process the impedance data. The averaged admittance data were divided by 16 and used to calculate the equivalent circuit parameters in a single C4D.
All chemicals were of reagent grade and deionized water (Millipore, Bedford, MA, USA) was used throughout. All solutions were degassed by ultrasonication and filtered through 0.2 m nylon syringe filters prior to use.
2.2 Measurement of the equivalent circuit parameters in an impedance analysis method.
Prior to measurement, the impedance analyzer was calibrated at given measuring frequency region. The capillary array was flushed with 0.1 M NaOH for 3 min, deionized water for 5 min and acetone for 3 min, and dried by passage of nitrogen stream for 10 min. The residual capacitance of the C4D array with dry capillaries was measured and recorded as the leakage capacitance (C0). The capillary array was filled with KCl solution of given specific conductivity. The conductance (G) and susceptance (B) of the C4D array were scanned. The averaged values of G and B at each frequency in ten repetitive measurements were recorded. The equivalent circuit parameters of C4D in Fig.2A were
C
0(A)
R
SC
SC
W1C
W2R
1X
1C
wC
sC
s=K
C
0=C
air(B)
C
0(A)
R
SC
SC
W1C
W2R
1X
1C
wC
sC
s=K
C
0=C
airR
R
11X
X
11C
wC
sC
wC
sC
s=K
C
0=C
air(B)
[image:3.596.115.489.544.678.2]
estimated by the method discussed in section 3.1. When the solution in capillary array was replaced by another test solution, the equivalent circuit parameters of C4D in a new solution were measured again.
3. RESULTS AND DISCUSSION
3.1 Estimation of the equivalent circuit parameters of C4D by impedance analysis method
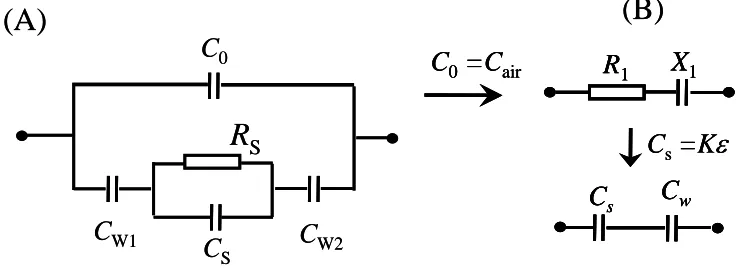
Analysis of the equivalent circuit of C4D is helpful to optimize detector. Figs.2A depicts a typical simplified equivalent circuit model for C4D [2,18,19,29,30]. Accordingly, the admittance of C4D, Y, is expressed by:
2 S W2
W 0 2
2
) 1 (
) (
) (
) 1
(
C C C
C i G
iB G
Y S
(1)
where GS=1/RS =K, Cs= K0r, CS and GS are the solution capacitance and conductance, K is the cell constant, and r are the specific conductivity and relative dielectric constant of the test solution, 0=8.8541012 F/m, respectively. And CW= CW1CW2(CW1+CW2)1, is the total series wall capacitance in C4D, = (RS CW)1, is the ratio of capacitive impedance from capillary wall to solution resistance, =CS/CW, is the ratio of solution capacitance to wall capacitance, i = is the imaginary unit, respectively.
In the parallel arrangement measurement model, the real part (G) and imaginary part (B) of a combination of electrical elements (C4D in this work) were measured simultaneously at a given frequency in an impedance analyzer. As can be seen in Eq.(1), the values of G and B are related to three and four elements in Fig.2A, respectively. In order to understand the electrical response of C4D, it is necessary to calculate these equivalent circuit parameters by using the values of G and B measured in an impedance analysis method.
As shown in Fig.2A, C0 is in a parallel arrangement with the series branch of solution and wall impedance. When the capillary array was dried by a nitrogen stream, the series branch through solution is assumed to cut off because the high impedance from the dry channels in capillaries. Hence, the value of C0 in C4D was measured directly in such situation. Under our experimental conditions, the value of C0 in a single C4D is in the range of 0.08-0.26 fF in the frequency range from 50 kHz to 5 MHz. Because the value of C0 is related to the shielding conditions, iIt is difficult to compare its value in different C4D designs. On the other hand, the value of C0 is small under well designed shielding conditions. Hence, the change in C0 is not discussed in this work.
) ( 2 2 2 2
1 2
1
K B G G R (2) 2 2 2 2 1 2 1 1 1 s s s
w G C
C C B G B X (3)
Based on Eq.(2), the cell constant (K) is estimated firstly by using the known solution conductivity and dielectric constant (r=78). Afterward, the values of GS, CS and RS are calculated from the values of K, and r. Finally, the value of CW is calculated by the following equation.
1 2 2 2 2 2 1 2 1 s s s w C G C B G B C (4)
Thus, the four equivalent circuit parameters of C4D in Fig.2A are estimated by the proposed impedance analysis method.
3.2 Influence of solution conductivity on RS in C4D
Usually, the value of RS is expressed as:
2 1 1 r d G R S
S (5)
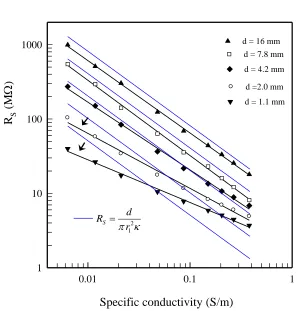
where d is the electrode gap size, r1 is the radius of the microchannel in capillary, respectively. The dependence of RS on solution conductivity is shown in Fig.3. As expected, RS decreases near-linearly with increasing in the figure under dual-logarithmic coordinates. However, the value of RS deviates the predication from Eq.(5) if the geometrical electrode gap is used, especially in the C4D with a short electrode gap. In the C4Ds with d = 1.1 mm and d = 2.0 mm, for example, the values of RS are less than the predictions by Eq.(5) in solutions with <0.04 S/m and <0.06 S/m, respectively. But a contrary case was observed in solutions of higher conductivity. As reported previously [21], the resistance values obtained from the Bode plots are slightly higher than the resistance values calculated by Eq.(5). They concluded that the actual cell resistance is not completely determined by the solution between the ends of the electrodes but to a small extent also by the volume inside each electrode. As the electrode gape size increases, the value of RS increases. The values of RS in the C4D with d = 4.2 are close to the predictions. In the C4Ds with d = 7.8 mm and d = 16 mm, the values of RS are less than the predictions in the solutions tested. On the other hand, a decrease in solution capacitance with increasing conductivity is observed in C4D with a given gap (data is not shown).
3.3 Influence of solution conductivity on CW in C4D
Specific conductivity (S/m)
0.01 0.1 1
R S
(
M
)
1 10 100 1000
d = 1.1 mm d =2.0 mm d = 4.2 mm d = 7.8 mm d = 16 mm
2
1
r d RS
Specific conductivity (S/m)
0.01 0.1 1
R S
(
M
)
1 10 100 1000
d = 1.1 mm d =2.0 mm d = 4.2 mm d = 7.8 mm d = 16 mm
2
1
r d RS
Figure 3. Influence of the solution conductivity on the solution resistance in C4D with different gap sizes . Other conditions: L=18 mm, f =200 kHz.
) / ln( 2
1 2
0 1
r r L
C r
w
(6)
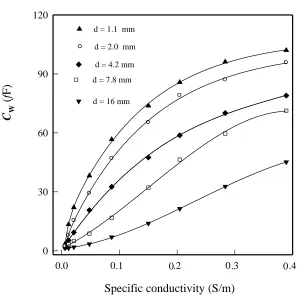
where L is the electrode length, r2 is the outer diameter of the capillary, r is the relative permittivity of wall, respectively. By using the values of L=18 mm, r1=50 m, r2=375 m and r =4.4 (quartz) under our experimental conditions, there should be Cw =1.1 pF (Cw1= Cw2) in all test solutions.
As shown in Fig.4, however, the value of CW is much less than this predication (1.1 pF), especially in solutions of low conductivity. For example, the CW values measured in C4D (d =1.1 mm) in 1 and 30 mM KCl solutions are 13.4 and 103 fF, which is about 1.24% and 9.4% of the predication. In addition, the value of CW increases near-linearly with increasing solution conductivity. As the electrode gap size increases, the value of CW decreases further.
To explore the discrepancy between the values measured and predicated, the value of CW was calculated by a more precise way. In fact, the value of Cw1 or Cw2 in C4D is related to four equivalent capacitors with different dielectric materials, i.e., air capacitor between the contactless electrode and polyimide layer (C1), polyimide layer capacitor (C2), quartz wall capacitor (C3) , and double-layer capacitor at quartz/solution interface (C4). Under our experimental conditions, the inter diameter of the syringe cannula is 400 m, we have C1 = 15.5 pF by using the values of L=18 mm, r1=375 m, r2=400
[image:6.596.144.447.81.392.2]
Figure 4. Influence of the solution conductivity on the wall capacitance in C4D with different gap sizes. Other conditions: L=18 mm, f =200 kHz.
m, r2=375 m and C2=24.5 pF. Similarly, the capacitance from quartz wall (r1=50 m, r2=325 m) is C3=2.35 pF. As the double-layer capacitor at solid/solution interface is in the order of 0.1-10 F/cm2, the value of C4 (2-200 nF), which is much lager than C1, C2 and C3. The total series capacitance of the four equivalent capacitors is equal to 1.88 pF. The new predicted value of CW = 0.94 pF in C4D is still much larger than the measured values.
To explain the discrepancy between the values of CW measured and predicated, a simplified electrical line distribution model in Fig.5 is proposed in this work. When the capillary is filling by solution of low conductivity, the electrical lines from electrode to solution are not perpendicular to the capillary, the passing distance of the electrical lines is larger than the thickness of capillary (Fig.5A). Hence, the value of CW is less than the predication according to a cylinder capacitor model. With increasing solution conductivity, the width of the detection zone (between the electrodes to pass through the electrical lines) increases, which is supported by the decrease in CS. The angles between the electrode and electrical lines () increase and the distance of the electrical line from the electrode to solution reduces (Fig.5B). Hence, the value of CW increases with increasing conductivity. In the work of Kubáň and Hauser [21], the experimental values of CW were about 4 times smaller than the calculated ones. They ascribed the discrepancy to the fact that the electrolyte solution inside the capillary is not a metallic conductor of low resistance as assumed by the model. When the capillaries were filled with mercury as an extreme case of high conductivity, the electrical lines are perpendicular to the capillary (Fig.5C). The passing distance of the electric lines from electrode to solution is equal to
Specific conductivity (S/m)
0.0 .1 .2 .3 .4
C W
(
f
F)
0 30 60 90 120
d = 1.1 mm
d = 4.2 mm
d = 7.8 mm
d = 16 mm d = 2.0 mm
0 0 0 0
Specific conductivity (S/m)
0.0 .1 .2 .3 .4
C W
(
f
F)
0 30 60 90 120
d = 1.1 mm
d = 4.2 mm
d = 7.8 mm
d = 16 mm d = 2.0 mm
[image:7.596.151.459.88.385.2]
A
B
C
HgInput GND Signal
<90º
<90º
=90 º
A
B
C
HgInput GND Signal
A
B
C
HgInput GND Signal
<90º
<90º
[image:8.596.162.419.74.376.2]=90 º
Figure 5. Simplified illustration for electrical line distribution models in C4D under different situations (not to scale). (A): filled by solution of low conductivity; (B): filled by solution of high conductivity ; (C): filled by mercury.
the thickness of capillary wall. The value of CW =1.05 pF was measured, which is close to the predication because the cylinder capacitor model is holden in such case.
According to the model in Fig.5A, with increasing electrode gap size, the passing distance of the electrical lines from electrode to solution increases, hence, the value of CW reduces.
3.4 Influence of electrode length on CW , CS and RS in C4D
Figure 6. Influence of electrode length on wall capacitance (A),solution resistance (B) and solution capacitance (C) in C4D. Other experimental conditions: d =1.1 mm, f =200 kHz.
Electrode length (mm)
0 5 10 15 20
C
S(
f
F)
0.0 .6 1.2 1.8 2.4 3.0C
W(
f
F)
0 30 60 90 120R
S(
M
)
1 10 100 30 mM 10 mM 5 mM 1 mM 1 mM 5 mM 10 mM 30 mM 1 mM 5 mM 10 mM 30 mMA
B
C
Electrode length (mm)
0 5 10 15 20
[image:9.596.106.462.90.705.2]
a larger solution resistance. Hence, the effective electrode length in C4D is less than its geometrical length.
The influence of electrode length on solution resistance and solution capacitance in C4Ds with d =1.1 mm is shown in Figs.6B and 6C. With increasing electrode length, the value of RS increases while the value of CS decreases slightly. This result reveals that a wider detection zone occurs in the C4D with a larger electrode length. It should be noted that the increase in electrode length is helpful to enhance the sensitivity of C4D due to larger CW. On the other hand, however, the increase in detection zone length with increasing electrode length corresponds to a larger detection volume, which is disadvantageous for the peak resolution in capillary electrophoresis.
3.5 Influence of operating frequency on Cw and Rs in C4D
It was shown that the operating frequency is an important factor to influence the response of C4D [20-22]. Fig.7 illustrates the values of CW and RS measured at the frequency range from 50 kHz to 5 MHz, which covers the frequency region reported in references [4,7]. With increasing operating frequency, the effective electrode length in C4D is reduced [24]. In addition, the detection zone in capillary is thought to be compressed due to the skin effect at high frequency. Hence, Cw reduces dramatically and RS decreases near-linearly with increasing frequency.
As the signal current in C4D is proportional to |Y|, which stands for the response characteristic of C4D itself. As shown in Fig.8A, with increasing measuring frequency, the value of |Y| increases until to a maximum then decreases. It was shown that the operating frequency corresponding to the maximum response signal is related to the experimental conditions, including input-signal amplitude [20,32], amplifier[21], cell dimension [33].
To explain the frequency characteristic of C4D, the values of = |XCw|/Rs = (RS Cw)1 were calculated and shown in Fig.8B. It can be seen that the reactance from CW is larger than the resistance from solution, except in 1 mM KCl solution with f <130 kHz. Under the condition of Cw >> CS and Cw >> C0 in the region of low frequency, there are 1+1 and 1+ 1 in Eq.(3), the expression of |Y| is simplified as:
2 2
2
1 1 1
| |
S Cw
S X R
R
Y (7)
With increasing frequency, the value of RS decreases, according to Eq.(7), an increase in |Y| is expected because the change in value of is slightly (see Fig.8B). In the region of high frequency, the value of increases with increasing frequency. The value of |Y| is close to (Cw+C0). In the frequency range from 500 to 5000 kHz, the regressed relation: lgCW =mnlgf was obtained. The values of n are 1.09, 1.61, 1.48 and 1.27 in 1,5,10 and 30 mM KCl solutions, respectively. Consequently, the value of
Figure 7. Influence of measuring frequency on the wall capacitance (A) and solution resistance (B) in C4D. Other experimental conditions: L=18 mm, d =1.1 mm. KCl concentration: (1): 1 mM; (2): 5 mM; (3): 10 mM; (4): 30 mM.
frequency region due to the much less CW in the latter, especially in solutions of low conductivity. It should be noted that only the frequency behavior of C4D itself is measured in the impedance analyzer. In the applications of C4D, a simplified detection circuitry is employed due to its much lower cost and higher measurement speed at a given frequency in compared with an impedance analyzer. The frequency behavior of the C4D response recorded by a detection circuitry depends on both of that of C4D and the circuitry. Because of the difference in the design of detection circuitry and the dimension of C4D, the optimization of operating frequency for maximum sensitivity is related to the experimental conditions.
C
W(
f
F)
.1 1 10 100
30 100 1000 10000
Measuring frequency (kHz)
R
S(
M
)
1 10 100
0
1 2 4
3
1
2
4 3
B
A
C
W(
f
F)
.1 1 10 100
30 100 1000 10000
Measuring frequency (kHz)
R
S(
M
)
1 10 100
0
1 2 4
3
1
2
4 3
Figure 8. Influence of the measuring frequency on the admittance magnitude (A) and the ratio of reactance of wall capacitance to solution resistance (B) of C4D. Other experimental conditions: L=18 mm,d =1.1 mm. KCl concentration: (1): 1 mM; (2): 5 mM; (3): 10 mM; (4): 30 mM.
4. CONCLUSION
An impedance analysis method was employed to measure the equivalent circuit parameters of C4D in capillary electrophoresis. The change in the parameters was analyzed by an electrical line distribution model. As the electrical lines from the electrode to solution are not perpendicular to the capillary, the wall capacitance is much less than the prediction from a cylinder capacitor model. With
|Y|
(
n
S
)
0 40 80 120 160Measuring frequency (kHz)
|
X
C W|/
R
S 0 6 12 18 1 2 4 3 1 2 4 3 =130 100 1000 10000
A
B
|Y|
(
n
S
)
0 40 80 120 160Measuring frequency (kHz)
|
X
C W|/
R
S 0 6 12 18 1 2 4 3 1 2 4 3 =130 100 1000 10000
|Y|
(
n
S
)
0 40 80 120 160Measuring frequency (kHz)
|
X
C W|/
R
S 0 6 12 18 1 2 4 3 1 2 4 3 =130 100 1000 10000
A
[image:12.596.136.510.102.570.2]
increasing solution conductivity, the value of wall capacitance and the length of detection zone increase, the cell constant of the detector decreases. With increasing electrode length, Cw and Rs increase and attain plateau values. Only part of the liquid in capillary within the electrode takes part in the conducting of signal current. As the electrode gap size and operating frequency increase, the values of CW and RS reduce. A maximum admittance magnitude was observed on the frequency dependent curve. It was shown that the total impedance of a C4D under capillary electrophoresis conditions is composed mainly by the impedance from the wall capacitor. The response of C4D is due to the change in both of CW and RS.
ACKNOWLEDGEMENTS
This work was financially supported by the National Natural Science Foundation of China (No.20975062, 21175084, 21275091) ,the Opening Fund of Key Laboratory of Chemical Biology and Traditional Chinese Medicine Research (Hunan Normal University), Ministry of Education (KLCBTCMR2001-01) and Research Fund for the Doctoral Program of Higher Education of China (No. 20113704110003)
References
1. A.J. Zemann, E. Schnell and D. Volgger, Anal. Chem.,70(1998)563. 2. J.A.F. da Silva and C.L. do Lago, Anal. Chem. 1998, 70(1998)4339. 3. M. Pumera, Talanta, 74 (2007)358.
4. P. Kubáň and P.C. Hauser, Anal. Chim. Acta ,607 (2008)15. 5. P. Kubáň and P.C. Hauser, Electrophoresis, 30(2009)176.
6. A.A. Elbashir and H.Y. Aboul-Enein, Biomed. Chromatogr.,24(2010)1038. 7. P.Kubáň and P.C. Hauser, Electrophoresis, 32(2011)30.
8. W.K.T. Coltro, R.S. Lima, T.P. Segato, E. Carrilho, D.P. de Jesus, C.L. do Lago and J. A. F. da Silva, Anal. Methods, 4(2012)25.
9. P. Kubáň and P.C. Hauser, J. Chromatogr. A, 1128 (2006)97.
10. E. Gillespie, D. Connolly, M. Macka, P. Hauser and B. Paull, Analyst, 133(2008)1104. 11. P. Kubáň, M.A. Müri and P. C. Hauser, Analyst, 129(2004)82.
12. E. Gillespie, D. Connolly, M. Macka, P.N. Nesterenko and B. Paull, Analyst, 132 (2007)1238. 13. A. Makahleh and B. Saad, Anal. Chim. Acta, 694 (2011)90.
14. E. Gillespie, D. Connolly, P.N. Nesterenko and B. Paull, Analyst, 133(2008)874.
15. D. Connolly, P. Floris, P.N. Nesterenko and B. Paull, Trends Anal. Chem., 29(2010)870. 16. R.M. Saito, C.An. Neves, F.S. Lopes, L. Blanes, J.G.A. Brito-Neto and C.L. do Lago, Anal.
Chem.,79(2007)215.
17. B.P.Cahill, R. Land, T. Nacke, M. Min and D. Beckmann, Sens. Actuators B, 159, (2011)286. 18. B. Gaš, J. Zuska, P. Coufal and T. van de Goor, Electrophoresis, 23(2002)3520.
19. S.E. Johnston, K.E. Fadgen, L.T. Tolley and J.W. Jorgenson, J. Chromatogr. A, 1094 (2005)148. 20. J.F. da Silva, N. Guzman and C.L. do Lago, J. Chromatogr. A, 942 (2002)249.
21. P. Kubáň and P.C. Hauser, Electrophoresis, 25 (2004)3387.
22. J.A. Brito-Neto, J.F. da Silva, L. Blanes and C.L. do Lago, Electroanalysis,17(2005)1198. 23. J. Tanyanyiwa, B. Galliker, M. A. Schwarz and P. C. Hauser, Analyst, 127(2002) 214. 24. P. Tůma, F. Opekar and K. Štulík, Electrophoresis, 23(2002)3718.
27. J.A. Brito-Neto, J.F. da Silva, L. Blanes and C.L. do Lago, Electroanalysis, 17(2005)1207. 28. K. J.M. Francisco and C. L. do Lago, Electrophoresis, 30(2009)3458.
29. E. Baltussen, R. M. Guijt, G. van der Steen, F. Laugere,S. Baltussen and G. W. K. van Dedem,Electrophoresis, 23(2002)2888.
30. A. J. Zemann, Electrophoresis, 24(2003)2125.
31. C. G. Chen, L. G. Li, Y. J. Si and Y. P. Li, Electrochim. Acta, 54(2009)6959. 32. W. K. T. Coltro, J. A. F. da Silva and E. Carrilho, Electrophoresis,29(2008)2260.
33. C.Y. Lee,C. M. Chen,G.L. Chang, C.H. Lin and L.M. Fu, Electrophoresis, 27(2006) 5043.