International Journal of
ELECTROCHEMICAL
SCIENCE
www.electrochemsci.org
Automated Voltammetric Determination of Lead(II) Ions Using
Sensor Array
David Hynek1,2,3, Jan Prasek3,4, Petra Businova4, Jaromir Zak4, Jana Drbohlavova3,4, Jana Chomoucka3,4, Jindrich Kynicky3,5, Marie Konecna1,2,3, Martin Brnicky6, Jaromir Hubalek2,3, Radimir Vrba3, Rene Kizek1,2,3, Vojtech Adam1,2,3*
1
Department of Chemistry and Biochemistry, and 6 Department of Agrochemistry and Soil Science, Microbiology and Plant Nutrition, Faculty of Agronomy, Mendel University in Brno, Zemedelska 1, CZ-613 00 Brno, Czech Republic, European Union
2
Lead and Cadmium Initiatives, United Nation Environment Program, Faculty of Agronomy, Mendel University in Brno, Zemedelska 1, CZ-613 00 Brno, Czech Republic, European Union
3
Central European Institute of Technology, Brno University of Technology, Technicka 3058/10, CZ-616 00 Brno, Czech Republic, European Union
4
Department of Microelectronics, Faculty of Electrical Engineering and Communication, Brno University of Technology, Technicka 3058/10, CZ-616 00 Brno, Czech Republic, European Union
5
Department of Geology and Pedology, Faculty of Forestry and Wood Technology, Mendel University in Brno, Zemedelska 1, CZ-613 00 Brno, Czech Republic, European Union
*
E-mail: [email protected]
Received: 27 November 2012 / Accepted: 15 March 2013 / Published: 1 April 2012
The aim of this work was to design and to construct new automated system for electrochemical determination of metal ions. For this purpose, we connected three commercially available instruments with sensor field and control box. Suggested field consists from 96 electrode systems, in which working electrode was made from carbon. The detection limit (3 S/N) was estimated as 1 µg/ml. The array was successfully correlated with atomic absorption spectrometry and applied for analysis of rainwater samples.
Keywords: Lead; Electrochemical Analysis; Screen Printed Electrode; Differential Pulse Voltammetry; Automated Analysis
1. INTRODUCTION
suggested for detection of various analytes including metal ions [1-6], peptides [7-11], proteins [12-24], nucleic acids [25-36] and others [37,38]. The classic electrochemical instrumentation is consisted of potentiostat/galvanostat with electrochemical cell including three electrodes (working, reference and auxiliary). As the working electrode, hanging mercury drop electrode (HMDE) is commonly used [39]. HMDE can be also modified by biologically active substances to improve sensitivity or selectivity of heavy metal ions detection [38,40-44]. Due to adverse effects of Hg(II) and many restrictions for usage of this metal, carbon electrodes has been found as an alternative [45-53]. As we mentioned above, the trend of the analytical techniques is to miniaturize the whole instrument, in which carbon electrodes have much more advantages compared to HMDE [54-57].
Electrochemical methods are often used for environment monitoring including determination of pollutants including metal ions [58-64]. Lead as one part of heavy metals group pose a risk to human health and the environment due to its toxicity, because even exposure to low quantities can be life threatening [40,65]. Levels of lead are not stable in the environment and vary according to industrial production, urbanization, climate changes and many other factors [66]. The levels of lead vary between 4 and 20 mg/g of dust. Uncontaminated waters contain lead within concentration ranging from 0.001 to 0.06 mg/l. In soils, levels of lead reach 5 to 30 mg per kg of soil [5]. The toxicity of lead in humans mainly arises from its mimicking action of occupying the calcium binding sites on numerous calcium-dependent proteins in cells resulting in the corresponding impairment of physiological functions [67-69].
Numerous analytical, bioanalytical, biochemical and biological instruments have been developed for determination of specific and/or group of compounds, species, cells even organisms, but most of them suffer from the impossibility to miniaturize these instruments in spite of the fact that they have many other advantages. Analysis in environment and biological monitoring brings one another requirement, and it is measuring of a large number of samples in short time. Due to the above-mentioned facts developing and suggesting of simple analytical instruments, methods and procedures with low detection limits and providing on-line and in situ monitoring of environment are needed [70]. Combining advantages of electrochemistry and fore-mentioned requirements led us to the suggestion of a new sensor array created with 96 three-electrode system.
2. EXPERIMENTAL PART
2.1 Chemicals
2.2 Preparation of deionised water and pH and conductivity measurement
The deionised water was prepared using reverse osmosis equipment Aqual 25 (Czech Republic). The deionised water was further purified by using apparatus MiliQ Direct QUV equipped with the UV lamp. The resistance was 18 MΩ. The pH and conductivity of standard solutions and rainwater samples were measured using pH meter WTW inoLab (Weilheim, Germany).
2.3 Rainwater
Rainwater samples were collected from field laboratory weather-station Bořitov, Czech Republic, which is located at an altitude of 310 meters above sea level, on latitude 49 27 46 and longitude 16 34 00. The data on the pressure gauge were read from an altitude of 311.82 meters above sea level. The top of the rain gauge was at a height of 311.55 meters above sea level.
2.4 Fully automated pipetting system
Fully automated pipetting was carried out on automated pipetting system epMotion 5075 (Eppendorf, Germany). The pipetting provides a robotic arm with dispensing tools (TS50, TS300, TS1000), which are in the positions T1 – T4. The samples are placed in the positions B2 and C2 in Eppendorf Rack for 96 Test Tubes (diameter 10.9 mm and max. 75 mm length, no temperature control). Eppendorf Reservoir Holder with 7 × 30 ml reservoirs (maximum filling volume: 30 ml, working volume: 25 ml, detection limit optical sensor: 3,000 µl) was located in the position B1, where acetate buffer and standard lead solutions were available. The device was controlled by the PC software (Eppendorf). The tips were located in the A3 (epTIPS Motion, 50 µl) and A2 (epTIPS Motion, 300 µl) positions. The experimental program is described in Results and Discussion section.
2.5 Sensor array system
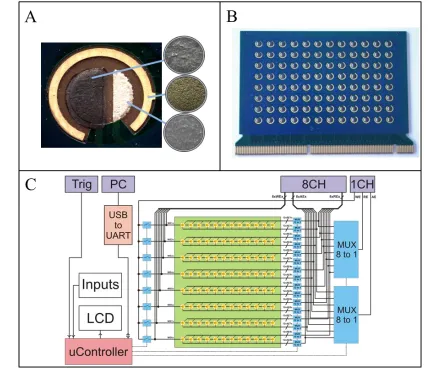
All electrodes were galvanically covered by standard gold film during the printed circuit board fabrication process. Unmodified gold film was used as an active layer for auxiliary electrode (AE). The reference electrode (RE) and working electrode (WE) active layers were screen-printed over the gold film electrodes using Aurel MOD. 880 screen printer (Aurel Automation, Italy). RE were fabricated using DuPont 5874 polymer Ag/AgCl paste (DuPont, USA), which was screen-printed and then dried at 120°C for 5 minutes in box oven. WE were fabricated using DuPont BQ221 polymer carbon based paste, which was screen-printed and then dried at 130°C for 10 minutes in box oven. Detail of a three-electrode sensor area is shown in Fig. 1A. To prevent leakage of the analyte across the sensor array, the array was covered with polymer based insulation layer, in which the holes for three-electrode systems were opened only. This layer was made of ESL 423-S paste (ESL Electroscience, UK), which was screen-printed over the sensor and cured at 125°C for one hour in box oven.
employed. As the supporting electrolyte acetate buffer (0.2 M CH3COOH + 0.2 M CH3COONa) was
used. Applied volume of sample, which was pipetted on one sensor field position, was 50 µl. DPV conditions were as follows: initial potential -1.0 V, end potential -0.2 V, modulation time 0.01 s, step potential 5 mV, pulse potential 0.1 V, scan rate 0.05 V/s.
2.7 Atomic absorption spectrometry (AAS)
Measurements were carried out on 240 FS AA Agilent Technologies Atomic Absorption Spectrometer with deuterium lamp background correction (Germany). The lead hollow cathode lamp (Agilent) was used as the radiation source. The spectrometer was operated at 217.0 nm resonance line with a lamp current of 10 mA and a spectral bandwidth of 1.0 nm. The flame type air-acetylene was used. The results were evaluated in integration measurement mode.
2.8 Mathematical treatment of data and estimation of detection limits
Mathematical analysis of the data and their graphical interpretation was realized by software Matlab (version 7.11.). Results are expressed as mean ± standard deviation (S.D.) unless noted otherwise (EXCEL®). The detection limits (3 signal/noise, S/N) were calculated according Long and Winefordner [71], whereas N was expressed as standard deviation of noise determined in the signal domain unless stated otherwise.
3. RESULTS AND DISCUSSION
3.1 Sensor array system
levels by FT232R chip and connected directly to microcontroller. All devices are made on standard four-layer FR4 PCB (Pragoboard, Czech Republic), where one layer is used as a shielding for sensitive circuit parts (analog circuits and working electrodes). Sensor selection (for multi or single channel output) is provided manually (by user buttons), automatically (after time delay defined by user) or externally (universal two wire link driven by open collector outputs or PC USB, Fig. 1C). External driven allows resetting sensor position to sensor 1A or increase actual sensor position.
Figure 1. (A) Detail of a three-electrode sensor area. (B) Fabricated sensor array on the PCB. (C) Scheme of the sensor array connected to the sensor multiplexor.
3.2 Fully automated measuring system
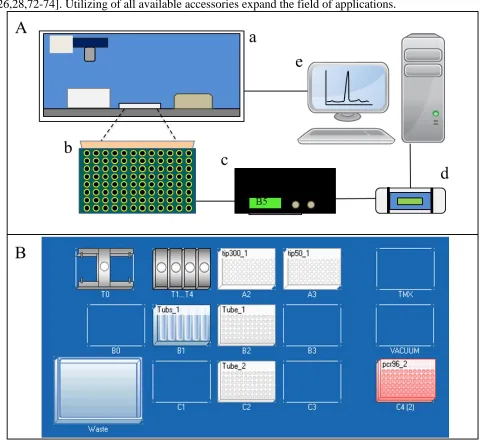
The whole system consisted from five parts: two parts are developed relate to the defined condition on the start of the experiment – there were sensor field, which is described above and control box. The other three parts of system are commercial available instruments: automated pipetting station EpMotion 5075, PalmSens potentiostat and PC. The schematic view of system is shown in Fig. 2A.
3.2.1 Construction of automated measuring system
[image:5.596.81.515.173.542.2]positions. The manipulation with samples, standards and electrolyte was driven by pipetting station. There is also to possibility to connect the pipetting station with accessories as isolation on paramagnetic particles, hybridization procedures, filtration procedures and heat-dependent procedures [26,28,72-74]. Utilizing of all available accessories expand the field of applications.
Figure 2. (A) Schematic view of automatic measuring system consisted of (a) automatic pipetting station, (b) sensor array, (c) control box of sensor array, (d) PalmSens detector and (e) PC. (B) Schematic view of worktable in automatic pipetting station.
3.2.2 Procedure control
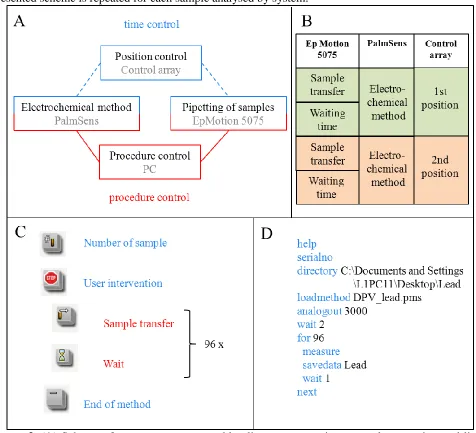
[image:6.596.57.537.128.570.2]EpBlue software can be divided into the two steps, the first is sample transfer and the second is waiting for ending electrochemical procedure, which is controlled by PSTrace software. The combination of both procedure time lines is shown in Fig. 3B, where EpMotion pipettes samples, PalmSens carries out electrochemical measurement and control box position of one electrode system on the sensor field. Presented scheme is repeated for each sample analysed by system.
Figure 3. (A) Scheme of system management, blue lines represent time control connection, red lines represent software communication. (B) Summary of running programmes during analysis and theirs time coordination. (C) Programme structure for EpMotion control. (D) Structure of PSscript (PS Trace software).
returning of robotic arm to the park position and returning of all accessories to home positions. The inner part of programme ensures repeating of procedure by determination at every position on sensor field. This part consists of two commands: sample transfer and wait. Waiting is related with time coordination, which is mentioned above.
Electrochemical determination on the individual electrode systems are controlled by two units: control box and PSTrace software. Technological detail of control box is mentioned above. The aim of this instrument is position control and timing of collection measuring data to the PalmSens potentiostat. This potentiostat is managed by PsTrace software, in which automation of electrochemical procedure is set. This setting is available due to scripting protocol. Syntax of suggested script is indicated in Fig. 3D. This script is formed by number of commands. The first part of this script is created by six commands: help - returns a list of commands supported by the script; serialno - return the serial number of the connected device; directory - set the default path used for loading method files and saving data files; loadmethod - load a PSTrace compatible methodfile; analogout - set external analog output in (mV) on miniDIN connector; wait - make the program wait for [n] seconds. The second part of script is created by command loop for replication of measurements. Command for … next repeats a set of instructions for [n] times (in our case maximum 96 according to 96 electrode systems). This loop contained three commands: measure - starts a measurement using the most recent loaded method; savedata - saves the data to a PSTrace compatible datafile; wait - make the program wait for [n] seconds.
3.3 Electrochemical determination of lead on suggested system
It was necessary to test functionality of suggested automatic system. For this purpose, the optimization of electrochemical determination of lead(II) was performed primarily. In the next step we focused our attention on statistical and analytical evaluation of the measurements.
3.3.1 Optimization of electrochemical determination
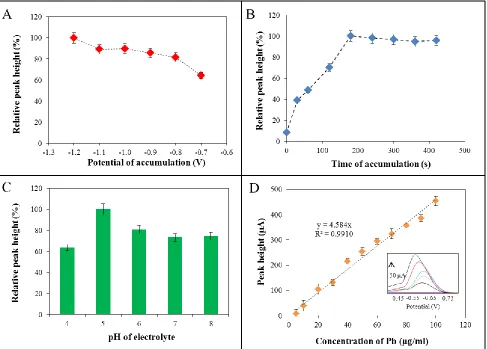
Figure 4. (A) Dependence of relative peak height of lead(II) ions on potential of accumulation. (B) Dependence of relative peak height of lead(II) ions on time of accumulation. (C) Influence of electrolyte pH on relative peak height of lead(II) ions. (D) Calibration curve of lead(II) measured under the optimal parameters (accumulation potential -1.2 V, time of accumulation 180 s, 0.2 M acetate buffer pH 5); in inset: differential pulse voltammograms of lead(II) ions.
Table 1. Analytical parameters of electrochemical determination of lead(II) ions.
Substance Regression
equation
Linear dynamic range (µM)
Linear dynamic
range (µg/ml) R21
LOD2
(µM)
LOD (µg/ml)
LOQ3
(µM)
LOQ (µg/ml)
RSD4 (%)
Pb y = 4.584x 24.13 – 483 5 – 100 0.9910 4.256 0.882 14.194 2.941 15.44
1 regression coefficients
2 limits of detection of detector (3 S/N)
3 limits of quantification of detector (10 S/N)
4 relative standard deviations
3.3.2 Statistical evaluation of the array
[image:9.596.49.548.532.577.2]Fig. 5A). For one column, the obtained statistical parameters were as follows: average was 100%, median 101.74%, standard deviation 6.71% and dispersion 9.64% (last both values were related to average, Fig. 5B). The differences between obtained statistical values for the line and column are not greater than 2 %. From this point of view it can be said that no greater differences exist between determination in the line and column.
Figure 5. (A) Repeatability of one sample measurement (measured in one line). Dependence of relative peak height of lead(II) on number of samples. Concentration of lead(II) standard was 50 μg/ml. (B) Repeatability of one sample measurement (measured in one column). Dependence of relative peak height of lead(II) on number of samples. Concentration of lead(II) standard was 50 μg/ml.
3.4 Determination of lead in rainwaters
[image:10.596.65.518.150.589.2]of metals in environment represents anthropogenic activity (mining and processing of ore, chemical industry etc.). Metals represent significant issue, especially because of their toxicity, which may cause acute as well as chronic intoxication. Due to these facts, improving of methods of their detection and quantification in situ is needed.
3.4.1 Atomic absorption spectrometry
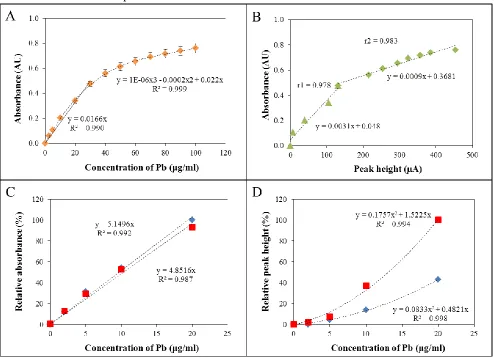
[image:11.596.48.550.460.503.2]Comparison of measured results obtained from sensor array with atomic absorption spectrometry was necessary for confirmation of designed system functionality. Atomic absorption spectrometry (AAS) can be considered as a golden standard for metal determination [77-79]. Calibration curve of lead measured by AAS within the concentration range from 0 to 100 µg/ml is shown in Fig. 6A. The curve was linear with the following parameters y = 0.0166x; n = 4; R2 = 0.990 within concentration range from 0 to 30 µg/ml. Limit of detection (3 S/N) was estimated as 0.2 µg/ml. Other analytical parameters are indicated in Table 2. Limit of detection estimated by AAS is five times lower in comparison to the sensor array. In the whole concentration range the curve parameters had the following parameters: y = y = 1.10-6x3 - 0.0002x2 + 0.022x; n = 4; R2 = 0.999. Further, we correlated sensor array with AAS measurements. Obtained dependence is shown in Fig. 6B. It follows that there were two correlation dependences, the first within concentration range from 0 to 30 µg/ml and the second within the range from 30 to 100 µg/ml. The first correlation dependence had the following parameters: y = 0.0031x + 0.048; R2 = 0.978 and the second: y = 0.0009x + 0.3681; R2 = 0.983. It is obvious that both correlation coefficients are similar to each other with average value 0.9805.
Table 2. Analytical parameters of AAS determination of lead(II) ions.
Substance Regression
equation
Linear dynamic range (µM)
Linear dynamic
range (µg/ml) R21
LOD2 (µM) LOD (µg/ml) LOQ3 (µM) LOQ (µg/ml) RSD4 (%)
Pb y = 0.0166x 0 – 145 0 – 30 0.990 1.009 0.209 3.359 0.696 2.21
1 regression coefficients
2 limits of detection of detector (3 S/N)
3 limits of quantification of detector (10 S/N)
4 relative standard deviations
3.4.2 Lead determination – solvent influence
It clearly follows from the results obtained that the influence of matrix for AAS determination is minimal such as difference between directions of both linear dependences. On the other hand the influence of matrix is greater on the electrochemical determination. Nevertheless, re-calculating of the results on the measured dependence can be done.
Figure 6. (A) Calibration curve of lead(II) measured by 240 FS AA Agilent Technologies atomic absorption spectrometer. (B) Correlation of spectrometric (AAS) and electrochemical determination of lead(II). First part represent correlation within the concentration range from 0 to 30 μg/ml and second part represent correlation within the concentration range from 30 to 100 μg/ml. The influence of solvent (water, ■ acetate buffer pH 5) on lead(II) determination in rain water matrix (C) by atomic absorption spectrometry and (D) by differential pulse voltammetry.
3.4.3 Lead determination – rainwater monitoring
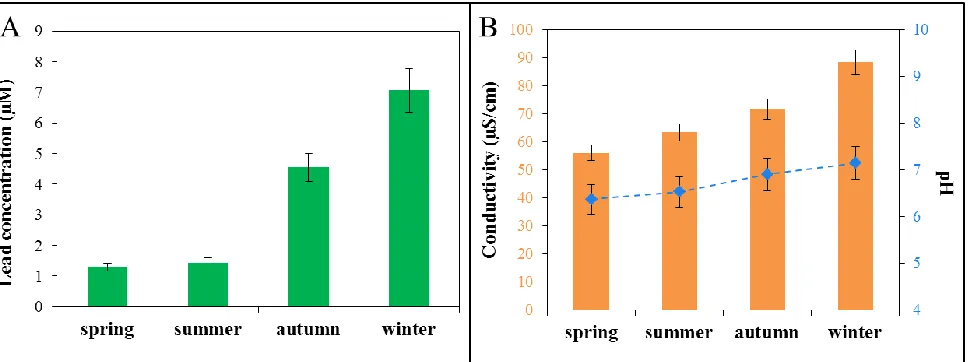
[image:12.596.54.548.137.495.2]Figure 7. One year experiment with collection of rainwater samples from weather station Bořitov. Samples were collected every week per one year period. (A) Measured lead concentrations in rainwater samples as an average value per one season. (B) pH and conductivity of rainwater samples as average value per one season.
4. CONCLUSIONS
Miniaturization of analytical and bioanalytical instruments is the basic aim of instrument development at these days. Determination of specific and group of compounds, species, cells, even organisms and other targets is the point of view of this development. Developing and suggesting of simple analytical instruments, methods and procedures with low detection limits and providing on-line and in situ monitoring of environment are needed. Obviously environment and biological monitoring is connected with determination of large number of samples. In this study, we show testing and optimizing of new sensor array connected with pipetting robot (samples dosing and manipulation) for electrochemical determination of a large number of samples. Finally, there was also confirmed, that these three-electrode screen-printed planar electrodes system could be used for fully automated electrochemical detection of selected species.
ACKNOWLEDGEMENTS
Financial support from CEITEC CZ.1.05/1.1.00/02.0068, NanoBioMetalNet CZ.1.07/2.4.00/31.0023 and Lead and Cadmium Initiatives, United Nation Environment Program is highly acknowledged.
References
1. D. Huska, O. Zitka, O. Krystofova, V. Adam, P. Babula, J. Zehnalek, K. Bartusek, M. Beklova, L. Havel and R. Kizek, Int. J. Electrochem. Sci., 5 (2010) 1535.
2. D. Huska, V. Adam, P. Babula, L. Trnkova, J. Hubalek, J. Zehnalek, L. Havel and R. Kizek, Microchim. Acta, 173 (2011) 189.
3. J. Prasek, M. Adamek, J. Hubalek, V. Adam, L. Trnkova and R. Kizek, Sensors, 6 (2006) 1498. 4. V. Supalkova, M. Beklova, J. Baloun, C. Singer, B. Sures, V. Adam, D. Huska, J. Pikula, L.
Rauscherova, L. Havel, J. Zehnalek and R. Kizek, Bioelectrochemistry, 72 (2008) 59.
[image:13.596.60.544.71.252.2]6. O. Zitka, D. Huska, V. Adam, A. Horna, M. Beklova, Z. Svobodova and R. Kizek, Int. J. Electrochem. Sci., 5 (2010) 1082.
7. V. Adam, I. Fabrik, V. Kohoutkova, P. Babula, J. Hubalek, R. Vrba, L. Trnkova and R. Kizek, Int. J. Electrochem. Sci., 5 (2010) 429.
8. J. Vitecek, J. Petrlova, J. Petrek, V. Adam, D. Potesil, L. Havel, R. Mikelova, L. Trnkova and R. Kizek, Electrochim. Acta, 51 (2006) 5087.
9. D. Potesil, J. Petrlova, V. Adam, J. Vacek, B. Klejdus, J. Zehnalek, L. Trnkova, L. Havel and R. Kizek, J. Chromatogr. A, 1084 (2005) 134.
10. O. Zitka, H. Skutkova, O. Krystofova, P. Sobrova, V. Adam, J. Zehnalek, L. Havel, M. Beklova, J. Hubalek, I. Provaznik and R. Kizek, Int. J. Electrochem. Sci., 6 (2011) 1367.
11. E. Palecek and V. Ostatna, Electroanalysis, 19 (2007) 2383.
12. V. Adam, J. Baloun, I. Fabrik, L. Trnkova and R. Kizek, Sensors, 8 (2008) 2293.
13. J. Petrlova, D. Potesil, R. Mikelova, O. Blastik, V. Adam, L. Trnkova, F. Jelen, R. Prusa, J. Kukacka and R. Kizek, Electrochim. Acta, 51 (2006) 5112.
14. V. Adam, J. Petrlova, J. Wang, T. Eckschlager, L. Trnkova and R. Kizek, PLoS ONE, 5 (2010) e11441.
15. V. Adam, O. Zitka, P. Dolezal, L. Zeman, A. Horna, J. Hubalek, J. Sileny, S. Krizkova, L. Trnkova and R. Kizek, Sensors, 8 (2008) 464.
16. I. Fabrik, S. Krizkova, D. Huska, V. Adam, J. Hubalek, L. Trnkova, T. Eckschlager, J. Kukacka, R. Prusa and R. Kizek, Electroanalysis, 20 (2008) 1521.
17. J. Hubalek, J. Hradecky, V. Adam, O. Krystofova, D. Huska, M. Masarik, L. Trnkova, A. Horna, K. Klosova, M. Adamek, J. Zehnalek and R. Kizek, Sensors, 7 (2007) 1238.
18. D. Huska, V. Adam, O. Zitka, J. Kukacka, R. Prusa and R. Kizek, Electroanalysis, 21 (2009) 536. 19. R. Kizek, L. Trnkova and E. Palecek, Anal. Chem., 73 (2001) 4801.
20. D. Potesil, R. Mikelova, V. Adam, R. Kizek and R. Prusa, Protein J., 25 (2006) 23.
21. M. Strouhal, R. Kizek, J. Vacek, L. Trnkova and M. Nemec, Bioelectrochemistry, 60 (2003) 29. 22. L. Trnkova, R. Kizek and J. Vacek, Bioelectrochemistry, 56 (2002) 57.
23. O. Zitka, A. Horna, K. Stejskal, J. Zehnalek, V. Adam, L. Havel, L. Zeman and R. Kizek, Acta Chim. Slov., 54 (2007) 68.
24. O. Zitka, O. Krystofova, P. Sobrova, V. Adam, J. Zehnalek, M. Beklova and R. Kizek, J. Hazard. Mater., 192 (2011) 794.
25. D. Huska, V. Adam, S. Krizkova, J. Hrabeta, T. Eckschlager, M. Stiborova and R. Kizek, Chim. Oggi-Chem. Today, 28 (2010) 15.
26. D. Huska, V. Adam, J. Hubalek, L. Trnkova, T. Eckschlager, M. Stiborova, I. Provaznik and R. Kizek, Chim. Oggi-Chem. Today, 28 (2010) 18.
27. D. Huska, V. Adam, L. Trnkova and R. Kizek, J. Magn. Magn. Mater., 321 (2009) 1474.
28. D. Huska, J. Hubalek, V. Adam, D. Vajtr, A. Horna, L. Trnkova, L. Havel and R. Kizek, Talanta, 79 (2009) 402.
29. V. Shestivska, V. Adam, J. Prasek, T. Macek, M. Mackova, L. Havel, V. Diopan, J. Zehnalek, J. Hubalek and R. Kizek, Int. J. Electrochem. Sci., 6 (2011) 2869.
30. O. Zitka, H. Skutkova, V. Adam, L. Trnkova, P. Babula, J. Hubalek, I. Provaznik and R. Kizek, Electroanalysis, 23 (2011) 1556.
31. M. Fojta, F. Jelen, L. Havran and E. Palecek, Curr. Anal. Chem., 4 (2008) 250. 32. E. Palecek, Electroanalysis, 8 (1996) 7.
33. E. Palecek, Talanta, 56 (2002) 809.
34. J. Wang, Anal. Chim. Acta, 469 (2002) 63. 35. J. Wang, Small, 1 (2005) 1036.
36. J. Wang, Electroanalysis, 17 (2005) 7.
38. V. Adam, S. Krizkova, O. Zitka, L. Trnkova, J. Petrlova, M. Beklova and R. Kizek, Electroanalysis, 19 (2007) 339.
39. C. Fernandez-Bobes, M. T. Fernandez-Abedul and A. Costa-Garcia, Electroanalysis, 10 (1998) 701.
40. V. Adam, J. Petrlova, D. Potesil, J. Zehnalek, B. Sures, L. Trnkova, F. Jelen and R. Kizek, Electroanalysis, 17 (2005) 1649.
41. S. Krizkova, V. Adam, J. Petrlova, O. Zitka, K. Stejskal, J. Zehnalek, B. Sures, L. Trnkova, M. Beklova and R. Kizek, Electroanalysis, 19 (2007) 331.
42. J. Petrlova, D. Potesil, J. Zehnalek, B. Sures, V. Adam, L. Trnkova and R. Kizek, Electrochim. Acta, 51 (2006) 5169.
43. I. Fabrik, J. Kukacka, J. Baloun, I. Sotornik, V. Adam, R. Prusa, D. Vajtr, P. Babula and R. Kizek, Electroanalysis, 21 (2009) 650.
44. V. Adam, J. Zehnalek, J. Petrlova, D. Potesil, B. Sures, L. Trnkova, F. Jelen, J. Vitecek and R. Kizek, Sensors, 5 (2005) 70.
45. K. B. Wu, S. S. Hu, J. J. Fei and W. Bai, Anal. Chim. Acta, 489 (2003) 215.
46. W. Yantasee, Y. H. Lin, G. E. Fryxell and B. J. Busche, Anal. Chim. Acta, 502 (2004) 207. 47. C. G. Hu, K. B. Wu, X. Dai and S. S. Hu, Talanta, 60 (2003) 17.
48. L. Fujcik, R. Prokop, J. Prasek, J. Hubalek and R. Vrba, Microelectron. Int., 27 (2010) 3.
49. J. Prasek and M. Adamek, in D. Rocha, P.M. Sarro, M.J. Vellekoop (Editors), Proceedings of the IEEE Sensors 2004, Vols 1-3, 2004, p. 749.
50. P. Fanjul-Bolado, D. Hernandez-Santos, P. J. Lamas-Ardisana, A. Martin-Pernia and A. Costa-Garcia, Electrochim. Acta, 53 (2008) 3635.
51. P. M. Ajayan and T. W. Ebbesen, Rep. Prog. Phys., 60 (1997) 1025. 52. K. Balasubramanian and M. Burghard, Small, 1 (2005) 180.
53. J. Prasek, L. Trnkova, I. Gablech, P. Businova, J. Drbohlavova, J. Chomoucka, V. Adam, R. Kizek and J. Hubalek, Int. J. Electrochem. Sci., 7 (2012) 1785.
54. L. M. May and D. A. Russell, Anal. Chim. Acta, 500 (2003) 119.
55. J. H. Pei, M. L. Tercier-Waeber and J. Buffle, Anal. Chem., 72 (2000) 161.
56. J. Prasek, J. Drbohlavova, J. Chomoucka, J. Hubalek, O. Jasek, V. Adam and R. Kizek, J. Mater. Chem., 21 (2011) 15872.
57. J. Prasek, D. Huska, O. Jasek, L. Zajickova, L. Trnkova, V. Adam, R. Kizek and J. Hubalek, Nanoscale Res. Lett., 6 (2011) 385.
58. O. Krystofova, O. Zitka, S. Krizkova, D. Hynek, V. Shestivska, V. Adam, J. Hubalek, M. Mackova, T. Macek, J. Zehnalek, P. Babula, L. Havel and R. Kizek, Int. J. Electrochem. Sci., 7 (2012) 886.
59. J. Najmanova, E. Neumannova, T. Leonhardt, O. Zitka, R. Kizek, T. Macek, M. Mackova and P. Kotrba, Ind. Crop. Prod., 36 (2012) 536.
60. O. Zitka, P. Babula, J. Sochor, M. Kummerova, O. Krystofova, V. Adam, L. Havel, M. Beklova, J. Hubalek and R. Kizek, Int. J. Electrochem. Sci., 7 (2012) 908.
61. O. Zitka, M. A. Merlos, V. Adam, N. Ferrol, M. Pohanka, J. Hubalek, J. Zehnalek, L. Trnkova and R. Kizek, J. Hazard. Mater., 203 (2012) 257.
62. J. Sochor, O. Zitka, D. Hynek, E. Jilkova, L. Krejcova, L. Trnkova, V. Adam, J. Hubalek, J. Kynicky, R. Vrba and R. Kizek, Sensors, 11 (2011) 10638.
63. M. Beklova, I. Soukupova, P. Majzlik, O. Krystofova, V. Adam, J. Zehnalek, J. Kaiser and R. Kizek, Toxicol. Lett., 205 (2011) S191.
64. O. Krystofova, V. Shestivska, M. Galiova, K. Novotny, J. Kaiser, J. Zehnalek, P. Babula, R. Opatrilova, V. Adam and R. Kizek, Sensors, 9 (2009) 5040.
65. I. J. Fisher, D. J. Pain and V. G. Thomas, Biol. Conserv., 131 (2006) 421.
67. J. A. Lewis and S. M. Cohen, Inorg. Chem., 43 (2004) 6534.
68. A. Blazovics, M. Abaza, P. Sipos, K. Szentmihalyi, E. Feher and M. Szilagyi, Trace Elem. Electrolytes, 19 (2002) 42.
69. W. T. Kwong, P. Friello and R. D. Semba, Sci. Total Environ., 330 (2004) 21.
70. M. Soylak, I. Narin, U. Divrikli, S. Saracoglu, L. Elci and M. Dogan, Anal. Lett., 37 (2004) 767. 71. G. L. Long and J. D. Winefordner, Anal. Chem., 55 (1983) A712.
72. M. Pohanka, J. Sochor, B. Ruttkay-Nedecky, N. Cernei, V. Adam, J. Hubalek, M. Stiborova, T. Eckschlager and R. Kizek, J. Appl. Biomed., 10 (2012) 155.
73. D. Hynek, L. Krejcova, J. Sochor, N. Cernei, J. Kynicky, V. Adam, L. Trnkova, J. Hubalek, R. Vrba and R. Kizek, Int. J. Electrochem. Sci., 7 (2012) 1802.
74. M. Masarik, D. Huska, V. Adam, J. Hubalek, I. Provaznik, L. Trnkova and R. Kizek, Int. J. Mol. Med., 26 (2010) S46.
75. J. Baloun, V. Adam, L. Trnkova, M. Beklova, Z. Svobodova, L. Zeman and R. Kizek, Environ. Toxicol. Chem., 29 (2010) 497.
76. J. Kovarova, O. Celechovska, R. Kizek, V. Adam, D. Harustiakova and Z. Svobodova, Neuroendocrinol. Lett., 30 (2009) 169.
77. M. A. Janusa and J. N. Beck, Appl. Spectrosc. Rev., 37 (2002) 137. 78. S. M. Talebi and H. Safigholi, J. Serb. Chem. Soc., 72 (2007) 585.
79. Z. M. Ni, X. Q. Shan, L. Z. Jin, S. Luan, L. Zhang and K. S. Subramanian, ACS Symposium Series, 445 (1991) 206.