Int. J. Electrochem. Sci., 8 (2013) 1920 - 1927
International Journal of
ELECTROCHEMICAL
SCIENCE
www.electrochemsci.org
Selective Determination of Dopamine and Uric Acid at Poly(acid
red 176) Modified Glassy Carbon Electrode in the Presence of
Ascorbic Acid
Xiao-bo Li, Guang-ri Xu*, Rui-yuan Hu
Department of Chemistry and Chemical Engineering, Henan Institute of Science and Technology, Xinxiang 453003, China
*
E-mail: [email protected].
Received: 29 November 2012 / Accepted: 5 January 2013 / Published: 1 February 2013
A polymerized film of acid red 176 was prepared on glassy carbon electrode (GCE) in neutral buffer solution by cyclic voltammetry (CV). The poly(acid red 176) film-coated GCE (PARGCE) exhibited excellent electrocatalytic activity towards the oxidation of dopamine (DA) and uric acid (UA) in the presence of ascorbic acid (AA). The electrochemical oxidation signals of DA, UA, and AA were well resolved into three distinct peaks with peak potential separations of 180, 176 and 356 mV between AA-DA, DA-UA, and AA-UA in differential pulse voltammograms (DPVs), respectively. A linear range of 1 to 70 μM and a detection limit of 4.9×10⁻⁷
M were observed in pH 6.47 phosphate buffer solutions (PBS). Moreover, PARGCE efficiently eliminated the interference of a high concentration of AA in the determination of DA and UA with high sensitivity, selectivity, and good reproducibility. The modified electrode was also successfully applied for the determination of DA in human urine samples with satisfactory results. The proposed method provides a significant method for selective detection of DA from the interferences by AA and UA.
Keywords: glassy carbon electrode, acid red 176, dopamine, uric acid, ascorbic acid
1. INTRODUCTION
interference in the determination of one in the presence of the other two [6]. Therefore, it is important to develop sensitive and selective methods for the detection of DA in the presence of UA and AA. In the past decades, various chemically modified electrodes have been used to overcome the problems. Among these methods, polymer modified electrodes have many advantages in the detection of biomolecules because of their selectivity, sensitivity and homogeneity in electrochemical deposition, strong adherence to the electrode surface, and chemical stability of the film [7, 8]. Loads of concentrations have been given to fabricate polymers by employing various materials such as 3,4-ethylene-dioxythiophene [9], evans blue [10,11], 5-amino-1,3,4-thiadiazole-2-thiol [12], acid chrome blue K [13], 3,3’-bis[N,N-bis(carboxymethyl)aminomethyl]-o-cresolsulfonephthalein [14], p-xylenolsulfonephthalein [15], and tiron [16] as an electropolymerized layer to modify GC electrode for the detection of DA.
In the present work, we electrodeposited acid red 176 on GCE in neutral solution to enhance the sensitivity toward the oxidation of DA and explored the properties of PARGCE for the detection of DA and UA in the presence of AA.
2. EXPERIMENTAL 2.1. Reagents
Acid red 176, dopamine, uric acid, ascorbic acid, NaH2PO4 and Na2HPO4 were purchased from Sigma-Aldrich. All reagents were of analytical reagent grade and used as received unless otherwise noted. Phosphate buffer solutions were prepared from stock solutions of 0.1 M NaH2PO4 and 0.1 M Na2HPO4. Distilled water (Zhengzhou Xuefeng Water Treatment Company, China) was used for preparation of all solutions. All experiments were performed at room temperature.
2.2. Apparatus
Electrochemical experiments were performed with a CHI760C electrochemical workstation (Chenhua Instruments, China). A conventional three-electrode system was used where glassy carbon electrode (GCE, 3 mm diameter) or the modified GCE, a platinum wire, and a Ag/AgCl (3 M KCl) electrode were used as working, counter, and reference electrodes, respectively. All potentials in this study referred to this reference electrode. DPVs were obtained by scanning the potential from −0.2 to 0.4 V with the following pulse amplitude: 100 mVs-1, pulse width: 2 ms, and pulse period: 1000 ms. All electrochemical experiments were performed in 0.1 M PBS unless otherwise noted.
2.3. Electrode preparation
between −0.4 and +1.0 V in a phosphate buffer solution (pH 7.0) containing 1 mM acid red 176 and finally a red-blue colored uniform PAR film was formed on the GCE surface. Then, the poly(acid red 176) modified GCE (PARGCE) was thoroughly washed with water, transferred to 0.1 M PBS (pH 7.0), and scanned until a stable voltammogram appeared, with the purpose to remove the unreacted monomer.
3. RESULTS AND DISCUSSIONS 3.1 Effect of pH on the oxidation of DA
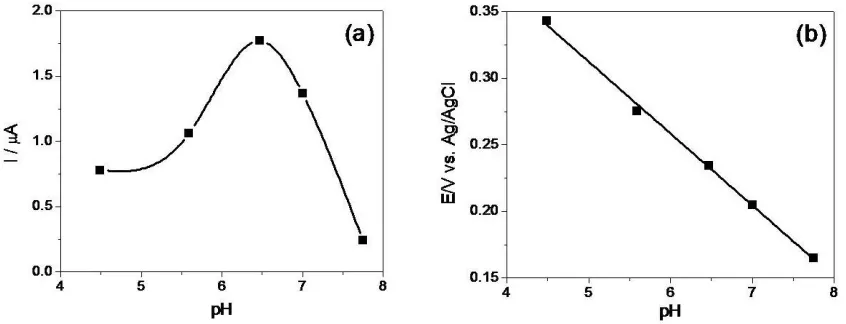
Effect of pH on peak current and potential for the oxidation of DA at PARGCE is displayed in Figure 1. The oxidation peak current of DA increased first with the increase of pH and reached the maximum at pH 6.47 then declined. Besides, with the pH value increasing, the oxidation shifted negatively. According to the Nernst equation, the slope of −55.4 mV pH−1 (Fig.1(b)) reveals that the same number of the electron and proton involved in the reaction [17]. As DA oxidation is a two-electron process, the number of protons involved is also predicted to be two. Therefore, a mechanism for the DA oxidation can be proposed similarly as described elsewhere [18, 19, 20].
Figure 1. Effect of pH on peak current (a) and peak potential (b) for the oxidation of 50 μM DA at PARGCE.
3.2 Effect of scan rate on the peak current of DA
[image:3.596.85.508.408.570.2]
Figure 2. Cyclic voltammograms of 50 μM DA at PARGCE in pH=6.47 PBS. Curves (a) to (j) correspond to 20, 40, 60, 80, 100, 120, 140, 160, 180 and 200 mVs-1, respectively. Inset: plot of peak current vs. square root of scan rates.
3.4 Electrochemical response to DA, UA, and AA at PARGCE
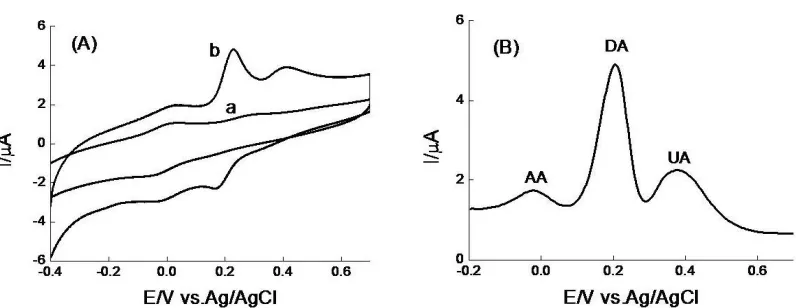
AA, DA and UA coexist in extra cellular fluid of the central nervous system and serum. In order to establish a sensitive and selective method for the quantification of AA, DA and UA, the ability of the modified electrode to promote the voltammetric resolution of AA, DA and UA was investigated. The cyclic voltammetric response to a mixture of 1 mM AA, 10 μM DA and 20 μM UA at bare GCE and PARGCE in pH 6.47 PBS are shown in Fig.3(A).
Figure 3. CVs (A) and DPVs (B) of 1 mM AA, 40 μM DA and 100 μM UA at (a) bare GCE and (b) PARGCE in pH 6.47 PBS.
[image:4.596.184.416.80.277.2] [image:4.596.98.496.516.670.2]
AA, 10 μM DA, and 20 μM UA at bare GCE and PARGCE in pH 6.47 PBS are shown in Fig.3(B). Similarly, the indistinguishable peak potentials of AA, DA, and UA did not appear when DA was oxidized on the modified GCE. Three peaks can be defined well into on the PARGCE at potentials around 24, 204, and 380 mV for AA, DA, and UA, respectively. These separations, 180, 176, and 356 mV between AA and DA, DA and UA, and AA and UA, are large enough to achieve the simultaneous detection of these three compounds in a homogeneous solution. Furthermore, at PARGCE, as high as 1 mM AA did not give high signal compared to low concentration of DA, indicating that the PARGCE may be successfully used for quantitative determination of DA in the presence of excess amount of AA.
3.5 Determination of DA
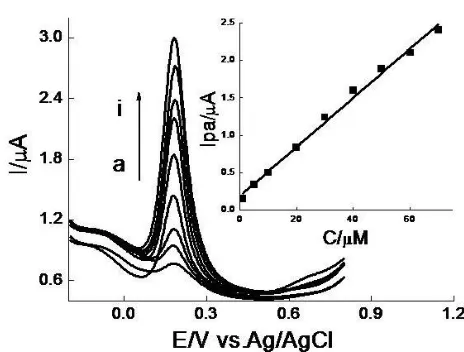
Since DPV has a much higher current sensitivity and better resolution than CV, it was used in the determination of DA concentrations at PARGCE and the estimation of the lower limit of detection. The Ipa of DA was measured in pH 6.47 PBS, and plotted against the bulk concentrations of DA after background subtractions of DA was in a good linear relationship in the range of 1-70 μM. The linear regression equation was expressed as Ipa(μA)=0.03283C(μM) +0.1828, r=0.9932 (inset of Fig.4). The detection limit(S/N=3) was 4.9×10⁻⁷
M.
Figure 4. DPVs of DA at modified electrode in pH 6.47 PBS. DA concentration (μM): (a) 1; (b) 5; (c) 10; (d) 20; (e) 30; (f) 40; (g) 50; (h) 60; (i) 70. (Inset) Plots of Ipa vs.C.
3.6 Detection of DA in the presence of AA and UA
[image:5.596.179.411.409.585.2]
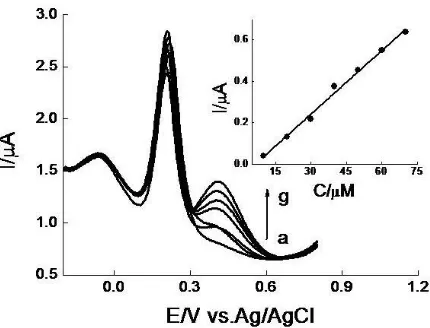
linearship with the concentration of DA. The linear regression equation was expressed as Ipa(μA)=0.03473C(μM)+0.621, r2=0.9800 (inset of Fig.5). The detection limit (S/N=3) of 4.96×10⁻⁷
M was obtained. We also carefully examined the oxidation currents of AA and DA at PARGCE in the presence of increasing concentration of UA (Fig.6). No obvious change in the AA and DA oxidation currents was observed while varying the concentration of UA, and the peak current of UA increased linearly with increasing UA concentration with a correlation coefficient of 0.9923(inset of Fig.6). It is very interesting to note that the oxidation processes of AA, DA and UA at PARGCE are independent and simultaneously without interference from each other.
Figure 5. DPVs at PARGCE in pH 6.47 PBS containing 1 mM AA and 40 μM UA in the presence of different concentrations of DA. DA concentrations (μM): (a) 5; (b) 15; (c) 25; (d) 35; (e) 45; (f) 55. (Inset) Plots of Ipa vs.C.
[image:6.596.185.409.232.403.2] [image:6.596.193.408.487.651.2]
3.7 Stability and reproducibility
The PARGCE could be stored stably for 2 weeks in 0.1 M PBS (pH 6.47) at 4 oC in a refrigerator after finishing above experiment. The DPVs for different concentrations of DA in the presence of 2 mM AA and 60 μM UA in 0.1 M PBS were recorded. It was found that there was no AA signal appearing and DA anodic peak currents retained linearship to the concentration of DA in the rage 1 to 70 μM with nearly constant peak current of UA. However, the current responses decreased about average 8% of its previous responses recorded in Fig.4 after three weeks storage. Further, the redox reaction of 50 μM DA was repeated 35 cycles by applying cyclic voltammetry at PARGCE. We obtained the standard deviations of 2.12% for the oxidations of DA. The above results displayed acceptable reproducibility and stability for the present PARGCE.
3.8 Real samples analysis
Most of the previously modified electrodes were reported on the detection of DA in dopamine hydrochloride injection [21, 22]. However, it is significative of applying modified electrode for the determination of DA in real sample [6, 19] such as human urine [9, 23]. A feasibility study of the application of the proposed PARGCE as the electrochemical sensor to determine DA in human urine was performed by DPV also. In this method, known amounts of analytes were added to pH 6.47 PBS containing deliberate amounts of fresh urine sample which was kindly denoted by one of my lab members. The R.S.D of each sample for three times parallel detections was less than 3.17%. In addition, the recovery ratios on the basis of this method were investigated and the values were between 96 and 99% (Table 1). The recovery ratios show that the determination of DA by using the present electrode is effective, accurate and very reproducible. In light of these results, the prepared electrode was very reliable and sensitive and can readily be applied to determine DA in real samples.
Table 1. Determination of DA in human urine samples
Samples Spiked (μM) Found (μM) R.S.D. (%) Recovery (%)
1 5 4.95 2.77 99
2 10 9.8 2.84 98
3 15 14.4 3.17 96
4. CONCLUSION
A highly sensitive poly(acid red 176) film-coated GCE was fabricated for the selective and quantitative detection of DA in the presence of UA and high concentration of AA. Moreover, excellent catalytic activity and reversibility for the electrochemical redox reaction of DA was achieved and the detection limit of 4.9×10⁻⁷
is simply and easily fabricated and it shows good sensitivity, selectivity and stability for the selective detection of DA.
References
1. R. M. Wightman, L. J. May and A. C. Michael, Anal. Chem. 60(1988)769. 2. B. J. Venton and R. M. Wightman, Anal. Chem. 75(2003)414.
3. G. Jin, X. Lin and J. Gong, J. Electroanal. Chem. 569(2004)135. 4. L. Zhangand X. Lin, Anal. Bioanal. Chem. 382(2005)1669.
5. D. L. Robinson, B. J. Venton and M. L. A. V. Heien, Clin. Chem. 49(2003)1763. 6. A. I. Gopalan, K. P. Lee and K. M. Manesh, Talanta. 71(2007)1774.
7. N. B. Li, W. Ren and H. Q. Luo, J Solid State Electrochem. 12(2008)693.
8. H. R. Zare, N. Rajabzadeh and N. Nasirizadeh, J. Electroanal. Chem. 589(2006)60. 9. N. F. Atta, A. Galal and R. A. Ahmed, Bioelectrochemistry. 80(2011)132.
10. L. Q. Lin, H. Yao and L. Y. Huang, J. Anal. Chem. 64(2009)189. 11. L. Q. Lin, J. H. Chen and H. Yao, Bioelectrochemistry 73(2008)11. 12. P. Kalimuthu and S. A. John, Anal. Chim. Acta 647(2009)97. 13. R. Zhang, G. D. Jinand D. Chen, Sens. Actuat. B 138(2009)174.
14. A. A. Ensafi, B. Rezaei and S. Z. M. Zare, Sens. Actuat. B 150(2010)321. 15. A. A. Ensafi, M. Taei and T. Khayamian, Colloids Surf. B 79(2010)480. 16. A. A. Ensafi, M. Taei and T. Khayamian, Int. J. Electrochem. Sci. 5(2010)116.
17. S. J. Dong, L. G. Che and Y. W. Xie, Chemical Modified Electrode, Beijing: Science, 2003. 18. H. Yao, Y. Sun and X. Lin, Electrochim. Acta 52(2007)6165.
19. M. Behpour, S. M. Ghoreishi and E. Honarmand, J. Electroanal. Chem. 653(2011)75. 20. M. H. Pournaghi-Azar, H. Dastangoo and R. F. B. Baj, Biosens. Bioelectron.25(2010)1481. 21. T. Liu, M. Li and Q. Li, Talanta 63(2004)1053.
22. T. Luczak, Electrochim. Acta 53(2008)5725.
23. A. A. Ensafi, M. Taei and T. Khayamian, Sens. Actuat. B 147(2010)213. 24. X. G. Liu, Y. H. Peng and X. J. Qu, J. Electroanal. Chem. 654(2011)72. 25. X. Zhou, N. Zheng and S. R. Hou, J. Electroanal. Chem. 642(2010)30. 26. N. F. Atta, , and M. F. El-Kady, Sens. Actuat. B 145(2010)299.