Int. J. Electrochem. Sci., 8 (2013) 10932 - 10945
International Journal of
ELECTROCHEMICAL
SCIENCE
www.electrochemsci.orgPotential of UV-Curable Poly(Glycidyl Methacrylate-co-Ethyl
Methacrylate)-
Based
Solid Polymer Electrolyte For Lithium
Ion Battery Application
M. Imperiyka1, A. Ahmad1,2,*, S. A. Hanifah1, 2, M.Y.A. Rahman3,* 1
School of Chemical Sciences and Food Technology, Faculty of Science and Technology, 2
Polymer Research Center, Faculty of Science and Technology, Universiti Kebangsaan Malaysia, 43600, Bangi, Selangor Malaysia,
3
Institute of Microengineering and Nanoelectronics (IMEN), Universiti Kebangsaan Malaysia, 43600,
Bangi, Selangor, Malaysia *
E-mail: [email protected]
Received: 5 March 2013 / Accepted: 16 April 2013 / Published: 20 August 2013
Lithium ion conducting solid polymer electrolytes (SPE) based on P(GMA-co-EMA)(80/20) doped LiClO4 as charge carrier was prepared by solution casting method. P(GMA-co-EMA) has been synthesized by photopolymerisation technique. Interactions between the polymer and salt were studied using fourier transforms infrared (FTIR). Ionic conductivity, electrochemical stability window, thermal and crystallinity behavior of polymer complexes were studied by AC impedance, cyclic voltammetry, and x-ray diffraction (XRD), respectively. Based on FTIR result, it was observed that the Li+ ions interacted with carbonyl group, the ether group and the epoxy oxygen of the GMA and EMA. The highest ionic conductivity of the electrolyte obtained at 2.8×10⁻⁵ S cm−1 at 25°C and 1.75×10⁻⁴ S cm−1 at 100 °C. These solid polymer electrolytes showed electrochemical stability window up to 3.8V. Furthermore, the thermal stability of the electrolyte increases with an increase in the salt content. These conductivity results were supported by XRD analysis which depicted that the semi-crystalline nature of P(GMA-co-EMA) was reduced to amorphous state due to an increase of LiClO4 content. The above results indicate that this material, namely PGMA- has potential for lithium ion application
Keywords: Photopolymerization, Conductivity, Solid polymer electrolyte.
1. INTRODUCTION
of polymer electrolytes system, solid polymer electrolytes (SPEs) have many advantages such as high ionic conductivity, high-energy density, leak proof, better safety, easy processability, light weight, high in mechanical strength, thermal stability and wide electrochemical stability [2, 3]. Basically, solid polymer electrolytes are formed by dissolving salt in macromolecules and is used as both electrolyte and separator between the electrodes [4]. Earlier studies of poly (ethylene oxide) (PEO)-based electrolytes exhibits very low ionic conductivity of 10−7 S cm−1 mainly because of high crystallinity and poor motion performance of the PEO backbones. However, attempts to improve the low ionic conductivity and decrease the crystallinity of the materials includes the use of blends and copolymers of the PEO with other polymers [5]. Organic methacrylate -based polymers are potential materials because of their low toxicity in both monomers and polymer form. The functional group of polymer can interact with ion species and this forms a coordinated bond. The flexibility of local polymer chains promotes ion mobility and hence contributes to conductivity [6].
Poly(methyl methacrylate) was first used in electrochemistry by Iijima et al.[7]. Nowadays, many electrolytes are prepared using methacrylate polymers such as methyl methacrylate (MMA) [8], ethyl methacrylate (EMA) [9] and butyl methacrylate (BMA) [10]. PMMA is frequently used in Li battery because of its compatible nature with other polymers, high chemical resistance, non-tracking characteristics, surface resistance, optical properties and electrical properties [11]. Despite this, PMMA-based electrolytes exhibit lower mechanical strength. The mechanical stability of PEMA in methacrylate family is found to be higher [12]. The initial researches on poly (ethyl methacrylate) based polymer electrolytes was reported by Fhamy et al. [13] and Han et al. [14]. To compare with other methacrylate compounds poly (glycidyl methacrylate) was used because it offers good thermal properties and forms film easily compared to polymers obtained from methacrylate compounds. Besides that, it can effectively coordinate with cations to form homogenous solutions [5]. Photopolymerization is one of the simple polymerization techniques that is used to prepare polymer with high molecular weight. The advantages of this preparation technique are faster curing process, reduced energy consumption and easy processing [15]. Kaya et al. research involved a detailed study of thermodynamic properties and characterization of poly (glycidyl methacrylate-co-ethyl methacrylate) obtained by -azobisisobutyronitrile (AIBN) [16]. Moreover, Nasirtabrizi et al.[17] reported that free radical polymerization of glycidyl methacrylate and ethyl methacrylate is initiated by (AIBN). However, to the best of our knowledge, copolymer of glycidyl methacrylate and ethyl methacrylate as polymer host for solid polymer electrolyte havenot been reported.
mainlybecause of its low lattice energy. Moreover, it can behave as a lewis acid [25]. Thereby, it can interact with electron donor and enhance the ionic conductivity. Jingyu et al. found that lithium ion battery using PEO- SBA-15 (mesoporous silica) with LiClO4 gives excellent performance such as high mechanical stability, good compatibility with lithium metal electrode, and broad electrochemical stability window [26].
In this research, poly (glycidyl methacrylate-co-ethyl methacrylate)- with a ratio of 80:20 was doped with different percentages of lithium perchlorate (LiClO4). Fourier transforms infrared (FTIR), AC impedance spectroscopy (IS), cyclic voltammetry, and x-ray diffraction (XRD) were studied in this system.
2. MATERIALS AND METHODS
2.1. Materials
Glycidyl methacrylate (GMA), ethyl methacrylate (EMA), 2, dimethoxy- 2-phenylacetophenone (DMPP), lithium perchlorate (LiClO4) and methanol were purchased from Aldrich. Tetrahydrofuran (THF) was supplied from J. T. Baker. All materials were used without further purification.
2.2. Preparation of P(GMA-co-EMA)
The copolymer of P(GMA-co-EMA) (80/20) was synthesized by photopolymerization comprising of 80 wt.% GMA and 20 wt. % EMA. Appropriate amounts of 2, 2dimethoxy2 -phenylacetophenone (DMPP) is used as photo-initiator. The mixture was exposed to UV radiation under continuous flow of nitrogen gas for 5 minutes [27]. 2, 2-dimethoxy-2-phenylacetophenone (DMPP) photoinitiator decomposes to free benzoyl and methyl radical under UV radiation and propagates into bimolecular on addition of monomers [28]. The synthesis of P(GMA-co-EMA) is as illustrated in Fig. 1.
2.3 Preparation of solid polymer electrolyte
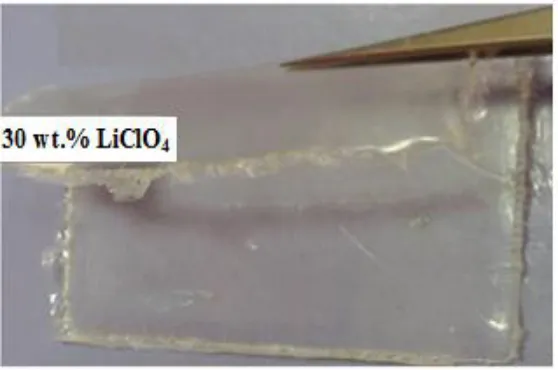
Solid polymer electrolyte samples comprising different amounts of lithium salts were prepared by solution casting method. Tetrahydrofuran (THF) was used as a solvent. The mixture of copolymer, lithium salt and solvent were mixed and stirred for 24 hrs until a homogeneous solution was obtained. Then, the solution was poured into a Teflon and left to dry at ambient temperature until electrolyte films were formed. Finally, the films were dried in a vacuum oven at 40°C for 2 hrs and kept inside a desiccator for characterization. Fig.2 illustrates the flexible and highly translucent nature of P(GMA-co-EMA) (80/20)- 30% LiClO4 and this is representative of all the electrolytes prepared.
Figure 2. Appearance of the P(GMA-co-EMA) (80/20)- 30%LiClO4 prepared by using casting solution, representative for all the SPEs.
2.3 Characterization of solid polymer electrolyte
[image:4.596.157.436.248.433.2]
configuration. cyclic voltammetry using an ZIVE MP2 multichannel electrochemical workstation. The electrochemical stability of SPEs were obtained from +5 to +5V at a scanning rate of 50 mv s-1 at room temperature. X-ray diffraction (XRD) was performed using D-5000 Siemen model to study crystallinity and structural behavior of the polymer electrolyte. The results were taken at the diffraction angle 2θ from 10◦ to 55◦ at the scanning rate of 0.025◦ s-1.
3. RESULTS AND DISCUSSION
3.2 Fourier Transforms Infrared (FTIR) spectroscopy
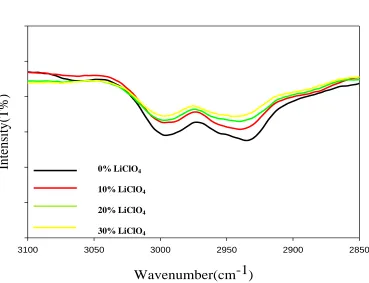
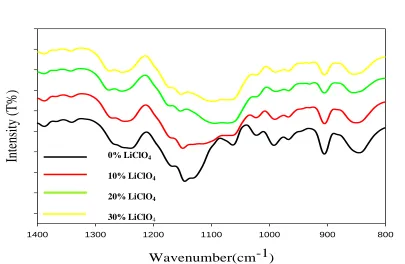
Fig. 3 (a, b, c) represents the FTIR spectra of the solid polymer electrolyte samples. In this system, more attention is paid to oxygen atoms acting as electron donor atoms in the structure of the polymer host. In polymer host, the vibrational peaks at 2993 and 2933 cm-1 corresponded to saturated aliphatic stretching C-H of the methyl and methylene group as illustrated in Figure 3(a). These peaks become broader when the concentration of salt was increased. Similar findings were reported by Frech & Huang [29] and Noor et al. [5]. The saturated polymeric ester C=O symmetrical stretching frequency (Fig. 3b) gave rise to an intense, strong and sharp peak at 1720 cm-1. With the addition of lithium salt in the system, the intensity of the v(C = O) peaks belong to the GMA and EMA were reduced. In addition, symmetric stretching of C-O-C belongs to ester and ether group observed at the band around 1238, 1254 and 1145 cm-1.
Wavenumber(cm-1)
2850 2900
2950 3000
3050 3100
In
te
n
si
ty
(T
%
)
Figure 3a. FTIR spectra for C-H of the methyl and methylene groups of P(GMA-co-EMA)(80/20)- LiClO4 (0 wt.%, 10 wt.%, 20 wt.% and 30 wt.% )
0% LiClO4
10% LiClO4
20% LiClO4
[image:5.596.108.477.453.736.2]
Wavenumber(cm-1)
1660 1680
1700 1720
1740 1760
1780 1800
In
te
ns
ity
(T
%
[image:6.596.94.506.78.333.2])
Figure 3b. FTIR spectra for C=O group of P(GMA-co-EMA) (80/20) -LiClO4 (0 wt.%, 10 wt.%, 20 wt.% and 30 wt.% )
Wavenumber(cm-1)
800 900
1000 1100
1200 1300
1400
In
te
ns
ity
(T
%
)
Figure 3c. FTIR spectra for epoxy and ether groups of P(GMA-co-EMA) (80/20) -LiClO4 (0 wt.%, 10 wt.%, 20 wt.% and 30 wt.% )
From Fig. 3 (c), the vibration frequency of polymer- salt complexes at 1238 cm−1 and 1145 cm−1 shifted and reduced when salt was introduced. This vibration frequency shifted to lower wave number by about 15–50 cm−1 compared to the polymer hosts. As can be seen from Figure 3(b) and (c),
0% LiClO4
10% LiClO4
20% LiClO4
30% LiClO4
0% LiClO4
10% LiClO4
20% LiClO4
[image:6.596.97.502.397.661.2]
the change in position and intensity of peaks confirms the interaction between the lithium ions from the doping salt and the oxygen atoms (Li+←O) in the structure of the polymer host [27, 29-34]. Furthermore, Figure 4c shows significant changes in epoxy group peak (904 and 845 cm−1) as the intensity broadens when the concentration of lithium salt was increased. The peak shifted approximately 10 cm−1 from its original position at 845 cm-1 [6, 34]. Mechanism of dissociation in lithium salt and complexation in polymer host has been suggested by Ahmad et al. [35].
LiClO4→ Li++ ClO4
-Li++ ClO4- + [-GMA-co-EMA-]n → Li+ [-GMA-co-EMA-]n- ClO4
-3.3 Ionic Conductivity
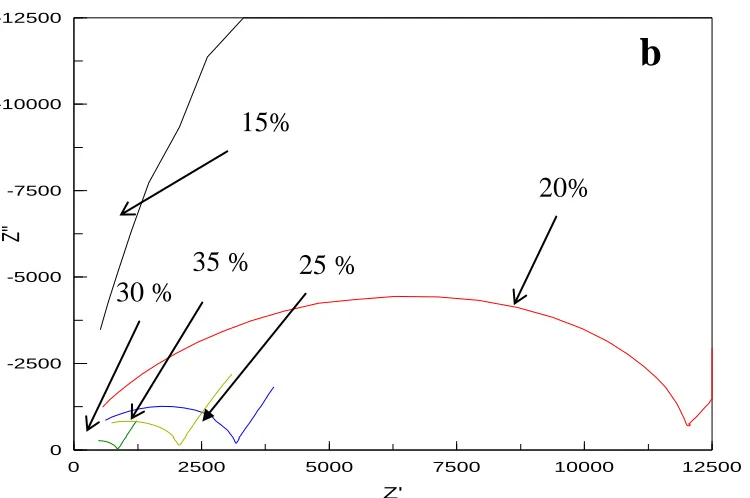
The impedance spectra for P(GMA-co-EMA) with LiClO4 are shown in Fig. 4(a,b). These graphs show that the complex impedance plots depicted two well-defined regions; an arc and a linear region. The arc is related to the conduction process and the linear region is due to the blocking electrode effect. The bulk resistance of the film was determined by extrapolation of the arc to Z-axis [35]. It was found that the semicircle depression decreases as LiClO4 content increases (Fig.4). This result is in agreement with a previous study by Baskaran et al. [36] Ramesh et al. reported that, the low resistance (R) obtained is due to the amorphous nature of the polymer electrolytes that facilitates fast Li+ ions motion in the polymer network [37].
-1e6 0 1e6 2e6 3e6 4e6
-5e6
-4e6
-3e6
-2e6
-1e6
0
Z'
Z'
'
8G-2E 5%3 LICLO4.z 8G-2E 10% 2 LICLO4.z 8g-2e 2...z
0 %
5%
10%
0 2500 5000 7500 10000 12500
-12500
-10000
-7500
-5000
-2500
0
Z'
Z'
'
9G-1E30 6%LICLO4.z 9G-1E30 7%LICLO4.z
Figure 4 (a, b). Typical Cole-Cole of (a) P (GMA-co-EMA) (80/20) - (0-10 wt. %) LiClO4 (b) P (GMA-co-EMA) (80/20) - (15-35 wt. %) LiClO4 at 25°C.
Fig.6 shows the relationship between [O/Li+] ratio and ionic conductivity. The [O/Li+] ratio for the polymer electrolyte was calculated by the following equation.
[O/Li+] = Mm x Mw salt / Msalt (80%Mw GM+20%Mw EM/nT)
Where, Mm = mass of the copolymer (g), Mw salt = the molecular weight of salt (g mol−1), Msalt = the mass of salt (g), Mw GMA, Mw EMA = the molecular weight of monomer of GMA (g mol−1) and EMA (g mol−1), respectively. nmT = ( nGMA +nEMA )the total number of oxygen atoms per repeated unit of monomer P(GMA-co-EMA).
Fig. 5 illustrates the relationship between Ionic conductivity and [O/Li] ratio. The ionic conductivity increased as the addition of salt increased to its optimum level in the polymer host. As mentioned by Rajendran et al. [38]the increase in ionic conductivity with the addition of LiClO4 was due to an increment in free ions concentration. The highest conductivity was obtained at 2.8×10⁻⁵ Scm−1 at 30 wt. % LiClO4. The maximum and an effective interaction between oxygen atoms and lithium ions [O/Li+] in the electrolyte system was in the proportion of 13/1 for oxygen atoms and lithium ions on addition of 30 wt. % LiClO4. Further increase in the ratio of LiClO4 [~11/1] caused the conductivity to decrease. The decrease in conductivity was due to the increase in the number of ion pairs, ion triplets or ion aggregations. Wu and co-worker suggested that Li+ ions can act as transient crosslinkers in which can and would reduce the overall mobility and degree of freedom. This could lead to a rapid fall in its conductivity [39]. In general, the conductivity of the single-ionic conducting polymer electrolyte is influenced by several factors including the number of charge carriers, charge migration of ions between the coordinate sites of the polymer host, the polymeric chain segmental motions and the morphological structure of polymer [40].Complex impedance plot of a P
(GMA-co-30 %
25 %
b
20%
[image:8.596.112.487.66.315.2]
EMA)-30wt. % LiClO4 in the temperature range from 30–100 °C is given in the Fig. 6. It was noted
that the increase in temperature in the polymer system has led to the reduction of bulk resistance, as shown in Fig. 6. The conductivity of the electrolyte has been increased by one order of magnitude upon heating the system.
[O/Li+]ratio
79.0/1 39.0/1 26.0/1 19.0/1 15.0/1 13.0/1 11.0/1
Sc
m
-1
)
[image:9.596.96.500.156.397.2]0 5e-6 1e-5 2e-5 2e-5 3e-5 3e-5
Figure 5. Variation of ionic conductivity with [O/Li+] of P(GMA-co-EMA) (80/20) -LiClO4
0 100 200 300 400
-400
-300
-200
-100
0
Z'
Z'
'
P8G-2E 30%LICLO4 40 Z.z P8G-2E 30%LICLO4 50 Z.z P8G-2E 30%LICLO4 60 Z.z P8G-2E 30%LICLO4 70 Z.z P8G-2E 30%LICLO4 80 Z.z P8G-2E 30%LICLO4 90 Z.z P8G-2E 30%LICLO4 100 Z.z P8G-2E 30%LICLO4 110 Z.z
Figure 6. Typical Cole-Cole of P(GMA-co-EMA)- 30 wt. % LiClO4 at different range of temperature (30-100°C).
100°C 90°C
80°C
50°C 60°C 70°C
[image:9.596.100.512.462.732.2]
It has been reported that changes in ionic conductivity with temperature can be explained by the increases of the free volume of the system and the diminution of their viscosity which facilitates the migration of ions [41, 42]. As the temperature rises, the polymer can easily expand and this increases the free volume. Thus, ions or polymer segments can move into the free volume. The resulting conductivity was presented by the overall mobility of ion and polymer that was determined by the free volume around the polymer chains [43]. Thus, the conduction in polymer electrolyte takes place through charge migration between coordinated sites of the polymer along with the segmental relaxation of polymer [44, 45].
In spite of this effect at low temperatures, the presence of lithium salt leads to salt–polymer or cation–dipole interactions which increase the cohesive energy of polymer networks. As the free volume decreases, polymer segmental motion and ionic mobility are restricted by reduction in the ionic conductivity. Bhatt and Bhat found that the crystalline part of polymer hinders the migration of Li+ ion [46].
3.4 Electrochemical Stability
E(mV)
-4000 -2000 0 2000 4000
I(mA/cm
2 )
[image:10.596.74.524.345.649.2]-1.0 -0.5 0.0 0.5 1.0
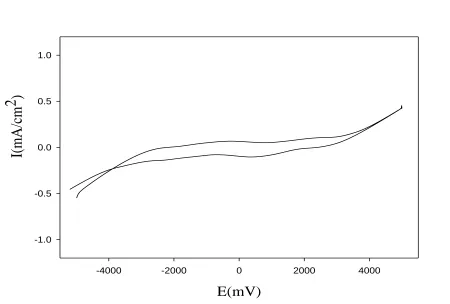
Figure 7. Cyclic voltammogram of the P(GMA-co-EMA)(80/20)- 30%LiClO4.
LiClO4 was performed. Figure 7 represents the cyclic voltammorgrams of P(GMA-co-EMA)(80/20)-30%LiClO4 complex. The cyclic voltmmetry has been performed for the SS/polymer electrolyte/SS cell couple in the potential range of ±5 V with a scan rate of 50m Vs -1
. The stability of PGMA-co-EMA(80/20)-30%LiClO4 at interface with stainless steel as electrode is limited by the potentials of +3.8V at anodic side and of -3.8V at the cathode side, which gives the window of about 7.6 V. From CV data, it was found that the cathodic and anodic peaks of the cell are not observed in this range. This related to non- interaction of lithium in the polymer electrolyte with the SS electrode [41, 47, 48]. The potential window of this resulting polymer electrolyte was sufficient to be applied in the lithium polymer battery.
3.6 X-ray diffraction XRD
The XRD analysis was investigated to study the structure and crystallization of the polymer– salt complexes by observing the appearance and disappearance of the crystalline or the amorphous region. The appearance of the amorphous region or the reduction of the crystalline region would give a high ionic conductivity in comparison to the crystalline region, as reported elsewhere [49, 50].
2theta
10 20 30 40 50
In
ten
sity
(a
.u
[image:11.596.94.510.367.696.2])
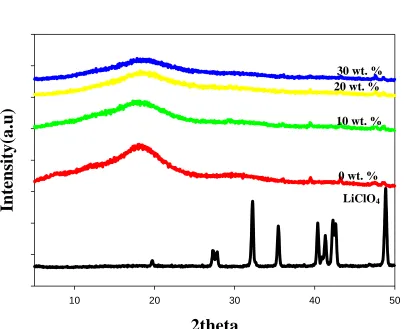
Figure 8.XRD pattern of LiClO4 (a), P(GMA-co-EMA) (80/20) (b), P(GMA-co-EMA)(80/20) -10 wt. % LiClO4 (c), P(GMA-co-EMA)(80/20)-20 wt.% LiClO4 (d), P(GMA-co-EMA)(80/20)-30 wt. % LiClO4 (e).
30 wt. % 20 wt. %
10 wt. %
0 wt. %
XRD patterns of the LiClO4, P (GMA-co-EMA) and P (GMA-co-EMA) LiClO4 complexes with different compositions are shown in Figure 8(a–e). The XRD pattern (Fig.8a) of LiClO4 shows intense peaks between 15◦-55◦ and revealed the crystalline nature of the ionic salt. Fig. 8b displays three humps in the region of between 10◦-25◦, 25◦-35◦ and 35◦-40◦. The XRD patterns for various concentrations of salt ranging from 10 to 30 wt. % presented in Fig.8 (c-e) which indicates no peaks corresponds to pure LiClO4 and confirms the complete dissolution of the salt in the region of network polymers host. It can be seen in Fig.8 c-e that the increase in wt. % of LiClO4 has led to the decrease in the intensity of the humps, indicating a reduction in crystallinity of the polymer matrix. The incorporation of lithium perchlorate (LiClO4) to the P(GMA-co-EMA) matrix results in an increase of the amorphous character. An increase in the degree of amorphicity helps the migration of ions in the electrolyte system, which is responsible for the enhancement of the ionic conductivity [51]. The influence of crystallization on ionic conductivity can be described by two phenomena: (i) incorporation of polymer chains into lamellae and (ii) change in the properties of the amorphous phase remaining in the system [52, 53].
4. CONCLUSIONS
Interestingly, the new solid polymer electrolyte based on P(GMA-co-EMA) was successfully prepared by solution casting technique. Infrared analysis conducted on the sample showed that the interaction between lithium ions and oxygen atoms occurred at the carbonyl group, the ether group and epoxy group on the polymer structure in both GMA and EMA. The highest room temperature conductivity was obtained at approximately 2.8×10⁻⁵ Scm−1 at 30 wt. % LiClO4. It was found that the P(GMA-co-EMA)- 30 wt.% LiClO4 showed good electrochemical stability (±5v). The structural analysis recorded by XRD showed the reduction of the (GMA-co EMA) crystallinity phase at the highest conductivity. It was conducted that Poly(glycidylmethacrylate-co-ethyl methacrylate) - based solid polymer electrolyte has potential for lithium ion battery.
ACKNOWLEDGEMENTS
The authors would like to extend their gratitude towards the Universiti Kebangsaan Malaysia for providing analytical equipments that were used in this research. This work was supported by the UKM grant ukm-DLP-2012-021.
References
1. H.P. Missana, B.S. Lalia, K. Karan and A. Maxwel, Mater. Sci. Eng. B., 175 (2010) 143. 2. S.P. Low, A. Ahmad and M.Y.A. Rahman, Ionics, 16 ( 2010) 821.
3. Y. Tominaga, T. Shimomura and M. Nakamura, Polym., 51 (2010) 4295.
4. K. Ragavendran, D. Vasudevan and B. Emmanuel, Mater. Sci. Eng. B., 156 (2009)94.
5. S.A.M. Noor, A. Ahmad, I.A. Talib and M.Y.A. Rahman, Ionics. 16 (2010) 161.
6. R. Bhola, S.M. Bhola, H. Liang and B. Mishra, Trends Biomater. Artif. Organs. 23 (2010) 129. 7. T. Iijima, Y. Tyoguchi and N. Eda, Dengki Kagaku, 53 (1985) 619.
9. S.N. Amir, R. Othman, R.H.Y. Subban and N.S. Mohamed, Sains Malaysiana,40 (2011) 701. 10. Y.H. Liao, M.M. Rao, W.S. Li, L.T. Yang, B.K. Zhu, R. Xu and C.H. Fu, J. Membrane Sci., 352,
95 (2010).
11. S. Rajendran, M. Sivakumar and R. Subadevi, J Power Sources, 124 (2003) 225. 12. M. Sivakumar, Laboratory Report, Energy Materials Lab, Dept. Chem. Engg., National Taiwan
University, Taipei-106, Taiwan (2005). 13. T. Fahmy and M.T. Ahmed, Polymer Testing, 20 (2001) 477.
14. H.S. Han, H.R. Kang, S.W. Kim and H.T. Kim, J. Power Sources, 122 (2002) 4611. 15. V. Sankar, T.S. Kumar and K.P. Rao, Trends Biomater. Artif. Organs, 17 (2004) 17. 16. J. Kala, F. Svec and V. Marousek, Polymer,43 (2002) 6455.
17. H.M. Nasirtabrizi, S.Mohebalizadeh and P.A. Jadid, Iran. Polym. J., 20 (2011) 579.
18. S.H. Wang, Development of Solid Polimer Electrolytes of Polyurethane and Polyether-Modified Polysiloxane Blends with Lithium Salts [Thesis], University of Akron, (2007) United States of America. .
19. J.P. Johansson, Conformations and Vibration in Polymer Electrolytes [Dissertation], Uppsala University, (1998) Sweden. 20. A. Loupy and B. Tchoudar, Salts Effects in Organic and Organic Metallic Chemistry, VCH
Publishing, (1991) New York.
21. A. Arnaud, D. Benrabh and J.Y. Sanchez, J. Phys. Chem. 100(1996) 10882. 22. J. Zhou and P.S. Fedkiw. Solid State Ionics, 166 (2004) 275.
23. J.R. Fried, Polymer Science and Technology, 2nd ed., Prentice Hall, Upper Saddle (2003). 24. J. Xi, X. Qiu, T. Ma, X. Cui, J. Yang, X. Tang, W. Zhu, and L. Chen, Solid State Ionics. 176
(2005) 124.
25. S.A. Hanifah, L.Y. Heng and M. Ahmad, Sensors. 8, 6407 (2008).
26. I. Mijangos, F. Navarro, A. Guerreiro, E. Piletska, I. Chianella, K. Karim, A. Turne and
S.Piletsky, Biosens. Bioelectron, 22, 381 (2006).
27. C.A. Furtado, G.G. Silva and J.C. Machado, J. Phys. Chem. B., 103 (1999) 7109.
28. P. Santhosh, T. Vasudevan, A. Gopalan and K. Lee, Mater. Sci. Eng. B. 135, 65 (2006). 29. H. Wu and F. Chang, Polymer, 42 (2001) 55.
30. Y. Liang, C. Wang and C. Chen, Eur. Polym J., 44 (2008) 2376.
31. Z. Wang, B. Huang, H. Huang, L. Chen, R. Xue and F. Wang, Solid State Ionics, 85, 143 (1996). 32. M. S. Su'ait, A. Ahmad, H. Hamzah and M.Y.A. Rahman, J. Phys. D: App. Phys., 42 (2009) 55410.
33. A. Ahmad, M.Y.A. Rahman, M.M. Ali, H. Hashim and F.A. Kalam, Ionics, 13 (2007) 67. 34. R. Baskarana, S. Selvasekarapandiana, N. Kuwatab, J. Kawamurab and T. Hattorib, J. Phys.
Chem. Solids, 68 (2007) 407. 35. S. Ramesh, W. Chiam, E. Morris and R. Durairaj, Thermochim Acta., 51 (2010) 140. 36. S. Rajendran, R.S. Babu and M. Rani, Bull. Mater. Sci., 34 (2011)1525.
37. F. Wu, T. Feng, Y. Bai, C. Wu, L. Ye and Z. Feng, Solid State Ionics,180 (2009) 677. 38. S. Ramesh and M. F. Chai, Mater. Sci. Eng. B, 139 (2007) 240.
39. S. Rajendran, M. Sivakumar and R. Subadevi, Mater. Lett., 58, 641(2004)225. 40. S.D. Druger, A. Nitzam and M.A. Ratner, Phys. Rev. B., 31 (1985)3939. 41. H.S. Kim, G.Y. Choi, S.I. Moon and S. Kim, J. Appl. Electrochem., 33 (2003) 491
42. M. Watanabe, K. Sanui, N. Ogata, T. Kobayashi and Z. Ohbaki, J. App. Phys.,57(1985) 123. 43. K.D. Pradhan, R.N. P. Choudhary and B.K. Samantaray, Int. J. Electrochem. Sci., 3 (2008) 597.
44. A.S. Bhatt and D.K. Bhat, Mater. Sci. Eng B., 177, (2012).127 45. C. Yang and S. Lin, Mater. Lett., 57 (2002)873.
47. E.M. Fahmi, A. Ahmad, N.N.M. Nazeri, H. Hamzah, H. Razali and M.Y.A. Rahman, Int. J. Electrochem. Sci., 7 (2012) 5798.
48. M.D. Glasse, R. Idris, R.J. Latham, R.G. Linford and W.S. Schlindwein, Solid State Ionics, 147 (2002) 289.
49. H. Kuo, W. C. Chen and T. C. Wen, J. Power Sources, 110 (2002) 27.
50. D. Saikia, C. C. Han and Y. W. Chen-Yang, J. Power Sources, 185 (2008) 570.
51. M. Marzantowicz, J.R. Dygas, F. Krok, Z.F. czyk and E. Zygadło-Monikowska, J. Non-Cryst. Solids, 353 (2007) 4467.
52. S. Rajendran, M.R. Prabhu and M.U. Rani, Int. J. Electrochem. Sci., 3 (2008) 282.
53. S.A. Hashmi, T.K. Awalendra and H.M. Upadhyaya, Eur. Polym. J., 34 (1998) 1277. 54. S.A.M. Noor, A. Ahmad, M.Y.A. Rahman and I.A. Talib, Natural Science, 2 (2010) 190.
![Figure 5. +P8G-2E 30%LICLO4 40 Z.z Variation of ionic conductivity with [O/Li] of P(GMA-co-EMA) (80/20) -LiClOP8G-2E 30%LICLO4 50 Z.z4 P8G-2E 30%LICLO4 60 Z.zP8G-2E 30%LICLO4 70 Z.z](https://thumb-us.123doks.com/thumbv2/123dok_us/1915813.150397/9.596.100.512.462.732/figure-liclo-variation-conductivity-liclop-liclo-liclo-liclo.webp)