Int. J. Electrochem. Sci., 8 (2013) 8603 - 8613
International Journal of
ELECTROCHEMICAL
SCIENCE
www.electrochemsci.org
Preparation and Performance Study of One-Dimensional
Nanofiber-Based Sm
0.5Sr
0.5CoO
3-δ-Gd
0.2Ce
0.8O
1.9Composite
Cathodes for Intermediate Temperature Solid Oxide Fuel Cells
Liquan Fan1,2, Yueping Xiong1,*, Lianbao Liu1, Yuwei Wang1,2, Manuel E. Brito1,3
1
School of Chemical Engineering and Technology, Harbin Institute of Technology, 92 West Dazhi Street, Mailbox 1247, Harbin 150001, PR China
2
School of Materials Science and Engineering, Qiqihar University, No.42, Wenhua Street, Qiqihar 161006, PR China
3
Fuel Cell Material Group, Energy Technology Research Institute, National Institute of Advanced Industrial Science and Technology (AIST), Tsukuba 305-8565, Japan
*
E-mail: [email protected]
Received: 25 April 2013 / Accepted: 12 May 2013 / Published: 1 June 2013
Electrospinning is employed to fabricate Sm0.5Sr0.5CoO3-δ (SSC) nanofibers. One-dimensional
nanofiber-based Sm0.5Sr0.5CoO3-δ-Gd0.2Ce0.8O1.9 (SSC-GDC) composite cathodes for solid oxide fuel
cell (SOFC) are fabricated by infiltrating the GDC precursor solution into the SSC nanofibers scaffolds. Optimal polarization resistance of 0.038 Ω cm2 at 650 °C is achieved when SSC:GDC mass ratio of 1:0.869 for infiltration is used. This value is 2.6 times smaller than the polarization resistance of nanoparticle-based SSC-GDC composite under identical testing conditions. Microstructural features of the SSC-GDC interface further support the cell performance results. The nanofiber-based SSC-GDC composite is proved to be an excellent candidate as cathode material for intermediate temperature SOFCs.
Keywords: Strontium-doped samarium cobaltite; Electrospinning; Infiltration; Composite cathode
1. INTRODUCTION
Strontium-doped samarium cobaltite is attracting increasing interest recently for intermediate and low temperature solid oxide fuel cells (SOFCs) due to its high activity for oxygen reduction, high ionic and electronic conductivity and extended triple phase boundary (TPB) regions. The electrical conductivity of the perovskite SmCoO3 increases by doping the A site with strontium and it attains a
maximum value for Sm0.5Sr0.5CoO3-δ (SSC) [1]. Three distinguishable reaction steps take place in the
SSC electrode: the gas-phase O2 diffusion, the O2 adsorption/desorption process at the surface of SSC,
important to increase the triple-phase boundary (TPB) length. Many approaches, such as sol-gel [3-5], spray method [6-8], solution-combustion [9], solid phase reaction [10] and glycine-nitrate method [11-15] have been used for the fabrication of SSC ceramic particles for use as SOFC cathodes. The fine grains prepared by the above mentioned methods indeed increase the TPB length of the cathode reaction and improve the performance of the electrode. For instance, when SSC was synthesized using sol-gel process, the polarization resistance for the SSC electrode on an SDC electrolyte at 650 °C was 0.83 Ω cm2
[4]; when unique porous thick SSC cathodes were prepared by spray pyrolysis, the minimum polarization resistance values of SSC/Ce0.9Gd0.1O1.95/SSC symmetrical cells were 0.20 and
0.035 Ω cm2
at 600 and 700 °C, respectively [6].
SSC is compatible with most of the electrolyte materials commonly used in SOFC: yttria stabilized zirconia (YSZ) [4], La1-xSrxGa1-yMgyOz (LSGM) [12,13,16], samaria-doped ceria (SDC)
[4,7,8,10,15] and gadolinia-doped ceria (GDC) [6]. The polarization resistance for the SSC electrode on the GDC (or SDC) electrolyte is lower than that for the SSC electrode on the YSZ electrolyte [4,17]. For this reason, the ceria electrolyte is more suitable than the YSZ electrolyte for a SSC electrode. The electrochemical performance of SSC cathodes can be improved by adding doped ceria as its high oxygen ionic conductivity and catalytic activity result in the increase of the TPB length. SSC-SDC composite cathode, composed of an ionic conducting phase (SDC, 30 wt%) and a mixed conducting phase (SSC, 70 wt%), yielded less than 0.18 Ω cm2
at 600 °C [18]. For a composite cathode with 75 wt% SSC + 25 wt% SDC, the total electrode polarization was 0.102 Ω cm2 at 600 °C [19]. Daehee Lee et al. synthesized SSC-SDC core-shell composite cathodes via a polymerizable complex method, the symmetrical SSC-SDC/SDC/SSC-SDC half-cell exhibited a polarization resistance of 0.098 Ω cm2
at 650 °C [20]. The polarization resistance of the nanocomposite Sm0.5Sr0.5CoO3-δ-Ce0.9Gd0.1O1.95 solid oxide fuel cell cathodes produced by infiltrating SSC nitrate
solutions into GDC scaffolds was 0.1 Ω cm2
at 600 °C [21].
The electrochemical properties of cathodes depend not only on their chemical composition but also on their microstructure [3]. In our previous work [22], GDC was infiltrated into one-dimensional (1-D) LSCF cathode scaffolds to improve the electrochemical performance of LSCF electrodes, achieving a polarization resistance of 0.10 Ω cm2 at 650 °C for about 50 wt% GDC loading. The optimum polarization resistance of the nanorod structured LSCF-GDC cathode was 5 times smaller than that of LSCF-GDC nanoparticle composite cathode under identical testing conditions. The combination of 1-D architecture of nanofiber-based scaffolds and GDC infiltration has been confirmed initially to be an effective processing strategy for achieving high electrochemical performance composite cathodes [22-24]. We have established “the proof of concept” in our previous report [22] and based on it we further developed a 1-D nanofiber-based mixed ionic-electronic conductor SSC-GDC composite cathode displaying an optimal polarization resistance.
2. EXPERIMENTAL METHOD
2.1. Fabrication of SSC nanofibers and SSC cathodes
then Sm(NO3)3·6H2O (99.9%), Co(NO3)3·6H2O (99.0%), and Sr(NO3)2 (99.5%) were added into the
solution at a molar ratio of 0.5:0.5:1 with constant stirring for 24 h to form an electrospinning precursor solution. The technique of electrospinning was employed to fabricate uniform 1-D SSC nanofibers followed by a drying process and sintering treatment. As-electrospun SSC nanofibers were dried in vacuum at 200 °C for several hours and then sintered at different temperatures from 600 °C to 1000 °C for 2 h under air atmosphere. The SSC nanofibers, after calcinations at 800 °C for 2 h, were passed through a 1600 mesh sieve and were then sintered on the GDC electrolyte (self-made, sol-gel method, the substrate disks were 19 mm in diameter and about 1 mm in thickness) at 1000 °C and ultimately formed into nanofiber-based SSC cathodes with an electrode area of 0.7854 cm2.
2.2 Preparation of nanostructured SSC-GDC composite cathodes
To compare electrochemical performance, SSC cathode materials were fabricated in two different architectures: nanofibers and nanoparticles scaffolds. To this end, 1-D SSC nanofibers were ground into nanoparticles. The nanostructured composite cathodes were made by infiltration of GDC. Gd0.2Ce0.8O1.9 precursor solution (0.25 mol L-1) [22] was infiltrated, via multiple infiltrations steps,
into both types of scaffolds with different SSC:GDC mass ratios (see Table 1 and Table 3), followed by calcinations at 800 °C, and further sintering to form SSC-GDC composite cathodes.
2.3 Characterization
The phase composition of SSC nanofibers was characterized by X-ray diffraction (XRD, Rigaku D/max-IIB, Japan) using Cu Kα radiation. The microstructure and morphology of all the sintered samples were examined by scanning electron microscope (SEM, FEI Quanta 200, The Netherlands). In order to form a three-electrode half-cell for the electrochemical measurement, SSC electrodes or SSC-GDC composite cathodes were used as the working electrode, and porous Pt was used as counter electrode and reference electrode. The counter electrode was positioned symmetrically to the SSC cathode with the active electrode area of 0.7854 cm2 and the reference electrode was fixed at the rim of the GDC electrolyte. Electrochemical impedance spectra of the three-electrode system were measured in a frequency range of 0.01 Hz-100 kHz with a signal amplitude of 5 mV at temperatures between 650 °C and 750 °C using an electrochemical work station (Chi650D, CH Instruments Inc, China). Polarization resistances were derived from the difference of the real intercepts between high frequencies and low frequencies at open circuit voltage in air, and the electrolyte resistances of all test samples have been removed from the spectra to show clearly the difference in the cathode polarization impedances.
3. RESULTS AND DISCUSSION
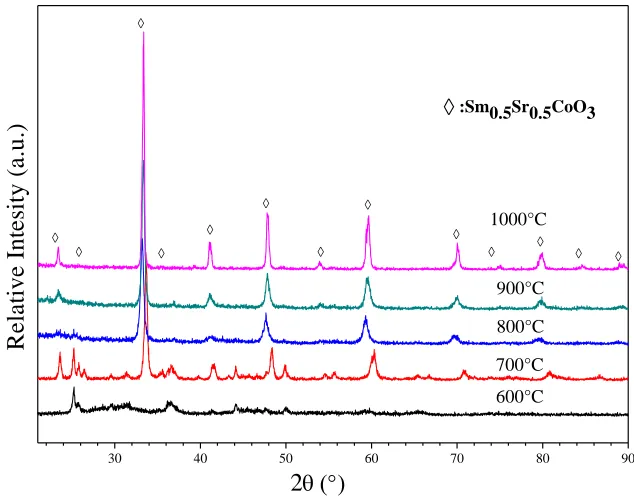
different temperatures. The SSC nanofibers are around 200 nm in diameter. Uniform SSC nanofibers without obvious breakage, after calcination at 800 °C and 900 °C for 2 hours, are presented in Fig. 1(c) and (d), respectively. As determined by X-ray diffraction (Fig. 2), sintering temperature above 800 °C renders perovskite SSC as major phase. Formation of the desired SSC perovskite phase was completed above 900 °C, and no other phase was observed. Based on the results of Fig. 1 and Fig. 2, the SSC nanofibers after calcination at 800 °C and 900 °C could be initially used as electrode materials. Indeed, SSC nanofibers calcinated at 800 °C were chosen for initial cathode materials.
[image:4.596.91.507.211.713.2]
30 40 50 60 70 80 90
R e la ti v e I n te si ty ( a .u .) 2 600°C 700°C 800°C 900°C 1000°C :Sm0.5Sr0.5CoO3
Figure 2. X-ray diffraction pattern of the SSC nanofibers calcined at various temperatures in air.
Additions of GDC phase to the SSC cathode improve the performance of the SSC cathode [18,25]. GDC precursor solution was infiltrated into the scaffolds of SSC nanofiber-based cathodes with different mass ratios and subsequent heating. Impedance spectra of 1-D nanofiber-based SSC-GDC composite cathodes were measured at different temperatures from 650 °C to 750 °C with intervals of 50 °C. Fig. 3 shows impedance spectra of the GDC-infiltrated nanofiber-based SSC cathodes with different mass ratios of SSC to GDC measured at 650 °C. In order to clearly show the difference in the cathode polarization impedance, the electrolyte resistances of all the tested cells have been removed from the spectra. As it is shown in Fig. 3 and summarized in Table 1, when the mass ratios of SSC to GDC are 1:0.414, 1:0.869, 1:1.2, and 1:1.6, the polarization resistances are 0.554 Ω cm2, 0.038 Ω cm2, 1.138 Ω cm2, and 1.547 Ω cm2, respectively. Obviously, when the mass ratio of SSC to GDC is 1:0.869, the polarization resistance reaches the optimal value of 0.038 Ω cm2 at 650 °C. Nevertheless, this value is comparable to the best data reported in the literature (Table 2) using a similar cathode composition [7,19,20,26] under similar conditions. The value of the polarization resistance represents about 6% of the corresponding value for the nanofiber-based SSC cathode before infiltration. The highest electrochemical performance of a SSC-GDC composite cathode can be achieved by using the SSC nanofiber scaffold for infiltration of the optimal amount of the GDC precursor solution. Due to its high porosity the nanofiber scaffold facilitates gas transport and continuous charge transport. The optimum infiltration amount of GDC on the SSC nanofiber scaffold maximizes TPB length, which reduces the total polarization resistance of the cathode. Fig. 4 shows that when the nanofiber-based SSC cathodes are infiltrated with GDC precursor solution in a 1:0.869 mass ratio, the polarization resistances are respectively 0.038, 0.028, and 0.010 Ω cm2
[image:5.596.134.451.100.348.2]
0.0
0.5
1.0
1.5
2.0
2.5
3.0
0.0
0.5
1.0
1.5
2.0
2.5
3.0
0.00 0.01 0.02 0.03 0.04 0.00 0.01 0.02 0.03 0.04 SSC:GDC 1:0.869 -Z '' / cm 2
0.00 0.01 0.02 0.03 0.04 0.00
0.01 0.02 0.03 0.04
Z'/ cm2
-Z
''
/
cm
2Z'
/
cm
2SSC:GDC
1:0
1:0.414
1:0.869
1:1.2
1:1.6
Figure 3. Impedance spectra of the GDC-infiltrated nanofiber-based SSC cathodes with different SSC:GDC mass ratios at 650°C.
0.00 0.01 0.02 0.03 0.04
0.00 0.01 0.02 0.03
0.04
SSC:GDC
(1:0.869
)650
C
700
C
7
50
C
Z'
/
cm
20.00 0.01 0.02 0.03 0.04
0.00 0.01 0.02 0.03 0.04
-Z
''
/
cm
2 [image:6.596.141.433.74.357.2] [image:6.596.144.421.424.689.2]
Table 1. Polarization resistances (Rp) for nanofiber-based SSC cathode and SSC-GDC composite
cathodes measured at 650°C.
SSC:GDC (mass ratio) 1:0 1:0.414 1:0.869 1:1.2 1:1.6
Rp (Ω cm2) 0.639 0.554 0.038 1.138 1.547
Table 2. Comparison of the polarization resistances (Rp) with values from the literature for SSC
composite cathodes measured at 650°C.
Composite cathode Rp (Ω cm2) References
SSC-GDC 0.038 Result work
SSC-SDC 0.110 J. Harris, et al. [7]
SSC-SDC 0.0464 X. G. Zhang, et al. [19]
SSC-SDC 0.098 D. Lee, et al. [20]
SSC-LSCF 0.12 X.Y. Lou, et al. [26]
[image:7.596.91.506.214.305.2] [image:7.596.92.504.610.764.2]
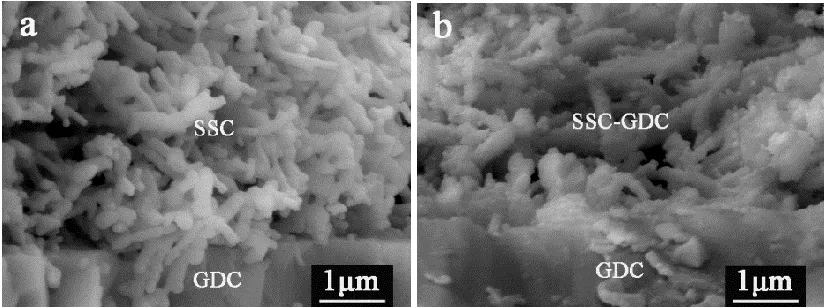
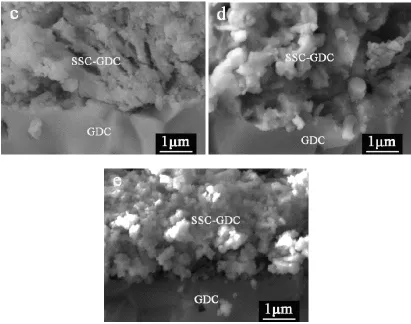
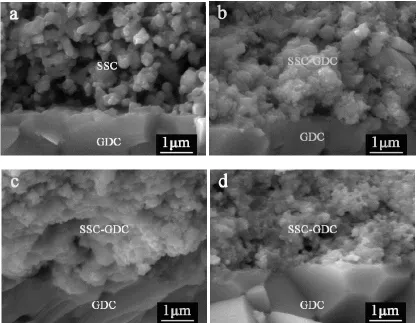
Figure 5. Cross-section SEM micrographs of the nanofiber-based SSC cathode (a), and the GDC-infiltrated nanofiber-based SSC cathodes with different SSC:GDC mass ratios: (b) 1:0.414, (c) 1:0.869, (d) 1:1.2 and (e) 1:1.6.
For comparison, nanoparticle-based SSC-GDC composite cathodes were also fabricated by the infiltration treatment with GDC precursor solution. Impedance spectra of nanoparticle-based SSC cathodes after the GDC infiltration treatment were obtained at 650 °C. Fig. 6 shows that when the SSC:GDC mass ratio is 1:0.3, the nanoparticle-based SSC-GDC composite cathode exhibits the lowest polarization resistance of 0.100 Ω cm2
. This result indicates a 60% reduction in polarization resistance compared with a nanoparticle-based SSC cathode before infiltration. In contrast, the nanofiber-based SSC-GDC composite cathode showed a much lower optimum polarization resistance (0.038 Ω cm2, 650 °C) than the nanoparticle-based one (0.100 Ω cm2, 650 °C), based on the comparison for results
[image:8.596.92.503.69.393.2]
0.0 0.2 0.4 0.6 0.8 1.0 1.2
0.0 0.2 0.4 0.6 0.8 1.0 1.2
-Z
''
/
cm
2
Z'
/
cm
2SSC:GDC 1:0 1:0.1 1:0.3 1:0.5
Figure 6. Impedance spectra of the nanoparticle-based SSC-GDC composite cathodes with different mass ratios of SSC to GDC measured at 650°C.
[image:9.596.166.404.95.327.2] [image:9.596.90.509.392.715.2]
These results show the nanofiber-based composite cathode is preferred as SOFC cathodes. This is consistent with the results previously reported in the literature [22-24].
Table 3. Polarization resistances (Rp) for nanoparticle-based SSC cathode and SSC-GDC composite
cathodes measured at 650°C.
SSC:GDC (mass ratio) 1:0 1:0.1 1:0.3 1:0.5
Rp (Ω cm2) 0.252 0.322 0.100 1.166
4. CONCLUSIONS
SSC nanofibers synthesized by electrospinning technique were successfully applied on the GDC electrolyte and the morphology of the nanofibers remained stable. 1-D nanofiber-based SSC-GDC composite cathodes produced by infiltrating an ionic conducting SSC-GDC phase into a mixed ionic and electronic conducting SSC scaffold showed good electrochemical performance due to a continuous charge transport pathways. When the nanofiber-based SSC cathodes were infiltrated with GDC precursor solution in a 1:0.869 (SSC:GDC) mass ratio, the highest cathode performance was achieved. The determination of optimal infiltration amount facilitates the achieving of the lowest polarization resistance of the composite cathodes. The TPB lengths of the optimized GDC-infiltrated SSC nanofiber electrode were significantly extended. At 650 °C, the optimum polarization resistance of nanofiber-based SSC-GDC composite cathodes was 0.038 Ω cm2, which was significantly lower than that of nanoparticle-based SSC-GDC composite cathodes (0.100 Ω cm2). Excessive GDC infiltration amount resulted in the decrease of the cathode performance due to the decrease in the cathode porosity and TPB length. Nevertheless the performance results are further supported by a detailed analysis via SEM of microstructural features in the vicinity of the SSC-GDC cathode and GDC electrolyte interface. These results further demonstrate that the architecture of 1-D nanocomposite cathodes prepared by electrospinning technique and infiltration process is an excellent processing strategy for developing cathodes for intermediate temperature SOFCs.
ACKNOWLEDGMENTS
This work was supported by the National Program on Key Basic Research Project (973 Program 2012CB215400) and the National Natural Science Foundation of China (51072040).
References
1. T. Ishihara, M. Honda, T. Shibayama, H. Furutani,Y. Takita, J. Electrochem. Soc. 145 (1998) 3177-3183.
2. M. Koyama, C.J. Wen, T. Masuyama, J. Otomo, H. Fukunaga, K. Yamada, K. Eguchi, H. Takahashi, J. Electrochem. Soc. 148 (2001) A795-A801.
[image:10.596.78.514.177.208.2]
4. F.F. Dong, D.J. Chen, R. Ran, H. Park, C. Kwak, Z.P. Shao, Int. J. Hydrogen Energy 37 (2012) 4377-4387.
5. N.P. Bansal, B. Wise, Ceram. Int. 38 (2012) 5535-5541.
6. C.L. Chang, C.S. Hsu, B.H. Hwang, J. Power Sources 179 (2008) 734-738. 7. J. Harris,O. Kesler, J. Electrochem. Soc. 35 (2011) 1927-1934.
8. C.L. Chang, B.H. Hwang, Int. J. Applied Ceramic Technology 5 (2008) 582-588. 9. N. P. Bansal, Z. M. Zhong, J. Power Sources 158 (2006) 148-153.
10.C.H. Li, S. H. Hu, K.W. Tay, Y.P. Fu, Ceram. Int. 38 (2012) 1557-1562.
11.L.A. Chick, L. R. Pederson, G.D. Maupin, J.L. Bates, L.E. Thomas, G.J. Exarhos, Mater. Lett. 10 (1990) 6-12.
12.S.Z. Wang, Y. M. Zou, Electrochem. Commun. 8 (2006) 927-931. 13.S. Yang, T.M. He, Q. He, J. Alloys Compd. 450 (2008) 400-404.
14.J.C. Chang, M.C. Lee, R.J. Yang, Y.C. Chang, T.N. Lin, J. Power Sources 196 (2011) 3129-3133. 15.H. Chen, K. Cheng, F. Ye, W.J. Weng, Ceram. Int. 37 (2011) 1209-1214.
16.S.Z. Wang, H. Zhong, Y.M. Zou, J. Power Sources 161 (2006) 1154-1160. 17.Y. Liu, W. Rauch, S.W. Zha, M.L. Liu, Solid State Ionics 166 (2004) 261-268. 18.C.R. Xia, W. Rauch, F.L. Chen, M.L. Liu, Solid State Ionics 149 (2002) 11-19.
19.X.G. Zhang, M. Robertson, S. Yick, C.D. Petit, E. Styles, W. Qu, Y.S. Xie, R. Hui, J. Roller, O. Kesler, R. Maric, D. Ghosh, J. Power Sources 160 (2006) 1211-1216.
20.D. Lee, I. Jung, S.O. Lee, S.H. Hyun, J.H. Jang, J. Moon, Int. J. Hydrogen Energy 36 (2011) 6875-6881.
21.J.D. Nicholas, S.A. Barnett, J. Electrochem. Soc. 157 (2010) B536-B541
22.E.Q. Zhao, Z. Jia, L. Zhao, Y.P. Xiong, C.W. Sun, M. E. Brito, J. Power Sources 219 (2012) 133-139.
23.M.J. Zhi, N. Mariani, R. Gemmen, K. Gerdes, N.Q. Wu, Energy Environ. Sci. 4 (2011) 417-420. 24.M.J. Zhi, S. Lee, N. Miller, N. H. Menzler, N.Q. Wu, Energy Environ. Sci. 5 (2012) 7066-7071. 25.Y.M. Park, H. Kim, Int. J. Hydrogen Energy 37 (2012) 15320-15333
26.X.Y. Lou, S.Z. Wang, Z. Liu, L.Yang, M.L. Liu, Solid State Ionics 180 (2009) 1285-1289.