This is a repository copy of
A low energy dense diet in the context of a weight
management program improves appetite control in overweight and obese women
.
White Rose Research Online URL for this paper:
http://eprints.whiterose.ac.uk/127542/
Version: Published Version
Article:
Buckland, N.J. orcid.org/0000-0002-3667-6438, Camidge, D., Croden, F. et al. (5 more
authors) (2018) A low energy dense diet in the context of a weight management program
improves appetite control in overweight and obese women. The Journal of Nutrition, 148
(5). pp. 798-806. ISSN 0022-3166
https://doi.org/10.1093/jn/nxy041
© 2018 American Society for Nutrition. This is an Open Access article distributed under the
terms of the Creative Commons Attribution License
(http://creativecommons.org/licenses/by/4.0/), which permits unrestricted reuse,
distribution, and reproduction in any medium, provided the original work is properly cited.
[email protected]
https://eprints.whiterose.ac.uk/
Reuse
This article is distributed under the terms of the Creative Commons Attribution (CC BY) licence. This licence
allows you to distribute, remix, tweak, and build upon the work, even commercially, as long as you credit the
authors for the original work. More information and the full terms of the licence here:
https://creativecommons.org/licenses/
Takedown
If you consider content in White Rose Research Online to be in breach of UK law, please notify us by
The Journal of Nutrition
Ingestive Behavior and Neurosciences
A Low Energy–Dense Diet in the Context
of a Weight-Management Program Affects
Appetite Control in Overweight
and Obese Women
Nicola J Buckland,
1,2Diana Camidge,
1Fiona Croden,
1Jacquelynne H Lavin,
3R James Stubbs,
1Marion M Hetherington,
1John E Blundell,
1and Graham Finlayson
11Human Appetite Research Unit, Appetite Control and Energy Balance Group, School of Psychology, University of Leeds, Leeds, United Kingdom;2Department of Psychology, University of Shefield, Shefield, United Kingdom; and3Nutrition and Research Department, Slimming World, Alfreton, United Kingdom
Abstract
Background:Low energy–dense (LED) foods reduce energy intake (EI); whether this effect is sustained over time and
during weight loss is unknown.
Objective:This trial examined the effects of LED compared with high energy–dense (HED) meals on appetite, EI, and
control over eating in the laboratory and during a weight-management program that encourages unrestricted intake of
LED foods [Slimming World, UK (SW)] compared with a self-led Standard Care program [NHS weight-loss plan (SC)].
Methods:Overweight and obese women [n=96; mean±SD age: 41.03±12.61 y; mean±SD body mass index
(in kg/m2): 34.00± 3.61] were recruited from the SW or SC programs. Primary outcomes included appetite, food
preferences (liking and wanting for LED and HED foods), cravings, and evening meal EI (LED, HED) in response to
calorie-matched LED (≤0.8 kcal/g) and HED (≥2.5 kcal/g) breakfast and lunch meals. Probe-day tests were conducted at
weeks 3 and 4 and repeated at weeks 12 and 13 in a within-day crossover design. Secondary outcomes, including body
weight and program experience, were measured from weeks 1 to 14 in a parallel-group design. Dietary compliance was
monitored with the use of weighed food diaries at weeks 3 and 12.
Results:Intention-to-treat (ITT) and completers analyses showed that the SW group lost more weight than the SC group
[ITT:−5.9% (95% CI:−4.7%, –7.2%) compared with−3.5% (−2.3%,−4.8%),P<0.05; completers:−6.2% (−4.8%,
−7.6%) compared with 3.9% (−2.5%,−5.2%),P<0.05]. The SW group reported greater control over eating and more
motivation to continue the program compared with the SC group. LED meals increased sensations of fullness and
reduced hunger on probe days (P<0.001). Total-day EI was 1057±73 kcal less (95% CI: 912, 1203 kcal; 36%) under
LED compared with HED conditions (P<.001). Liking for LED and HED foods and wanting for HED foods were lower
before lunch under LED compared with HED conditions, and liking decreased to a greater extent after the LED lunch.
The SW group reported fewer cravings under LED compared with HED conditions (P<0.05). On probe days, appetite
and EI outcomes did not differ between weeks 3 and 12 or between the SW and SC groups.
Conclusion:LED meals improve appetite control in women attempting weight loss and the effect is sustainable.
Con-sumption of LED meals likely contributed to weight loss in the SW program. This study was registered at clinicaltrials.gov
as NCT02012426. J Nutr2018;148:798–806.
Keywords:
energy density, satiation, satiety, appetite control, weight loss, Slimming World, UKIntroduction
According to the UK National Institute for Health and Care
Ex-cellence (NICE), more high-quality trials are needed to identify
effective components of weight-management programs (WMPs)
(
1
). One component that might facilitate weight loss is the
promotion of foods that are “satiety enhancing” or increase
feelings of fullness (
2
). As hunger is a main barrier to weight
loss attempts, targeting within- and between-meal satiety might
be an effective strategy to improve short-term appetite control
and long-term weight loss (
3
).
Low energy–dense (LED) foods contain fewer calories per
gram than do high energy–dense (HED) foods and tend to be
higher in macronutrients that are important for satiation and
satiety (
4
,
5
). Consuming LED preloads reduces hunger
sensa-tions and subsequent meal energy intake (EI) (
6–8
) compared
with HED preloads (
8
) or no preloads (
6
) in normal-weight,
overweight, and dieting individuals (
6–9
). The suppressant
ef-fect of LED meals on EI relative to HED foods has also been
demonstrated after consuming LED meals for 2 d in
normal-weight adults (
10
). Whether the effects of LED meals on
satia-tion and satiety sustain over time and translate into weight loss
is unclear (
11–13
).
Slimming World (SW), a widely available group-based
com-mercial weight loss program in the UK and Ireland, uses a
num-ber of evidenced-based behavior change techniques to target
eating and activity behaviors. The dietary component of the
pro-gram, termed “Food Optimizing,” advocates ad libitum intake
of many LED foods and controlled amounts of higher energy–
dense foods. The effect of this dietary approach on appetite and
EI has not been quantiied and it is important to understand
whether and how this program component may contribute to
the effectiveness of the WMP for weight loss. It is possible that
after following an LED diet for several weeks, compensatory
responses occur, such as increased physiological hunger (
14
) or
hedonic motivations for HED foods, which may result in greater
food intake or loss of compliance (
15–17
). Findings from
previ-ous research are mixed: one study indicated possible increased
compensatory intake after repeated consumption of LED foods
(
18
), but another did not (
19
).
SW has been shown to be broadly comparable to similar
commercial programs and slightly better than noncommercial
programs for weight loss (
20
). To date, SW has not been
com-pared with the self-led National Health Service (NHS) program,
which recommends an overall 600-kcal reduction in daily EI
within the context of general dietary and physical activity
ad-vice.
The primary aims of the current trial were to recruit women
recently enrolled on the LED-promoting SW program or a
stan-dard care (general calorie restriction) NHS Live Well program
(SC), and to examine the following:
1)
the acute effects of LED
meals on subjective sensations of appetite (satiety), ad libitum
EI (satiation), hedonic cravings, and preferences for HED foods;
2)
whether these acute effects diminish after a period of active
weight loss; or
3)
following relatively greater consumption of
LED foods in the SW program.
The secondary aims of the trial were to compare changes in
body weight, body composition, and subjective experience of
the WMPs in terms of convenience, psychological deprivation,
control over eating, motivation, and ease of use (
2
).
Funded by Slimming World UK. Slimming World UK supported the design of the test meals and recruitment.
Author disclosures: JHL is employed by Slimming World UK; RJS consults for Slimming World through the University of Leeds consulting service. NJB, DC, FC, MMH, JEB, and GF, no conlicts of interest.
Supplemental Tables 1–3 and Supplemental Figures 1–3 are available from the “Supplementary data” link in the online posting of the article and from the same link in the online table of contents athttps://academic.oup.com/jn/.
Address correspondence to NJB (e-mail:[email protected]). Abbreviations used: EI, energy intake; HARU, Human Appetite Research Unit; HC, hip circumference; HED, high energy dense; ITT, intention-to-treat; LED, low energy dense; LFPQ, Leeds Food Preference Questionnaire; LOCF, last obser-vation carried forward; NHS, National Health Service; NICE, National Institute for Health and Care Excellence; PC, prospective consumption; RMR, resting metabolic rate; SC, standard care; SW, Slimming World; TDEI, total daily en-ergy intake; VAS, visual analogue scale; WC, waist circumference; WMP, weight-management program.
Method
Female participants who were overweight or obese (n=96) were re-cruited from local Slimming World groups (SW) and the local commu-nity (SC) between September 2014 and September 2015. Recruitment emails and SW-group consultants were used to recruit newly enrolled members. The SC participants were recruited through the use of email distribution lists, University of Leeds recruitment databases (staff, stu-dents, and the community), posters, online classiied adverts and so-cial network sites. The SC participants were recruited to match the SW group in terms of age, BMI, and willingness to engage in weight loss (as-sessed at screening). Inclusion criteria were: female sex, aged 18–65 y, BMI (in kg/m2) 28–45, interested in losing weight, able to eat the study foods, and no increased physical activity in the past 4 wk. Exclusion criteria were: confounding health problems, untreated hypothyroidism, receiving systemic treatment, taking medications in the past month that have effects on appetite or weight, received bariatric surgery, pregnant (or planning), breastfeeding, known food allergies, a history of anaphy-laxis to food, smokers, engaged in a commercial WMP in the preceding 2 mo, history of eating disorders, claustrophobia, worked in appetite related-research, and unable to comply with trial procedures.
On the basis of previous research (21), power calculations estimated that a power of 0.9 with a sample size of between 60 and 80 partici-pants (30–40/group) would be suficient to give>95% probability of detecting an effect of energy density on total within-day EI of 20–33%. This sample size was also estimated to be suficient to detect the effect of dietary program on weight and body composition between groups.
The study conformed to relevant sections of the Declaration of Helsinki and was approved by the University of Leeds, School of Psy-chology ethics committee. Participants provided informed consent and upon completion received £250. The study was registered at clinicaltri-als.gov as NCT02012426.
Design
Participants were recruited to a parallel group, nonrandomized, non-blinded dietary intervention (SW, SC). The trial started with a 2-wk run-in period followed by 12 wk of trial monitoring (total 14 wk). The purpose of the run-in period was to ensure participants’ uptake and commitment to the programs (22). Participants were not blind to the WMP they were following, but were unaware that another trial group was following an alternative WMP.
To assess satiation, food preferences, and satiety outcomes, a randomized within-subjects crossover design with 2 conditions (LED, HED) was used. Participants completed 4 probe days at the Human Appetite Research Unit (HARU), where the effect of an LED diet on satiation, satiety, and food hedonics was assessed at 2 time points [weeks 3 and 4, repeated at weeks 12 and 13 (23)] (Supplemental Figure 1). The order of conditions was counterbalanced on the irst 2 probe days and reversed for the last 2 probe days. Two time points were used to examine the sustainability of effects. On probe days, participants consumed a ixed breakfast and lunch meal and EI was assessed from the evening ad libitum meal and snacks. Participants were unaware about the nature and purpose of the energy density manipulation.
Body weight was assessed at weeks 1 and 14 and body composition and health markers were assessed after the run-in period and at week 14 (measurement sessions). Weekly questionnaires assessed WMP ex-perience: convenience, psychological deprivation of food, motivation, satisfaction, and control over eating. Questionnaires were completed outside the research unit with instructions to complete on the same day and time each week.
Weight-Management Programs and Dietary Advice
SW, UK is a group-based approach that involves weekly meetings as described in detail elsewhere (24). A central component of SW is a di-etary approach that advocates ad libitum intake of LED foods within a balanced diet. SW consists of weekly weigh-ins, group support sessions, setting individual weight-loss goals, and access to online support (24). The SW group were asked to follow the dietary advice and full program provided by SW [for details, see (25)].
Energy density, appetite control and weight loss 799
Participants in the SC group were provided with a copy of the NHS Live Well weight-loss program (26). This free, structured self-led pro-gram recommends a daily reduction of 600 kcal [NICE guidelines, (27)], provides weekly dietary and physical activity advice, and encourages recording daily EI and physical activity and weekly body weight and waist circumference (WC). Online support is also available. In terms of dietary advice, the SC group was asked to follow the diet advice from the weekly modules provided in the NHS Live Well program [for details, see (26)]. To minimize any interference with the WMPs, researchers referred participants to program resources when asked for advice.
Study Measures
Subjective appetite sensations.
Subjective sensations of hunger, fullness, desire to eat, and prospective consumption (PC) were col-lected with the use of 100-mm visual analogue scales (VASs) deliv-ered through a portable device (28) [for speciic questions and re-sponses, see (23)]. Ratings were obtained immediately before and after every meal, before and after the Leeds Food Preference Questionnaire (LFPQ), and at hourly morning and afternoon intervals. VASs have been shown to be a valid and reliable method to assess subjective appetite sensations (29).Assessment of EI.
Test meals.
The LED breakfast, lunch, evening meal, and evening snacks were designed to be≤0.8 kcal/g based on select recipes pro-vided by SW. Comparable HED versions were designed that were≥2.5 kcal/g. Breakfasts and lunches contained a ixed amount of energy. Based on estimates of daily energy needs [assumed to be 1.4×
measured resting metabolic rate (RMR)] participants were allocated to 1 of 3 bands, i.e., small, ≤2000–2500 kcal/d; medium, 2501– 3000 kcal/d; and large,≥3001 kcal/d, and received a corresponding portion size. As such, this method allowed for graded individual EIs. As the participants were attempting weight loss, the total energy provided allowed for a 20% (∼600-kcal)/d energy deicit. This provided energy was distributed across the day as follows: breakfast, 20%; lunch, 30%; evening meal,∼30%; and snacks,∼20%. All meals were prepared in the HARU following standard operating procedures (foods sourced from Sainsbury’s Supermarkets Ltd.) except for the LED evening meal (chilli con carne) which was a SW recipe, batch prepared and supplied by SW.
Breakfast and lunch ixed meals.
The LED and HED breakfast and lunch meals provided a ixed isocaloric portion that participants were required to eat to entirety. For breakfast, the LED and HED meals consisted of a cooked breakfast with a sweet side dish. Breakfast was served with an optional tea or coffee (175 g water, plus optional 40 g semiskimmed milk). The lunches were a baked potato meal with salad and a sweet side dish (seeSupplemental Table 1for individual food items). The LED breakfasts were lower in energy density and percent-age of energy from fat and higher in weight (grams), percentpercent-age of en-ergy from protein and carbohydrates, and grams of iber (SupplementalTable 2).
Ad libitum evening meal and evening snacks.
The LED and HED evening meals were a beef-based chilli with sides and a sweet dish (see Supplemental Table 1). The LED meal was lower in energy density, percentage of energy from fat, and grams of iber, and was higher in percentage of energy from protein and from carbohydrates (Supplemental Table 2). Sweet and savory snacks were provided in transparent containers for evening consumption outside the laboratory (Supplemental Table 1). LED snacks were lower in energy density, percentage of energy from fat, and grams of iber, and were higher in percentage of energy from protein and from carbohydrates (Supplemen-tal Table 2). Following each meal, participants rated meal palatability based on appeal, pleasantness, and satisfaction with the use of 100-mm VAS.Total daily EI (TDEI) and weight intake were determined by sum-ming meals and snack intake.
Food preferences.
The LFPQ (30) was used pre- and post-lunch to measure implicit and explicit food preferences for HED and LED foods. A full overview of the LFPQ method can be found elsewhere (30).In short, the LFPQ provides measures of different components of food preference and food reward. An array of food pictures were used that were either LED or HED foods but similar in familiarity, protein con-tent, sweet or nonsweet taste, and palatability. Responses were recorded and used to compute mean scores for high-energy density, low-energy density, sweet, or savory food types (and different fat-taste combina-tions). To measure food liking participants rated the extent to which they liked each food (“How pleasant would it be to taste this food now?”). Food wanting was assessed with the use of a forced-choice methodology in which the food images were paired so that every im-age from each of the 4 food types (LED/HED, sweet/savory) is compared with every other type over repeated trials (food pairs). Participants were instructed to respond as quickly and accurately as possible to indicate the food they wanted to eat the most at that time (“Which food do you most want to eat now?”). Reaction times for all responses were covertly recorded and used to compute mean response times for each food type after adjusting for frequency of selection.
Cravings.
At the end of each probe day, participants completed VAS that assessed craving frequency (“How often have you experienced food cravings today?”) and intensity (“How strong have any food crav-ings been today?”). A food craving was deined to participants as an intense desire to consume a particular food or drink that is dificult to resist.Changes in body weight, body composition, RMR, and
health outcomes.
Body weight, week 1.Body weight was measured on the irst day of the WMP with the use of electronic scales (SW group: recorded as part of their irst weigh-in at an SW group meeting; SC group body weight was recorded by a researcher at the HARU). Weight was measured with shoes and heavy clothing removed. Height was mea-sured at the HARU with shoes removed.Body composition, waist and hip circumference, weeks 2 and 14. Fat mass (kilograms), fat free mass (kilograms), and percentage of body fat were measured by air displacement plethysmography (Bodpod, Con-cord) (31,32). A researcher measured WC and hip circumference (HC) (centimeters) with a lexible nonmetal tape measure (when possible, the same researcher measured WC and HC at weeks 1 and 14). WC was measured (to the nearest 0.1 cm) at the participants’ navel at the end of an exhalation. HC was measured at the participants’ widest circumfer-ence (to the nearest 0.1 cm).
RMR.RMR was measured with the use of an indirect calorimeter itted with a ventilated hood (GEM; Nutren Technology Ltd.) (33) with participants awake and lying supine for 40 min. RMR was calculated from respiratory exchange data according to the “modiied” Weir equa-tion (34). RMR was used to determine the meal bands provided on probe days.
Resting blood pressure, heart rate, and fasting blood glucose.Systolic and diastolic blood pressure and resting heart rate were measured in the supine position following 40 min of rest with the use of an Omron M10-IT digital blood pressure cuff.
A inger-prick blood sample was collected from participants and as-sessed with the use of a YSI 2300 STAT PLUS Glucose and Lactate Ana-lyzer. For WC and HC, systolic and diastolic blood pressure, heart rate, and fasting blood glucose, 2 measures were recorded and the average was used.
Subjective experiences of the WMPs.Participants rated the program through the use VAS for satisfaction, contentedness, convenience, ease of use, ability to adhere to food choices, feeling in control over eating, motivation to continue, enjoyment losing weight, lexibility, feeling de-prived of favorite foods, and urges to discontinue the program (“How satisied are you with your program?”; “How convenient do you ind your program?”; “How easy do you ind it to stick to your program?”; “Have you felt able to stick to your plan regarding your food choices?”; “How much do you feel in control of what you’re eating?”; “How mo-tivated are you to continue with your program?”; “How enjoyable do you ind losing weight with your program?”; “How lexible do you ind the program”; “Generally, how deprived of your favorite foods have you felt?”; and “Have you felt the urge to rebel and abandon your pro-gram?”).
Diet composition.To check dietary compliance, participants com-pleted a 7-d weighed food diary at weeks 3 and 12. Electronic scales
and training were provided to ensure detailed descriptions, and con-sumed weights of foods and beverages were reported. Energy density was calculated from the contribution of all food and milks (excluded all other drinks) (total EI divided by total weight intake) based on cri-teria previously used (35).
Procedure
Measurement sessions.
Participants were instructed to fast from 2200 the night before, avoid alcohol the day before, and maintain simi-lar levels of physical activity prior to sessions. Compliance was checked upon arrival. Body composition, RMR, blood pressure, fasting blood glucose, and psychometric traits (36) were then measured.Probe days.
Standardized control instructions were provided and compliance was checked upon arrival at the HARU. All meals and snacks were weighed pre- and post-consumption (to the nearest 0.1 g) to determine weight of food consumed. Food consumption was converted to EI according to the values provided from UK food composition tables (37) and manufacturers’ nutritional information.Strategy for Data Analysis
All appetite and weight outcome data were analyzed with the use of SPSS version 24 for Windows (IBM Corp). WISP 4.0 (Tinuviel Software 2013) was used to analyze food diary data. A chi-square test was conducted to compare attrition rates across groups. To com-pare differences between groups at baseline, a series of independentt tests were conducted. For primary outcomes (appetite, EI, food prefer-ences, and cravings), mixed ANOVAs were conducted with group (SW, SC) entered as a between-subjects factor. For meal palatability values, mixed ANOVAs were conducted on appeal, pleasantness, and satisfac-tion scores, with condisatisfac-tion and week as repeated-measures factors and group as a between-subjects factor. Signiicant interactions were ex-plored withttests based on condition averages for weeks 3 and 12. For secondary outcomes (weight, body composition, and health mark-ers), analyses were conducted on participants who completed the trial (completers analyses) and on an intention-to-treat (ITT) basis with the use of last observation carried forward (LOCF) for missing data (38) (carrying a baseline observation forward resulted in the same outcomes for weight change though with smaller effects). Mixed ANOVAs were conducted to examine main effects and interactions between week and group on body weight and body composition. ANCOVAs were con-ducted on percentage of weight change controlling for starting body weight. For WMP experience, weeks 3–12 were selected and compared across week and group through the use of mixed ANOVAs. In all analyses, unless stated, condition×group and week×group interac-tions are reported for comparisons between groups across condiinterac-tions and weeks.
All signiicance valuesP<0.05 are reported. Signiicant interactions were explored with post-hoc analyses based onttests unless stated, and a more conservativeαlevel was set to control for multiple tests (adjusted based on the number of post-hoc comparisons; for brevity, signiicant interactions with nonsigniicant post-hoc tests are not reported). Data are presented as means±SEs (95% CI: lower, upper) unless speciied. Partial eta squared (η2) is reported for effect sizes and interpreted as: small, 0.01; medium, 0.06; large, 0.14 (39).
Results
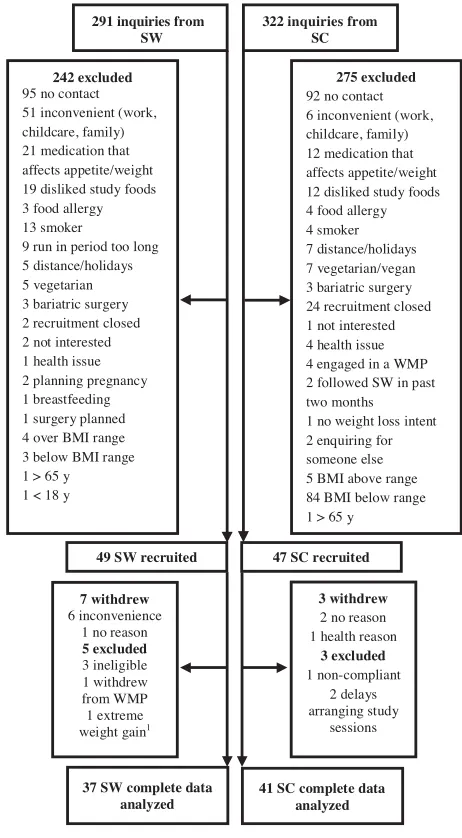
Participants
In total, 96 participants were recruited (SW
n
=
49) (
Figure 1
).
Attrition rates were similar across groups (
P
>
0.05). There
were no differences in baseline measures between completers
and those who withdrew or were excluded from the study
(
P
>
0.05).
At weeks 1 and 2, the SW and SC groups did not differ in
age, BMI, body weight, fat mass, fat-free mass, WC, HC, resting
blood pressure, or fasting blood glucose (
Table 1
).
291 inquiries from SW
322 inquiries from SC
49 SW recruited 47 SC recruited
242 excluded 95 no contact 51 inconvenient (work, childcare, family) 21 medication that affects appetite/weight 19 disliked study foods 3 food allergy 13 smoker
9 run in period too long 5 distance/holidays 5 vegetarian 3 bariatric surgery 2 recruitment closed 2 not interested 1 health issue 2 planning pregnancy 1 breastfeeding 1 surgery planned 4 over BMI range 3 below BMI range 1 > 65 y 1 < 18 y
275 excluded 92 no contact 6 inconvenient (work, childcare, family) 12 medication that affects appetite/weight 12 disliked study foods 4 food allergy 4 smoker 7 distance/holidays 7 vegetarian/vegan 3 bariatric surgery 24 recruitment closed 1 not interested 4 health issue 4 engaged in a WMP 2 followed SW in past two months 1 no weight loss intent 2 enquiring for someone else 5 BMI above range 84 BMI below range 1 > 65 y
7 withdrew 6 inconvenience
1 no reason 5 excluded 3 ineligible 1 withdrew from WMP 1 extreme weight gain1
37 SW complete data analyzed
41 SC complete data analyzed
3 withdrew 2 no reason 1 health reason
3 excluded 1 non-compliant
2 delays arranging study
[image:5.585.305.536.31.450.2]sessions
FIGURE 1 Process of recruitment and reasons for attrition and
ex-clusions.1This outlier was retained for primary analyses (e.g., ap-petite and energy intake) and removed from secondary analyses (e.g., weight and body composition changes). SC, Standard Care; SW, Slim-ming World; WMP, weight-management program.
Subjective sensations of appetite
Hunger, desire to eat, PC, and fullness proiles are shown in
Sup-plemental Figure 2. Hunger, desire to eat, and PC were lower
at every time point on the LED days than on the HED days
[
ŋp
²
=
0.22,
P
<
0.001] with the exception of prebreakfast and
postevening meal, whereas fullness was signiicantly higher at
every time point throughout the day with the exception of
pre-breakfast [
ŋp
²
=
0.22;
P
<
0.001]. Responses did not differ
be-tween groups or weeks (all
P
>
0.05).
Ad libitum evening meal, ad libitum snack intake,
and total-day EI (kilocalories and grams)
Compared with the HED days, on LED days participants
con-sumed signiicantly less energy from the evening ad libitum
meal [LED: 611
±
25 kcal (562, 661 kcal); HED: 1219
±
50 kcal (1112, 1318 kcal),
ŋp
²
=
0.79;
P
<
0.001] and snacks
[LED: 307
±
18 kcal (271, 343 kcal); HED: 757
±
64 kcal
(629, 885 kcal),
ŋp
²
=
0.47;
P
<
0.001]. This resulted in a
sig-niicant TDEI reduction of 1057
±
73 kcal (912, 1203 kcal)
Energy density, appetite control and weight loss 801
(36%) under LED conditions compared with HED conditions
[mean TDEI: LED: 1901
±
38 kcal (1826, 1975 kcal); HED:
2958
±
97 kcal (2764, 3152 kcal),
ŋp
²
=
0.74;
P
<
0.001].
For weight consumed, participants consumed 236
±
21 g
more of the LED evening meal compared with the HED evening
meal [LED: 753
±
31 g (692, 813 g); HED: 517
±
20 g (478,
556 g),
ŋp
²
=
0.62;
P
<
0.001]. There were no signiicant
differences between conditions in snack weight intake [LED:
225
±
17 g (191, 260 g); HED: 206
±
17 g (171, 240 g),
ŋp
²
=
0.01;
P
>
0.05]. Total-day weight intake was 1212
±
29 g greater under LED conditions than under HED conditions
[LED: 2301
±
43 g (2216, 2386 g); HED: 1089
±
30 g (1029,
1149 g),
ŋp
²
=
0.96;
P
<
0.001]. EI and weight intake did not
differ across groups or weeks [
ŋp
²
=
0.02;
P
>
0.05].
Despite consuming less energy from the LED evening meal,
participants rated the LED evening meal as more appealing,
pleasant, and satisfying (
P
<
0.03) than the HED evening meal
(Supplemental Table 3).
Food preferences: explicit liking and implicit wanting
for LED and HED foods
Prelunch, liking for all foods was lower under LED
condi-tions than under HED condicondi-tions (
ŋp
²
=
0.28,
P
<
0.001).
Across both conditions, from pre- to postlunch, liking decreased
for all foods (
ŋp
²
=
0.77;
P
<
0.001). However, liking for
all foods reduced to a greater degree after the LED lunch
compared with the HED lunch [LED:
−
28.49; HED;
−
17.34,
ŋp
²
=
0.28;
P
<
0.001]. This reduction in liking following the
LED lunch was speciically greater for HED foods than for LED
foods (signiicant condition
×
time
×
energy density interaction,
ŋp
²
=
0.11,
P
<
0.01). Overall liking for food did not differ
be-tween groups or bebe-tween weeks (
P
>
0.05).
In the LED condition, mean wanting for HED foods was
lower at prelunch compared with the HED condition
(signii-cant diet
×
time
×
food type interaction on wanting,
ŋp
²
=
0.08,
P
<
0.05). In the LED condition, wanting for HED foods was
signiicantly lower in the SW (
−
3.81
±
2.89 RT/freq) than in
the SC group (0.97
±
3.01 RT/freq) as qualiied with a
signii-cant group
×
condition
×
food type interaction on wanting for
high-fat foods,
ŋp
²
=
0.11,
P
<
0.01. Wanting for HED foods
in the HED condition did not differ between groups or weeks
(
P
>
0.05).
Cravings
For the SC group, craving frequency and intensity did not
sig-niicantly differ between the LED and HED probe days. For the
SW group, however, craving frequency and intensity were lower
on the LED probe days than on the HED probe days [frequency:
SC: LED: 23.3
±
4.2 mm (14.9, 31.8 mm); HED: 31.3
±
4.3 mm
(22.6, 39.9 mm); SW: LED: 17.8
±
3.2 mm (11.4, 24.3 mm);
HED: 43.3
±
4.6 mm (33.9, 52.8 mm); intensity: SC: LED:
24.7
±
3.6 mm (17.6, 31.8 mm); HED: 34.1
±
4.4 mm (25.3,
42.9 mm); SW: LED: 19.3
±
3.8 mm (11.7, 26.8 mm); HED:
41.9
±
4.7 mm (32.6, 51.2 mm)
,
ŋp
²
=
0.06;
P
<
0.05). Craving
frequency and intensity did not differ across weeks (
ŋp
²
<
0.01;
P
>
0.05).
Effects of WMP on changes in weight, body
composition, and health markers
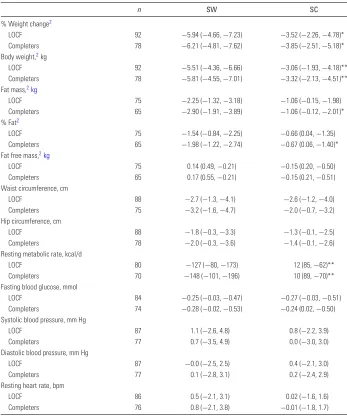
Changes in weight between week 1 and week 14.
Table 2
shows mean changes in weight, body composition, and health
markers for LOCF and completers analyses. Weight loss was
sig-niicant for both groups (
P
<
0.001). The SW group lost more
weight than the SC-group [the loss remained signiicant when
controlling for baseline body weight (
P
<
0.05)]. The SW were
more likely to lose clinically signiicant amounts of weight loss
(
>
5%) than the SC group [
χ
:
χ
(1)
=
6.69,
P
<
0.05]
(Supple-mental Figure 3).
Changes in body composition.
For changes in body
compo-sition, data were missing for 13 completers (SW:
n
=
6) because
a technical failure meant the BodPod could not be used at both
time points to measure body composition. The body
composi-tion of a further 4 participants was measured at both time points
by bioelectrical impedance (model BC418MA, Tanita) and due
to consistency these data were included in the analyses (included
as a covariate in the analysis). As such, data reported for
com-pleters was for a sample size of 65 (SW:
n
=
31). The SW group
lost more fat mass and greater percentage of fat than the SC
group (LOCF analyses were not signiicant) and this remained
signiicant when controlling for starting fat mass (
P
<
0.05).
Fat-free mass did not change between weeks for either groups.
WC and HC reduced in both groups (
P
<
0.01), though this
reduction did not differ between groups.
Changes in RMR and health markers.
RMR signiicantly
de-creased in the SW group but did not change in the SC group.
Fasting blood glucose decreased in both groups (
P
=
0.005),
this reduction did not differ between groups. Systolic and
di-astolic blood pressure and resting heart rate did not change in
either group (
Table 2
).
Experiences of the WMP.
The average response rate to
weekly questionnaires was 84.8%
±
27.2%. The SW group felt
the WMP was easier to stick to, felt more in control over their
eating and food choices, experienced more enjoyment as they
lost weight, were more satisied, and were more motivated to
continue the program compared with the SC group (
Table 3
).
There were no differences between groups on rated convenience,
urges to rebel and abandon the WMP, lexibility, or feeling
de-prived of favorite foods (
Table 3
).
Diet composition.
The food diaries showed that at both time
points (weeks 3 and 12) the SW group’s diet was less energy–
dense than the SC group’s diet [week 3: SW: 1.14 kcal/g
(4.78 kJ/g), SC: 1.51 kcal/g (6.33 kJ/g); week 12: SW: 1.27 kcal/g
(5.33 kJ/g), SC: 1.56 kcal/g (6.54 kJ/g),
p
<
0.001].
Discussion
The current indings demonstrate the utility of LED meals
for reducing subjective sensations of appetite and meal EI in
overweight or obese women during active weight loss. The
ef-fects of LED meals were sustained following a 14-wk WMP,
which included either a dietary component that promotes ad
libitum intake of LED foods (Slimming World, UK), or a
stan-dard care WMP based on national guidelines for weight loss.
The SW program was associated with greater reductions in
weight and fat mass, and greater ease, enjoyment, satisfaction,
and motivation to continue with the program compared with
SC. Despite differences in weight outcomes, there were no
dif-ferential effects of the WMPs on appetite sensations or EI in
response to LED compared with HED foods as measured in the
laboratory. Both WMPs resulted in reduced fasting blood
glu-cose and no increases in blood pressure.
The LED meals increased sensations of fullness and reduced
hunger, desire to eat, and PC throughout the day. This resulted in
TABLE 1 Baseline sample characteristics for SW and SC groups1
SW SC
Age, y 41.2±12.4 (37.3, 44.9) 40.9±12.9 (37.0, 44.8)
Height, m 1.6±0.1 (1.6, 1.7) 1.6±0.1 (1.6, 1.7)
Week 1 weight, kg 92.92±12.02 (89.35, 96.49) 90.57±12.54 (86.89, 94.26)
Week 1 BMI, kg/m² 34.1±3.7 (33.0, 35.2) 33.9±3.6 (32.8, 35.0)
Week 2 weight, kg 89.99±11.90 (86.37, 93.61) 88.32±12.57 (84.54, 92.10)
Week 2 BMI, kg/m² 33.1±3.6 (31.7, 34.2) 33.2±3.6 (32.3, 34.8)
Fat mass, kg 41.75±9.21 (38.67, 44.82) 40.94±10.14 (37.60, 44.27)
Body fat, % 46.24±5.35 (44.46, 48.02) 45.27±6.33 (43.19, 47.35)
Fat free mass, kg 47.86±5.86 (45.91, 49.81) 48.62±6.49 (46.49, 50.75)
Waist, cm 109.8±11.5 (106.3, 113.3) 107.7±11.8 (104.2, 111.3)
Hip, cm 118.1±9.8 (115.1, 121.1) 116.7±9.5 (113.8, 119.5)
RMR, kcal/d 1674±234 (1603, 1745) 1669±260 (1591, 1747)
Systolic blood pressure, mm Hg 117.3±14.5 (112.8, 121.7) 116.3±14.9 (111.8, 120.8)
Diastolic blood pressure, mm Hg 80.4±10.8 (77.1, 83.7) 79.0±9.7 (76.1, 81.9)
Heart rate, bpm 63.3±8.7 (60.7, 66.0) 61.8±8.3 (59.3, 64.4)
Blood glucose, mmol/L 4.9±0.7 (4.7, 5.1) 4.8±0.7 (4.6, 5.1)
Cognitive restraint2 10±4 (9, 11) 9±4 (8, 10)
Disinhibition2 10±3 (9, 11) 11±3 (10, 12)
Hunger2 6±4 (5, 8) 7±3 (6, 8)
1Values are means±SDs (95% CI). SW,n=44; SC,n=45. RMR, resting metabolic rate; SC, standard care; SW, Slimming World. 2Cognitive restraint, disinhibition, and hunger scores were assessed at week 2 with the Three Factor Eating Questionnaire (36).
lower TDEI. These indings correspond with previous research
which reported reduced EI in normal-weight women after
con-suming LED meals for 2 d (
10
) and extend these indings to
women who were engaged in a weight-loss program. Reduced EI
occurred without increasing hedonic wanting or subjective
crav-ings. This novel inding is important because energy-reducing
di-ets can lead to increases in the reinforcing value of food (
40
) and
the appeal of high-fat foods (
41
). As such, an LED diet appears
to be effective in reducing EI while limiting hedonic motivations
and promoting dietary control, at least over the time window of
the study.
The indings suggest that the effects of LED meals on
satia-tion and satiety were sustained after following an LED diet for
12 wk (based on probe-day assessments at week 12). Thus,
ad-herence to an LED diet offers a potentially effective strategy to
assist weight loss by promoting satiation and satiety. Adherence
to an LED diet may help limit the effect of physiologic changes
that weaken satiety and promote weight regain subsequent to
weight loss (
42
). Indeed, previous research has reported an
as-sociation between LED diets and lower increases in the hunger
hormone ghrelin in response to weight loss (
43
). Future research
should examine gut peptide responses to acute and more
pro-longed consumption of an LED diet to understand the potential
for physiological responses to lead to compensation or loss of
compliance in the long term.
Despite lower EIs, weighed intake of the ad libitum LED
meal was higher compared with HED conditions. LED foods
may exert a constraining effect on caloric compensation (
44
,
45
). LED foods may also induce greater satiation and satiety
due to increased oral processing times (
46
), altered gut
hor-mones (
47
), cognitive factors (
8
), and higher intake of protein
and iber (
4
,
5
). It is important to note that in this study, the
LED and HED meals varied not only in the energy density but
also in weight, fat, protein, carbohydrates, and grams of iber.
It is likely that the effects observed are due to a combination
of these varying nutritional properties of LED meals and not
energy density alone. This study used a whole-diet approach
rather than isolating a speciic nutrient, and this allowed us to
use meals that relect those consumed by individuals engaged in
weight loss.
These indings support previous research documenting the
effectiveness of commercial behavior change programs for
weight loss (
24
,
48–58
). Most of this evidence is from 12-wk
free primary care partnership schemes (
20
,
48
,
49
,
53
,
54
).
Similar results have been reported in regular fee-paying
pro-grams (
24
,
50
). The current study extends these indings by
demonstrating the effectiveness of SW for weight loss and
changes in body composition compared with the SC program
in women who self-referred to a weight-loss program. The
ind-ings, along with previous research, suggest that evidence-based
structured programs are more effective for weight and fat loss
than self-led approaches [e.g. (
52
)].
The current trial also examined experiential aspects of the
commercial WMP. The SW group felt more in control over
what they were eating and abler to comply with food choices
than did the SC group, which is consistent with the appetite
and eating behavior responses exhibited by the sample
over-all in response to the LED probe days in the laboratory. The
SW group experienced greater satisfaction, enjoyment, and
mo-tivation to continue, suggesting that the SW may have been
be easier for people to follow and adhere to compared with
an SC approach, although it is not possible to specify which
program components led to these differences in overall program
evaluation.
The present study used a nonrandomized, parallel groups
de-sign, which may limit the certainty of some indings (
59
).
How-ever, the 2 groups were matched at baseline in terms of age,
motivation to lose weight, eating behavior traits (in
prepara-tion), body composition, and health measures. Nevertheless, an
issue with the nonrandomized design is that participants’ body
composition, health markers, and appetite measures were not
assessed before starting the program. Although this issue does
not affect weight change (recorded at weeks 1 and 14), it is
im-portant to consider that initial enrolment in the program might
have minimized the opportunity to observe differences between
groups on these outcomes.
Energy density, appetite control and weight loss 803
TABLE 2 Changes in body weight, body composition, and health markers in SW and SC groups after a 14-wk program1
n SW SC
% Weight change2
LOCF 92 −5.94 (−4.66,−7.23) −3.52 (−2.26,−4.78)*
Completers 78 −6.21 (−4.81,−7.62) −3.85 (−2.51,−5.18)*
Body weight,2kg
LOCF 92 −5.51 (−4.36,−6.66) −3.06 (−1.93,−4.18)**
Completers 78 −5.81 (−4.55,−7.01) −3.32 (−2.13,−4.51)**
Fat mass,2kg
LOCF 75 −2.25 (−1.32,−3.18) −1.06 (−0.15,−1.98)
Completers 65 −2.90 (−1.91,−3.89) −1.06 (−0.12,−2.01)*
% Fat2
LOCF 75 −1.54 (−0.84,−2.25) −0.66 (0.04,−1.35)
Completers 65 −1.98 (−1.22,−2.74) −0.67 (0.06,−1.40)*
Fat free mass,2kg
LOCF 75 0.14 (0.49,−0.21) −0.15 (0.20,−0.50)
Completers 65 0.17 (0.55,−0.21) −0.15 (0.21,−0.51)
Waist circumference, cm
LOCF 88 −2.7 (−1.3,−4.1) −2.6 (−1.2,−4.0)
Completers 75 −3.2 (−1.6,−4.7) −2.0 (−0.7,−3.2)
Hip circumference, cm
LOCF 88 −1.8 (−0.3,−3.3) −1.3 (−0.1,−2.5)
Completers 78 −2.0 (−0.3,−3.6) −1.4 (−0.1,−2.6)
Resting metabolic rate, kcal/d
LOCF 80 −127 (−80,−173) 12 (85,−62)**
Completers 70 −148 (−101,−196) 10 (89,−70)**
Fasting blood glucose, mmol
LOCF 84 −0.25 (−0.03,−0.47) −0.27 (−0.03,−0.51)
Completers 74 −0.28 (−0.02,−0.53) −0.24 (0.02,−0.50)
Systolic blood pressure, mm Hg
LOCF 87 1.1 (−2.6, 4.8) 0.8 (−2.2, 3.9)
Completers 77 0.7 (−3.5, 4.9) 0.0 (−3.0, 3.0)
Diastolic blood pressure, mm Hg
LOCF 87 −0.0 (−2.5, 2.5) 0.4 (−2.1, 3.0)
Completers 77 0.1 (−2.8, 3.1) 0.2 (−2.4, 2.9)
Resting heart rate, bpm
LOCF 86 0.5 (−2.1, 3.1) 0.02 (−1.6, 1.6)
Completers 76 0.8 (−2.1, 3.8) −0.01 (−1.8, 1.7)
1Values are mean changes between week 1 (percentage of weight change and body weight) or 2 (all other measures) and
week 14 (95% CIs). LOCF and completers anaylsis presented. *,**Different from SW, *P
<0.05; **P<0.01. LOCF, last
observation carried forward; SC, standard care; SW, Slimming World.
2Analyses controlled for method of assessing body composition (BodPod or bioelectrical impedance).
TABLE 3 Weekly experiences of the weight-management program reported by SW and SC groups1
VAS item, mm SW SC
Satisfaction 72.8 (64.5, 81.0) 54.2 (46.0, 62.3)**
Content 69.8 (61.4, 78.1) 50.1 (42.0, 58.3)**
Convenient 71.5 (64.1, 78.9) 62.7 (55.6, 69.9)
Easy to stick to 64.5 (56.8, 72.2) 45.5 (37.9, 53.1)**
Adhere to food choices 59.5 (52.2, 66.8) 44.5 (37.4, 51.6)**
In control 69.0 (61.0, 77.1) 54.3 (46.4, 62.2)*
Motivated 76.2 (68.2, 84.2) 60.1 (52.2, 68.0)**
Enjoyment 71.9 (63.0, 80.9) 53.0 (44.2, 61.8)**
Flexibility 70.8 (63.5, 78.1) 67.6 (60.4, 74.7)
Deprived 30.8 (24.0, 37.6) 30.4 (23.7, 37.1)
Abandon program 39.0 (30.7, 47.3) 43.8 (35.3, 52.3)
1Values are means (95% CIs) based on SWn=26; SCn=27. Completers analysis
shown. Results were the same for intention-to-treat analyses (with the use of last observation carried forward). *,**Different from SW, *P<0.05, **P<0.01. SC,
standard care; SW, Slimming World; VAS, visual analogue scale.
The trial did not address long-term outcomes and it is well
es-tablished that there is a tendency for weight to be regained after
6 mo, at least in ITT models (
60
). The focus of the current
re-search was to understand the mechanisms of LED meals on
ini-tial weight loss. However, given that weight loss maintenance is
frequently the greater challenge (
61
), more trials should test the
effects of LED strategies on long-term weight loss maintenance.
Although not demonstrated in the time frame used in this study,
it is possible that after following an LED diet for a sustained
period, individuals learn to associate the sensory properties of
LED meals with low energy and compensate by increasing
por-tion size or seeking higher energy–dense foods (
17
,
18
). Thus,
it would be useful to repeat this study and compare responses
to LED meals after initial enrolment and sustained engagement
(e.g., 1 y) in an LED program.
Additionally, although the SW and SC groups were
generi-cally similar in the advice given, they differed considerably in
the speciic dietary recommendations, mode of delivery,
inten-sity, peer-group support, and implementation strategies. This
[image:8.585.43.282.550.691.2]study primarily focused on the effects of speciic dietary advice
provided and how that may have inluenced eating behavior in
the laboratory. It is unlikely that the group difference in weight
change was entirely ascribable to dietary factors alone. Thus,
the effects should not be overestimated or extrapolated to other
program components that differed (
62
). The present study also
did not use speciic behavior change taxonomies to characterize
and compare how speciic program characteristics may have
af-fected weight outcomes (
63
). Nevertheless, despite these
limita-tions, it remains highly plausible that within a multicomponent
program, the promotion of LED meals can contribute to
im-proved appetite control and weight management.
In summary, this study provided the irst evidence that LED
meals delivered in the context of weight loss reduce subjective
appetite and hedonic motivations to eat, increase control over
eating, and reduce TDEI compared with HED meals. These
ef-fects were sustained after prolonged engagement in 2 different
WMPs. Promoting consumption of LED meals is likely to
con-tribute to the signiicant weight loss and reductions in fat mass
observed in women following the SW program.
Acknowledgements
This article is dedicated in memory of our coauthor,
col-league, and friend, Diana Camidge. Diana passed away during
the preparation of this paper, after ighting a very rare
neu-rodegenerative disease (Gerstmann-Sträussler-Scheinker
syn-drome). Treatments are under development and a
founda-tion in her name is raising monies to help ight the illness,
www.dianacamidgefoundation.org
. We thank Stephen
Why-brow (Rowett Institute of Nutrition and Health, University of
Aberdeen) for analyzing the food diaries. The authors’
respon-sibilities were as follows—NJB, MMH, JEB, RJS, and GF:
de-signed the research; JHL: supported the design of the meals and
participant recruitment; NJB, DC, and FC: conducted the
re-search; NJB: performed the statistical analyses; NJB: wrote the
irst draft of the manuscript; NJB, GF, and RJS: had primary
responsibility for the inal content; and all authors: read and
approved the inal manuscript.
References
1. NICE. Weight management: lifestyle services for overweight or obese adults. [Online]. 2014. Available from:https://www.nice.org.uk/ guidance/ph53/chapter/5-Recommendations-for-research
2. Hetherington MM, Cunningham K, Dye L, Gibson EL, Gregersen NT, Halford JCG, Lawton CL, Lluch A, Mela DJ, Van Trijp HCM. Potential beneits of satiety to the consumer: scientiic considerations. Nutr Res Rev 2013;26:22–38.
3. Stubbs J, Brogelli D, Pallister C, Avery A, McConnon A, Lavin J. Behavioural and motivational factors associated with weight loss and maintenance in a commercial weight management program. Open Obes J 2012;4:35–43.
4. Stubbs RJ, vanWyk MCW, Johnstone AM, Harbron CG. Breakfasts high in protein, fat or carbohydrate: effect on within-day appetite and energy balance. Eur J Clin Nutr 1996;50:409–17.
5. Wanders AJ, van den Borne JJGC, de Graaf C, Hulshof T, Jonathan MC, Kristensen M, Mars M, Schols HA, Feskens EJM. Effects of dietary ibre on subjective appetite, energy intake and body weight: a systematic review of randomized controlled trials. Obes Rev 2011;12: 724–39.
6. Flood JE, Rolls BJ. Soup preloads in a variety of forms reduce meal energy intake. Appetite 2007;49:626–34.
7. Roe LS, Meengs JS, Rolls BJ. Salad and satiety. The effect of timing of salad consumption on meal energy intake. Appetite 2012;58:242–8. 8. Buckland NJ, Finlayson G, Hetherington MM. Slimming starters. Intake
of a diet-congruent food reduces meal intake in active dieters. Appetite 2013;71:430–7.
9. Rolls BJ, Bell EA, Thorwart ML. Water incorporated into a food but not served with a food decreases energy intake in lean women. Am J Clin Nutr 1999;70:448–55.
10. Bell EA, Castellanos VH, Pelkman CL, Thorwart ML, Rolls BJ. Energy density of foods affects energy intake in normal-weight women. Am J Clin Nutr 1998;67:412–20.
11. Karl JP, Roberts, SB. Energy density, energy intake, and body weight regulation in adults. Adv Nutr 2014;5:835–50.
12. Raynor HA, Looney SM, Steeves EA, Spence M, Gorin AA. The effects of an energy density prescription on diet quality and weight loss: a pilot randomized controlled trial. J Acad Nutr Diet 2012;112: 1397–402.
13. Ello-Martin JA, Roe LS, Ledikwe JH, Beach AM, Rolls BJ. Dietary energy density in the treatment of obesity: a year-long trial comparing 2 weight-loss diets. Am J Clin Nutr 2007;85:1465–77.
14. Sumithran P, Proietto J. The defence of body weight: a physiological basis for weight regain after weight loss. Clin Sci 2013;124:231–41. 15. Hill AJ. Does dieting make you fat? Br J Nutr 2004;92:S15–8. 16. Lowe MR, Levine AS. Eating motives and the controversy over dieting:
eating less than needed versus less than wanted. Obes Res 2005;13:797– 806.
17. Westerterp-Plantenga MS. Effects of energy density of daily food intake on long-term energy intake. Physiol Behav 2004;81:765–71.
18. Yeomans MR, Weinberg L, James S. Effects of palatability and learned satiety on energy density inluences on breakfast intake in humans. Physiol Behav 2005;86:487–99.
19. O’Sullivan HL, Alexander E, Ferriday D, Brunstrom JM. Effects of repeated exposure on liking for a reduced-energy-dense food. Am J Clin Nutr 2010;91:1584–9.
20. Jolly K, Lewis A, Beach J, Denley J, Adab P, Deeks JJ, Daley A, Aveyard P. Comparison of range of commercial or primary care led weight reduction programs with minimal intervention control for weight loss in obesity: Lighten Up randomised controlled trial. BMJ 2011; 343:d6500.
21. Flint A, Raben A, Blundell JE, Astrup A. Reproducibility, power and validity of visual analogue scares in assessment of appetite sensations in single test meal studies. Int J Obes 2000;24:38–48.
22. Brancati F, Charleston J, Cheskin L, Clark J, DiGregorio-Celnik D, Friedman-Donze L, Rubin R, Stewart K, Bray GA, DeLee DG et al. Look AHEAD (Action for Health in Diabetes): design and methods for a clinical trial of weight loss for the prevention of cardiovascular disease in type 2 diabetes. Control Clin Trials 2003;24: 610–28.
23. Blundell J, de Graaf C, Hulshof T, Jebb S, Livingstone B, Lluch A, Mela D, Salah S, Schuring E, van der Knaap H et al. Appetite control: methodological aspects of the evaluation of foods. Obes Rev 2010;11:251–70.
24. Stubbs RJ, Morris L, Pallister C, Horgan G, Lavin JH. Weight outcomes audit in 1.3 million adults during their irst 3 months’ attendance in a commercial weight management program. BMC Public Health 2015;15:882.
25. Slimming World, U. Information for health professionals. [Online]. [Accessed January 2014]. Available from: https://www.
slimmingworld.co.uk/health/evidence-base/slimming-world-program.aspx
26. NHS-Choices.Start the NHS weight loss plan. [Online]. 2015. [Accessed January 2014]. Available from: http://www.nhs.uk/Livewell/weight-loss-guide/Pages/losing-weight-getting-started.aspx
27. NICE.Obesity: identiication, assessment and management. [Online]. 2014. Available from:https://www.nice.org.uk/guidance/cg189
28. Gibbons C, Caudwell P, Finlayson G, King N, Blundell J. Validation of a new hand-held electronic data capture method for continuous monitoring of subjective appetite sensations. Int J Behav Nutr Phys Act 2011;8:57.
29. Stubbs RJ, Hughes DA, Johnstone AM, Rowley E, Reid C, Elia M, Stratton R, Delargy H, King N, Blundell JE. The use of visual analogue scales to assess motivation to eat in human subjects: a review of their reliability and validity with an evaluation of new hand-held computerized systems for temporal tracking of appetite ratings. Br J Nutr 2000;84:405–15.
30. Finlayson G, King N, Blundell J. The role of implicit wanting in relation to explicit liking and wanting for food: Implications for appetite control. Appetite 2008;50:120–7.
Energy density, appetite control and weight loss 805
31. Siri WE. Body composition from luid spaces and density: analysis of methods. In: Brozek JHanschel A, editors. Techniques for measuring body composition. Washington (DC): National Academy of Sciences, National Research Council Washington; 1961. p. 223–4.
32. Ginde SR, Geliebter A, Rubiano F, Silva AM, Wang J, Heshka S, Heymsield SB. Air displacement plethysmography: validation in overweight and obese subjects. Obesity 2005;13:1232–7.
33. Bassett DR, Howley ET, Thompson DL, King GA, Strath SJ, McLaughlin JE, Parr BB. Validity of inspiratory and expiratory methods of measuring gas exchange with a computerized system. J Appl Physiol 2001;91:218–24.
34. Weir JBD. New methods for calculating metabolic rate with special reference to protein metabolism. J Physiol 1949;109:1–9.
35. Wrieden WL, Armstrong J, Anderson AS, Sherriff A, Barton KL. Choosing the best method to estimate the energy density of a population using food purchase data. J Hum Nutr Diet 2015;28:126–34. 36. Stunkard AJ, Messick S. The three-factor eating questionnaire to
measure dietary restraint, disinhibition and hunger. J Psychosom Res 1985;29:71–83.
37. Finglas PM, Roe MA, Pinchen HM, Berry R, Church SM, Dodhia SK, Farron-Wilson M, Swan G. McCance and Widdowson’s The Composition of Foods. Seventh summary edition. Cambridge: Royal Society of Chemistry; 2015.
38. Elobeid MA, Padilla MA, McVie T, Thomas O, Brock DW, Musser B, Lu K, Coffey CS, Desmond RA, St-Onge M-P et al. Missing data in randomized clinical trials for weight loss: scope of the problem, state of the ield, and performance of statistical methods. Plos One 2009;4(8):e6624.
39. Field A. Discovering statistics using SPSS (introducing statistical methods series). Second edition. Thousand Oaks (CA): Sage Publications; 2005.
40. Epstein LH, Truesdale R, Wojcik A, Paluch RA, Raynor HA. Effects of deprivation on hedonics and reinforcing value of food. Physiol Behav 2003;78:221–7.
41. Goldstone AP, de Hernandez CGP, Beaver JD, Muhammed K, Croese C, Bell G, Durighel G, Hughes E, Waldman AD, Frost G et al. Fasting biases brain reward systems towards high-calorie foods. Eur J Neurosci 2009;30:1625–35.
42. Sumithran P, Prendergast LA, Delbridge E, Purcell K, Shulkes A, Kriketos A, Proietto J. Long-term persistence of hormonal adaptations to weight loss. N Engl J Med 2011;365:1597–604.
43. Hill BR, Rolls BJ, Roe LS, De Souza MJ, Williams NI. Ghrelin and peptide YY increase with weight loss during a 12-month intervention to reduce dietary energy density in obese women. Peptides 2013;49:138– 44.
44. de Castro JM. Stomach illing may mediate the inluence of dietary energy density on the food intake of free-living humans. Physiol Behav 2005;86:32–45.
45. Rolls BJ, Roe LS. Effect of the volume of liquid food infused intragastrically on satiety in women. Physiol Behav 2002;76:623–31. 46. de Graaf C. Texture and satiation: the role of oro-sensory exposure time.
Physiol Behav 2012;107:496–501.
47. Karl JP, Young AJ, Rood JC, Montain SJ. Independent and combined effects of eating rate and energy density on energy intake, appetite, and gut hormones. Obesity 2013;21:E244–52.
48. Ahern AL, Aveyard PN, Halford JCG, Mander A, Cresswell L, Cohn SR, Suhrcke M, Marsh T, Thomson AM, Jebb SA. Weight loss referrals for
adults in primary care (WRAP): protocol for a multi-centre randomised controlled trial comparing the clinical and cost-effectiveness of primary care referral to a commercial weight loss provider for 12 weeks, referral for 52 weeks, and a brief self-help intervention ISRCTN82857232. BMC Public Health 2014;14:620.
49. Dixon KJL, Shcherba S, Kipping RR. Weight loss from three commercial providers of NHS primary care slimming on referral in North Somerset: service evaluation. J Public Health 2012;34:555–61.
50. Finley CE, Barlow CE, Greenway FL, Rock CL, Rolls BJ, Blair SN. Retention rates and weight loss in a commercial weight loss program. Int J Obes 2007;31:292–8.
51. Heshka S, Anderson JW, Atkinson RL, Greenway FL, Hill JO, Phinney SD, Kolotkin RL, Miller-Kovach K, Pi-Sunyer FX. Weight loss with self-help compared with a structured commercial program—a randomized trial. JAMA 2003;289:1792–8.
52. Jebb SA, Ahern AL, Olson AD, Aston LM, Holzapfel C, Stoll J, Amann-Gassner U, Simpson AE, Fuller NR, Pearson S et al. Primary care referral to a commercial provider for weight loss treatment versus standard care: a randomised controlled trial. Lancet 2011;378: 1485–92.
53. Lavin JH, Avery A, Whitehead SM, Rees E, Parsons J, Bagnall T, Barth JH, Ruxton CHS. Feasibility and beneits of implementing a slimming on referral service in primary care using a commercial weight management partner. Public Health 2006;120:872–81.
54. Lloyd A, Khan R. Evaluation of Healthy Choices: a commercial weight loss program commissioned by the NHS. Perspect Public Health 2011;131:177–83.
55. Madigan CD, Daley AJ, Lewis AL, Jolly K, Aveyard P. Which weight-loss programs are as effective as Weight Watchers (R)? Br J Gen Pract 2014;64:E128–36.
56. Stubbs RJ, Brogelli DJ, Pallister CJ, Whybrow S, Avery AJ, Lavin JH. Attendance and weight outcomes in 4754 adults referred over 6 months to a primary care/commercial weight management partnership scheme. Clinical obesity 2012;2:6–14.
57. Stubbs RJ, Pallister C, Whybrow S, Avery A, Lavin J. Weight outcomes audit for 34,271 adults referred to a primary care/commercial weight management partnership scheme. Obesity Facts 2011;4:113–20. 58. Truby H, Baic S, Delooy A, Fox KR, Livingstone MBE, Logan CM,
Macdonald IA, Morgan LM, Taylor MA, Millward DJ. Randomised controlled trial of four commercial weight loss programs in the UK: initial indings from the BBC “diet trials”. BMJ 2006;332:1309–11. 59. Sibbald B, Roland M. Understanding controlled trials—why are
randomised controlled trials important? BMJ 1998;316:201. 60. Franz MJ, VanWormer JJ, Crain AL, Boucher JL, Histon T, Caplan
W, Bowman JD, Pronk NP. Weight-loss outcomes: a systematic review and meta-analysis of weight-loss clinical trials with a minimum 1-year follow-up. J Am Diet Assoc 2007;107:1755–67.
61. Mann T, Tomiyama AJ, Westling E, Lew AM, Samuels B, Chatman J. Medicare’s search for effective obesity treatments—diets are not the answer. Am Psychol 2007;62:220–33.
62. Moore GF, Audrey S, Barker M, Bond L, Bonell C, Hardeman W, Moore L, O’Cathain A, Tinati T, Wight D et al. Process evaluation of complex interventions: medical research council guidance. BMJ 2015;350:h1258.
63. Hartmann-Boyce J, Aveyard P, Koshiaris C, Jebb SA. Development of tools to study personal weight control strategies: OxFAB taxonomy. Obesity 2016;24:314–20.