White Rose Research Online URL for this paper:
http://eprints.whiterose.ac.uk/128986/
Version: Published Version
Article:
Bui, M., Adjiman, C.S., Bardow, A. et al. (27 more authors) (2018) Carbon capture and
storage (CCS): the way forward. Energy and Environmental Science. ISSN 1754-5692
https://doi.org/10.1039/c7ee02342a
[email protected]
https://eprints.whiterose.ac.uk/
Reuse
This article is distributed under the terms of the Creative Commons Attribution (CC BY) licence. This licence
allows you to distribute, remix, tweak, and build upon the work, even commercially, as long as you credit the
authors for the original work. More information and the full terms of the licence here:
https://creativecommons.org/licenses/
Takedown
If you consider content in White Rose Research Online to be in breach of UK law, please notify us by
Cite this:DOI: 10.1039/c7ee02342a
Carbon capture and storage (CCS): the
way forward
Mai Bui,abClaire S. Adjiman,bc
Andre´ Bardow, dEdward J. Anthony, e
Andy Boston,f Solomon Brown, gPaul S. Fennell,cSabine Fuss,h
Amparo Galindo,bcLeigh A. Hackett,iJason P. Hallett, cHoward J. Herzog, j George Jackson,cJasmin Kemper,kSamuel Krevor,lmGeoffrey C. Maitland, cl Michael Matuszewski,nIan S. Metcalfe,oCamille Petit,cGraeme Puxty,p
Jeffrey Reimer,qDavid M. Reiner,rEdward S. Rubin, sStuart A. Scott,t Nilay Shah,bcBerend Smit, quJ. P. Martin Trusler,clPaul Webley,vw Jennifer Wilcoxxand Niall Mac Dowell *ab
Carbon capture and storage (CCS) is broadly recognised as having the potential to play a key role in meeting climate change targets, delivering low carbon heat and power, decarbonising industry and, more recently, its ability to facilitate the net removal of CO2from the atmosphere. However, despite this broad consensus and its
technical maturity, CCS has not yet been deployed on a scale commensurate with the ambitions articulated a decade ago. Thus, in this paper we review the current state-of-the-art of CO2capture, transport, utilisation and
storage from a multi-scale perspective, moving from the global to molecular scales. In light of the COP21 commitments to limit warming to less than 21C, we extend the remit of this study to include the key negative emissions technologies (NETs) of bioenergy with CCS (BECCS), and direct air capture (DAC). Cognisant of the non-technical barriers to deploying CCS, we reflect on recent experience from the UK’s CCS commercialisation programme and consider the commercial and political barriers to the large-scale deployment of CCS. In all areas, we focus on identifying and clearly articulating the key research challenges that could usefully be addressed in the coming decade.
aCentre for Environmental Policy, Imperial College London, South Kensington, London SW7 1NA, UK. E-mail: [email protected] bCentre for Process Systems Engineering, Imperial College London, South Kensington, London SW7 2AZ, UK
cDepartment of Chemical Engineering, Imperial College London, South Kensington, London, SW7 2AZ, UK d
Chair of Technical Thermodynamics, RWTH Aachen University, 52056 Aachen, Germany
eCentre for Combustion, Carbon Capture & Storage, Cranfield University, Bedford, Bedfordshire MK43 0AL, UK fRed Vector Ltd., Barrow Upon Soar, Loughborough, Leics LE12 8JY, UK
gDepartment of Chemical and Biological Engineering, The University of Sheffield, Sheffield S1 3JD, UK hMercator Research Institute on Global Commons and Climate Change, 10829 Berlin, Germany iIndustria Mundum AG, Zu¨rich, Switzerland
jMassachusetts Institute of Technology, Cambridge, Massachusetts 02139, USA
kIEA Greenhouse Gas R&D Programme (IEAGHG), Pure Offices, Cheltenham Office Park, Hatherley Lane, Cheltenham, Gloucestershire, GL51 6SH, UK
lQatar Carbonates and Carbon Storage Research Centre, Department of Chemical Engineering, Imperial College London, South Kensington Campus, London SW7 2AZ, UK mDepartment of Earth Science & Engineering, Imperial College London, South Kensington, London, SW7 2AZ, UK
nUS Department of Energy, National Energy Technology Laboratory (NETL), Pittsburgh, PA, USA
oSchool of Chemical Engineering and Advanced Materials, Newcastle University, Newcastle-upon-Tyne NE1 7RU, UK pCSIRO Energy, Mayfield West, New South Wales 2304, Australia
qDepartment of Chemical and Biomolecular Engineering, University of California Berkeley, Berkeley, CA 94720, USA rEnergy Policy Research Group, Judge Business School, University of Cambridge, Cambridge, UK
sEngineering & Public Policy and Mechanical Engineering, Carnegie Mellon University, Pittsburgh, Pennsylvania 15213, USA tUniversity of Cambridge, Department of Engineering, Cambridge CB2 1PZ, UK
u
Laboratory of Molecular Simulation, Institut des Sciences et Inge´nierie Chimiques, Valais Ecole Polytechnique Fe´de´rale de Lausanne (EPFL), Rue de l’Industrie 17, CH-1951 Sion, Switzerland
vDepartment of Chemical Engineering, The University of Melbourne, Victoria 3010, Australia
wThe Peter Cook Centre for Carbon Capture and Storage, The University of Melbourne, Victoria 3010, Australia xChemical and Biological Engineering Department, Colorado School of Mines, Golden, Colorado 80401, USA
Received 17th August 2017, Accepted 5th January 2018
DOI: 10.1039/c7ee02342a
rsc.li/ees
Environmental
Science
REVIEW
Open Access Article. Published on 12 March 2018. Downloaded on 19/03/2018 15:21:11.
This article is licensed under a
Creative Commons Attribution 3.0 Unported Licence.
Broader context
Carbon capture and storage (CCS) is recognised as being vital to least cost pathways for climate change mitigation, and in particular the negative emissions technologies (NETs) that are key to limiting warming to ‘‘well below’’ 2C. However, it has not yet been deployed on the scale understood to be required, owing to a variety of technical, economic and commercial challenges. This paper provides a state-of-the-art update of each of these areas, and provides a perspective on how to the discipline forward, highlighting key research challenges that should be addressed over the course of the next decade. Importantly, this perspective balances scientific, policy and commercial priorities.
1 Introduction
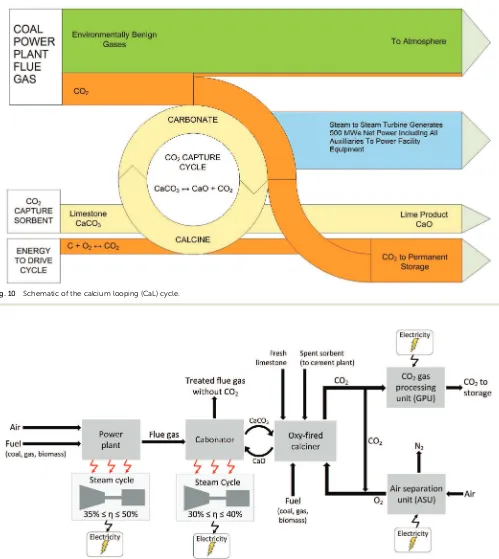
This paper is the third installment in a series of publications over several years in Energy & Environmental Science.1,2 The first (published in 2010) provided an introduction to CO2 capture technologies, with an overview of solvent-based chemisorption (amines and ionic liquids), carbonate looping, oxy-fuel combus-tion technologies, CO2conversion and utilisation (CCU) and multi-scale process engineering of CCS.1 The second installment pre-sented an update on developments in amine scrubbing, ionic liquids, oxy-combustion and calcium looping. New topics added in this second paper include chemical looping combustion, low temperature adsorbents, direct air capture technologies, flexible CCS operation, CO2transport and storage, and a historical over-view of the UK and EU CCS policy and legislation.2
Distinct from the previous installments, this third paper sets out to comprehensively review the state-of-the-art developments in CCS, whilst also providing a holistic perspective on the role of CCS technologies in mitigating anthropogenic climate change. We first discuss the current status of CCS development and highlight key CCS technologies that are near commercialisation phase (Section 2). Then in Section 3 we contextualise CCS technology by considering its representation and utilisation in integrated assessment models (IAMs), challenging the view that it is a ‘‘bridging technology’’, likely to be relevant for only a few decades. We then go on to quantify and qualify the role and value of CCS at a more granular level by evaluating the way in which CCS interacts with national scale electricity systems. This in turn helps us address the question of what service CCS provides to the electricity system, with whom is CCS competing and what technologies does CCS complement.
We then move on to consider the utility of CCS in decarbonis-ing the industrial sector, with a focus on the key emitters – the production of iron and steel, cement and oil refining and petro-chemicals. Throughout, we aim to challenge the perception that industrial CCS is uniquely costly, showing that, for example, the cost of decarbonising the refining sector is essentially ‘‘lost in the noise’’ of market fluctuations of the end use sectors.
Section 4 of the paper considers key post-combustion CCS technologies in detail. The purpose of this paper is not to enumerate the panoply of technologies that are available for capturing CO2. Rather, we focus on solid- and liquid-phase sorbents, and attempt to specify key research questions that need to be address in these areas. We then select three particularly promising alternative technologies for CCS in Section 5: chemical looping combustion, membranes and ionic liquids.
It is well known that the thermophysical and kinetic proper-ties of the sorbents used for CO2 capture dictate both the
capital and operating cost of the processes in which they are used. For this reason, there is a concerted effort to rationally design new sorbent materials, with the bulk of the effort in the development of liquid sorbents, where available theories are more readily applied. Thus, we present an assessment of SAFT-based approaches to model and design new materials in Section 6, with a focus on how efforts at the molecular and process scales might be linked.
Before CO2can be safely and reliably sequestered, it must be transported from source to sink. Whilst the majority of studies assume pipeline transport, ship and rail transport are potential alternatives; these other transport options are discussed in Section 7. Similarly, despite the fact that CO2 transport by pipeline is exceptionally mature, the impact of capturing CO2 from a diverse set of power and industrial sources on the quality of CO2 being transported is sufficiently important to warrant careful consideration.
The typical fate of CO2is to be sequestered, either in a saline aquifer or, potentially, used for enhanced oil recovery (EOR). The various challenges of operation, monitoring and verification of CO2 storage are discussed in Section 8, whereas Section 9 discusses CO2-EOR. A potential alternative to the storage of CO2is its re-use – the valorisation of CO2 to produce marketable compounds. The argument is sometimes made that this can both contribute to climate change mitigation and provide an attractive revenue stream. Section 10 discusses the potential for CO2conversion and utilisation (CCU), also its merits and challenges are presented and considered. In light of the global commitment achieved in Paris in December, 2015,3 we have extended this paper to include key negative emissions technologies (Section 12); bioenergy with CCS (BECCS) and direct air capture of CO2(DAC). These areas are of particular importance owing to their potential impor-tance and their controversy.
Despite the fact that there are currently 37 CCS projects at various stages in the Americas, Europe, Middle East and Asia-Pacific,4 CCS continues to languish as an ‘‘orphan technology’’.†With decades of technical experience across the
entire value chain, it is clear that it is not a lack of technical expertise that is inhibiting the commercial deployment of CCS technology. Thus, we have devoted a section of this paper to consider ‘‘what needs to happen’’ from a commercial perspec-tive (Section 13), drawing upon experience developed as part of the UK’s most recent CCS commercialisation programme.5 Having provided this perspective from the private sector, we
†Anecdotally attributed to Lord Ronald Oxburgh of the United Kingdom House of Lords.
Open Access Article. Published on 12 March 2018. Downloaded on 19/03/2018 15:21:11.
This article is licensed under a
then complement this with an international analysis of the political economy of CCS (Section 14). Section 15 then con-cludes with a proposed approach to evaluate the utility of a ‘‘novel technology’’ and feasibility of particular targets by identifying limitations that might prove to be showstoppers.
2 Current status of CCS development
Carbon capture and storage is expected to play an important role in meeting the global warming targets set by the IPCC6and at COP21.3 There is a suite of technologies being developed for the capture, transport, storage and utilisation of CO2. Typically, technology development will progress in a series of scale-up steps: (i) bench or laboratory scale, (ii) pilot-scale, (iii) demonstration scale, and lastly (iv) commercial scale.7Fig. 1 summarises the current development progress of different CCS technologies on the TRL scale.‡ As
illustrated by Fig. 1, there is congestion of technologies at the TRL 3, TRL 6 and TRL 7 development phases. The progression of a technology beyond TRL 3 requires further research funding, whereas advancing technologies beyond TRL 5 and TRL 7 needs significant financial investment and/or commercial interest (e.g., in the case of polymeric membranes). Further detailed discussion on the technical development of the individual CCS technologies is presented in the following sections of this paper. Here in this section, we highlight the key CCS technologies that have reached (or close to reaching) the commercial phase of development.
CO2capture
Chemical absorption (e.g., using aqueous amine solutions) has been used to remove CO2from natural gas for decades,11thus, it is considered to have a TRL of 9. This technology has been utilised in two commercial-scale post-combustion capture facilities in coal-fired power plants, Boundary Dam12,13and Petra Nova.14,15 Recent developments in polymeric membranes have enabled the technology to successfully achieve demonstration scale (TRL 7). The Polaris membrane is now available commercially and has been used for CO2separation from syngas.16Air Products are licensing a polymeric membrane developed at NTNU, which can be applied to coal-fired power plants and other combustion processes (still under development).17Thus, The first ‘‘commercial-ready’’ direct air capture (DAC) plant recently opened in Hinwil, Switzerland on May 2017,18with the support of cost contributions from the Swiss Federal Office of Energy. The plant supplies 900 tonnes of CO2annually to a nearby greenhouse.19Capture technologies that have also reached TRL 7 (demonstration) (e.g., oxy-combustion coal power plants, adsorption) could also potentially reached commercial status in the near future. In contrast to post-combustion capture, integrated gasification combined cycle (IGCC) with CCS has been less successful with the Kemper County IGCC Project being suspended recently.20 Southern Company’s decision to halt the project came after
encountering a series of problems, these include failure to meet the delivery deadline, severe technical issues and being majorly over budget.21,22
CO2transport
The technologies for CO2transport are well established. There are46500 km of CO2pipelines worldwide (both on-shore and off-shore), most of which are associated with EOR operation in the United States.23The technology for CO
2transport with ships is also relatively mature.24 As these transport technologies are currently being used in commercial applications, all have a TRL of 9.
CO2storage
As many commercial-scale CCS projects already use CO2-enhanced oil recovery (EOR), 13 of the 17 operating commercial-scale CCS projects, there is a significant amount of existing experience and knowledge, which has enabled CO2-EOR to reach TRL 9. Similarly, saline formations have been used for CO2storage at commercial-scale project, including Sleipner CO2Storage, Snøhvit CO2Storage and Quest (on-shore and off-shore). In contrast, CO2 storage by enhanced gas recovery (EGR)25and storage in depleted oil and gas fields have not reached operation at commercial-scale, thus, both are still at the demonstration phase (TRL 7). Ocean storage and mineral storage are still in the early phases of development.
CO2utilisation
There are a number of facilities that utilise CO2 for various applications. These commercial CO2 utilisation processes are TRL 9 as they are mature technologies. Most are in the food and beverage industry and some in chemical production (e.g., urea, methanol).26Several projects utilise CO
2for mineral carbona-tion, for example, Searles Valley plant (US). In Saga City, Japan, CO2capture from waste incineration is utilised for the cultiva-tion of crops and algae.27 The CO
2for each project is mainly sourced from industrial processes (e.g., fertiliser production, ammonia production, ethylene glycol plants), but some pro-jects capture the CO2from power plant flue gas.26
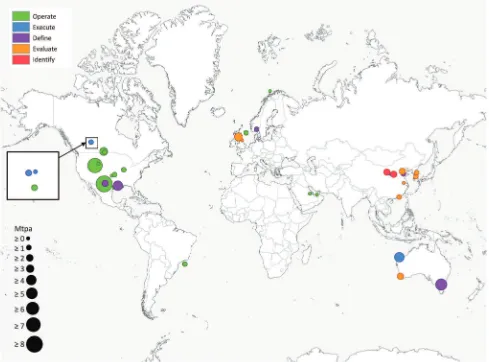
Commercial-scale CCS projects
Deployment of large scale CCS projects has been slow. Of the 37 major large scale CCS projects, 17 of these are in operation, 4 in construction and the remainder are in varying stages of development.4 As shown in Fig. 2 and 3, the majority of the commercial large-scale CCS projects are located in the United States. In terms of the project life cycle (i.e., identify, evaluate, define, execute and operate), the US also has the greatest proportion of projects in operation. For all but one of these projects, enhanced oil recovery is the primary storage for the captured CO2. Furthermore, the projects in the US have the largest CO2capture capacity compared with projects in the rest of the world: Century Plant captures 8.4 MtCO2per year, whereas Shute Creek Gas Processing Facility capture 7 MtCO2per year.4 Although China has the second highest number of projects, only one of these is in the execute phase (Yanchang Integrated CCS Demonstration), and most are in early stages of development (e.g., pre-feasibility, FEED studies). The CO2capture capacity of the
‡The ‘‘technology readiness level’’ (TRL) system provides a means of tracking the
status of technologies during their progression through different stages of research and development (R&D). It is a nine-point scaling system used to qualitatively evaluate the maturity level of a technology.8–10
Open Access Article. Published on 12 March 2018. Downloaded on 19/03/2018 15:21:11.
This article is licensed under a
projects in China range between 0.4–2 MtCO2per year. Europe has the third highest number of large-scale projects, with two operational
projects in Norway: the Sleipner CO2Storage Project captures 1 MtCO2per year, and Snøhvit CO2Storage Project 0.7 MtCO2per year. Of the five projects in Canada, three are in operation: (i) Great Plains Synfuel Plant and Weyburn-Midale Project (3 MtCO2 per year), (ii) Boundary Dam CCS Project (1 MtCO2 per year), and (iii) Quest (B1 MtCO2per year). There are also operating CCS projects in Brazil, Saudi Arabia and United Arab Emirates with CO2capture capacities ranging from 0.8–1 MtCO2 per year. A fundamental requirement for the success of CCS projects in all of these projects is the availability of safe geological storage for the capture CO2. Furthermore, other factors that can help bring CCS projects into operation phase include secure financial funding, as well as supportive policy and legislative frameworks.28
3 Role and value of CCS
3.1 Climate change mitigation
Integrated Assessment Models (IAMs) have been at the heart of the Intergovernmental Panel on Climate Change’s (IPCC) assessment of pathways towards keeping average global warming to less than 21C within this century.6They provide a means to Fig. 1 Current development progress of carbon capture, storage and utilisation technologies in terms of technology readiness level (TRL). BECCS = bioenergy with CCS, IGCC = integrated gasification combined cycle, EGR = enhanced gas recovery, EOR = enhanced oil recovery, NG = natural gas. Note: CO2utilisation (non-EOR) reflects a wide range of technologies, most of which have been demonstrated conceptually at the lab scale. The list of
technologies is not intended to be exhaustive.
Fig. 2 The CO2 capture capacity of commercial-scale CCS projects
worldwide. The number labelled on each proportion of capture capacity corresponds to the number of projects. Data from the Global CCS Institute.4
Open Access Article. Published on 12 March 2018. Downloaded on 19/03/2018 15:21:11.
This article is licensed under a
explore the future role of particular technologies in meeting climate targets such as renewables or nuclear.
CCS is one of the very attractive options in the IAMs mitigation portfolios, as it has a number of advantages. First, CCS can be integrated into existing energy systems without requiring large amendments to the system itself. Clearly, renewable technologies become more expensive at high penetration rates as a result of the need for the infrastructure to accommodate intermittency.29 Furthermore, CCS is a viable option for the decarbonisation of emission-intensive industries such as cement production (specific industrial CO2capture costs are given in Section 3.3).30And finally, CCS can be combined with low-carbon or carbon-neutral bioenergy (BECCS) to generate negative emissions,31i.e.while the cultivation of the feedstock biomass sequesters about as much CO2 as is generated during the process of producing energy (bio-electricity or biofuels), additionally capturing the latter leads to a withdrawal of CO2 from the atmosphere.32 BECCS has the double benefit of mitigating emissions and generating energy, making it attractive from the cost-optimisation perspective of an IAM.
3.1.1 CCS in integrated assessment models (IAMs).Based on the model intercomparison study by Koelblet al.,33 some general statements on the implementation of CCS in IAMs
can be made. In some cases, CCS is modelled as a lump-sum add-on cost to the technology it is combined with, while other models separate capture costs and transport & storage and a few separate all cost items. The latter modes obviously give more detail about the CCS supply chain, which enables modellers to also test the sensitivity of results to individual cost components. All IAMs include at least the power sector for CCS and many also cover industry and liquid fuels/hydrogen/gas production. At least 1 sector is also eligible for BECCS (in- and excluding liquid fuels), but many IAMs cover up to 3 sectors with BECCS. There is quite a divergence with respect to the assumption about CCS lifetimes, ranging from 30 to 60 years (partially depending on the technology), though most of the models assume around 40 years. It is also interesting in this light that there are some models not allowing early retirement of CCS plants. Almost all of the IAMs of the model intercomparison assume that CCS investment costs develop according to an exogenous constant (often declining); only two have endogenous learning.§
Fig. 3 Commercial-scale integrated CCS projects around the world. Circle size is proportional to the CO2capture capacity of the project and the colour
indicates the lifecycle of the project. Data from the Global CCS Institute.4
§Endogenous learning occurs through learning curves in these models, i.e.
cumulative capacity determines the cost reductions, while other models assume cost reductions according to an exogenously given factor.
Open Access Article. Published on 12 March 2018. Downloaded on 19/03/2018 15:21:11.
This article is licensed under a
[image:6.595.54.543.50.412.2]Finally, concerning storage, while many models have a regional differentiation of storage capacity, only a few models allow for international trade in storage capacity. The maximum capacity ranges between 3500 GtCO2 cumulative, and unlimited storage. Transportation and storage cost (excluding capture cost) varied between 10–300 US$ per ton CO2, depending on model and storage type.33All of the models considered transportation and storage costs at the lower end of this range. Models that also considered high transportation and storage cost include the POLES model (upper range value of $300 USD) and the GRAPE model (upper range cost of $262 USD).33The higher values for storage cost are associated with options that were offshore, enhanced coal bed methane (ECBM) and at greater depths (e.g., 2000–3000m).34
The IAMs thus differ widely in their deployment of CCS, yet the model intercomparison, which is the basis for the numbers cited above, could not explain the divergence of results on the basis of model type, model assumptions or the way in which CCS has been modelled. So either these are not the drivers of the difference or their impact is confounded by other factors via system effects. Individual model studies find that CCS contributes 50% more to mitigation if technological learning is included (Riahi et al.35
cumulative storage of 150–250 GtCO2) and that the contribution of CCS is sensitive to its cost in 2050 but not in 2100.36
3.1.2 Current status of CCS deployment.Even though CCS thus plays a central role in IAM decarbonisation scenarios, deployment has barely reached the levels indicated by the projections of IAMs and roadmaps by the International Energy Agency.37–39Looking into the future, only a few of the Intended Nationally Determined Contributions (INDCs), which countries pledged at the climate negotiations in Paris, feature CCS as a priority area.40
More specifically, a recent report on CCS by the IEA41 reviews the progress of the past 20 years and concludes that the current rate of progress is falling short of what is required to achieve climate goals. This is further underlined in the analysis of the INDCs by Spenceret al.:40national and global scenarios based on the Paris pledges both show little deploy-ment of CCS, with a share of CCS in electricity generation of only 3% in 2030 for the USA, China, Japan and the European Union. This is further exacerbated by the opposition against CCS, which is motivated by perceived uncertainties concerning its safety and the fear that it will serve to prolong the depen-dence on fossil fuels and be a barrier to greater utilisation of renewable power.42,43
The next section will present the current state-of-the-art knowledge on the role of CCS – and by extension BECCS – in IAMs. The review will first focus on an model intercomparison exercise of 18 IAMs33(EMF27¶) and then widen towards the low stabilisation pathways in the IPCC’s Fifth Assessment Report6 (AR5). Secondly, an investigation of the scenarios consistent with the more ambitious 1.51C climate goals adopted at COP21
in Paris (UNFCCC 2015), serves to underline the main insights on CCS and puts specifically BECCS into the spotlight.
3.1.3 Integrated assessment modelling: the role of CCS in meeting targets
State-of-the-art scenarios focusing on the 2 1C target. This subsection draws on the results of the model intercomparison presented in Koelblet al.,33 as it is the most recent and most comprehensive assessment specifically targeted at the role of CCS in long-term climate change mitigation scenarios. The study itself draws on the output of the 27th Energy Model Forum (EMF), to which 18 IAMs contributed, thus providing an excellent opportunity for a systematic comparison of results with respect to the role of CCS.8
Koelblet al.33find that CCS plays an important role in all of the models’ mitigation portfolios that were investigated. While the range of CO2captured varied widely between models (up to 3050 GtCO2cumulatively until 2100 in some instances), none of them captured less than 600 GtCO2. Table 1 shows the ranges across scenarios with different stabilisation targets and renew-ables penetration by model type** based on Koelbl et al.33
While the authors cannot easily explain the large range across models by looking at individual model assumptions (see Section 3.1.1 and Table 1), the fact that models consistently capture a minimum of 600 GtCO2 cumulatively until 2100 – which would be more than half of the required emission reductions consistent with a 21C pathway††– does give a sense for the magnitude and importance of the role of CCS in IAMs. Furthermore, the authors do not find a decreasing role for CCS over time. On the contrary, the CCS share in primary energy is mostly higher in the second half of the century compared to the first. In particular, the ranges for capture rates in Koelbl et al.33 are 5–23 GtCO2 per year in 2050 and 8–50 GtCO2per year in 2100. This undermines the reputation of CCS as a bridging technology and further underlines its importance in IAMs, which seek to achieve ambitious climate targets. The importance is further enhanced under pessimistic assumptions about technological development of renewable energy for a given climate target, indicating little flexibility for the cost-optimal deployment of alternatives.
¶ 27th round of the Energy Modelling Forum: https://emf.stanford.edu/projects/ emf-27-global-model-comparison-exercise.
8It has to be noted, however, that in most cases, results were only available for the full time horizon and scenarios considered for 12 models out of the 18 ones that participated, thus the authors conclude that more research is needed to substantiate some of the more detailed findings, which this section will not go into.
** The technology-focussed models are engineering-based models which con-sider a large number of energy technologies. They are typically used to calculate the least cost approach to meet a given demand (e.g., emission reduction target). In contrast, macro-econometric models consider production costs at an industry level, offering more economic detail but lack structural detail. A hybrid model combines both technology-based and macro-economic approaches.44
††To ensure global warming stays below 21C, the cumulative emissions from 1870 must remain less than 3650 GtCO2.45Of this quota, the total remaining emissions from 2017 is estimated to be around 800 GtCO2.46–48 At current emission rates, global emissions is expected to exceed the 800 GtCO2budget within 20 years.47
Open Access Article. Published on 12 March 2018. Downloaded on 19/03/2018 15:21:11.
This article is licensed under a
Finally, the use of BECCS‡‡in the models’ CCS fuel portfolio
increases with the stringency of the target. This is mostly connected to substitution for coal and natural gas over time. In response to the concerns with respect to large-scale cultiva-tion of biomass for BECCS and the reservacultiva-tions concerning CCS discussed above, the EMF models also produced a whole array of scenarios limiting the use of both biomass and CCS. Although these scenarios achieve the same target, they are consistently characterised by higher costs, which is consistent with earlier findings bye.g.Azaret al.49and later confirmed by the results of the IPCC’s AR5.6
In the absence of CCS, the total cost of climate change mitigation increased by 138%, whereas limited bioenergy avail-ability increased cost by 64%.§§6The integration of CCS into an
energy system provides a significantly greater reduction in CO2 emissions compared to wind technology.50 With limited CCS and biomass availability, the deployment of nuclear, intermittent solar/wind, interconnection and gas-fired power needs to increase, consequently leading to higher total system cost.51The increase in mitigation cost is associated with the delay in technology deployment6(e.g., more time to establish infrastructure), use of more expensive technologies (nuclear), and maintaining grid stability (e.g., intermittency requires the addition of ‘‘back-up’’ capacity and part-load/flexible operation).50
In particular, the IPCC scenarios associated with a more than even chance of achieving the 21C target are characterised
by average capture rates of 10 GtCO2per year in 2050 and 25 GtCO2
per year in 2100 and cumulative storage of 800–3000 GtCO2by the
end of the century.29 With respect to finding more expensive mitigation strategies when CCS is not available, it is important to note that under these circumstances, there are actually a sig-nificant number of IAMs, which do not find a feasible solution at all: Riahiet al.52conduct a model intercomparison, where a third of the IAMs do not find a feasible solution at 450 ppm without CCS under optimal circumstances. If there is further delay in mitigation, this share drops to a fifth. In other words, the target is not just more expensive to reach, but not reachable at all, given the current parameterisation of the models.
In addition, the AR5 scenarios have been under scrutiny for their deployment of CCS in conjunction with bioenergy. The 101 out of 116 scenarios leading to concentration levels of
430–480 ppm CO2-equivalent (CO2eq.) (considered to be con-sistent with a 66% probability of limiting warming to below 21C) require global net negative emissions between 2050 and
2100. About 50% of the scenarios feature BECCS exceeding 5% of primary energy supply.31
While these aspects of the IPCC scenarios have caused some people to doubt the feasibility of achieving the 21C target (e.g.
Peters53), the role of CCS and particularly BECCS become even more important in light of the increased level of ambition following the 2015 Paris COP.54
Towards 1.51C.What is currently available in terms of 1.51C IAM scenarios is much less than what is presented above on 21C from the IPCC’s AR5. This subsection draws on work from Rogeljet al.55and Ludereret al.,56which offer an assessment of what is currently available on 1.51C.¶¶
The most outstanding feature that systematically distinguishes the 1.51C from the 21C IAM scenarios examined in Rogeljet al.55is that there is not a single pathway with a 50% probability of achieving the target without overshooting it until 2100. That is, the average global temperature increase will at some point exceed 1.51C, before
returning to this level at the end of the century.
This implies that much of the CO2emitted in the first half of the century will need to be removed from the atmosphere again. In other words, emissions have to be negative at some point. Indeed, the analysis in Rogeljet al.55shows that there are no feasible 1.5 1C scenarios without negative emissions. In particular, the cumulative negative emissions are between 450 and 1000 GtCO2until 2100. This is in stark contrast to some 21C scenarios, which do manage to reach their target without carbon removals. Ludereret al.56point out that energy efficiency improvements can have this effect for 21C scenarios.
In the current IAMs, these negative emissions are primarily achieved by the deployment of BECCS.88 This has triggered
a discussion reflecting on large concerns not only about CCS (cf. discussion in Section 3.1), but also with respect to the implications of the large amounts of biomass that would be needed to achieve sufficient scales to reach the level of negative emissions needed for ambitious climate change mitigation. In an ex-post assessment of the amounts of negative emissions through BECCS in the IPCC’s AR5, Smithet al.61estimated the Table 1 Cumulative storage for three scenarios of (1) a stringent concentration target, (2) less stringent concentration target, and (3) stringent target with lower penetration of renewables (based on Koelblet al.33). The three model types considered are the hybrid models (synthesis of the technology and macro-economic approaches), macro-economic focussed models, and technology focussed models
Scenario
Model type
Hybrid Macro-focus Tech-focus
1 Cumulative storage 450 ppm 730–2411 GtCO2 — 353–1629 GtCO2
2 Cumulative storage 550 ppm 655–2962 GtCO2 1262 GtCO2 846–1686 GtCO2
3 Cumulative storage 450 ppm, limited renewables 625–2447 GtCO2 —— 1232–1366 GtCO2
‡‡The models currently only include BECCS and some of them afforestation.
Please refer to section for a discussion of this and to Table 2 for an overview of alternative negative emission technologies.
§§In contrast, limited nuclear and solar/wind availability only increased mitiga-tion costs by 7% and 6%, respectively.6
¶¶ It has to be noted that these scenarios are characterised by different prob-abilities than the 21C scenarios reviewed above, which means that the focus here should be on the qualitative results and not a direct comparison of numbers. 88There are a few that also consider large-scale afforestation, i.e. CO2 is sequestered in additionally grown vegetation.
Open Access Article. Published on 12 March 2018. Downloaded on 19/03/2018 15:21:11.
This article is licensed under a
range of land area, costs, water and nutrients footprints and biophysical effects. They find that, indeed, the areas of land, which would be needed, are large (380–700 Mha by 2100).***
Relating the primary energy of the biomass (in EJ) used in BECCS to the amount of CO2 stored geologically is complex. This relationship strongly depends on the choices made in the cultivation, harvesting, transport and utilisation of the biomass throughout the BECCS supply chain. Assuming that all of the CO2sequestered by the biomass is assumed to be released in the flue gas upon combustion, the amount of CO2sequestered per MJ of biomass would then depend on the capture rate applied at the BECCS facility, the biomass carbon content, the biomass heating value and the biomass carbon footprint. Considering a capture rate between 60% and 90%, a biomass carbon content between 45%dryand 50%dry, an HHVdrybetween 18 and 20 MJ kg1 (dry mass) and biomass carbon footprint between 0 and 36 gCO2 MJ1, the amount of CO2 sequestered would be found to be between 14 and 92 gCO2MJ1. One EJ of biomass could thus capture between 14 and 92 MtCO2per year, resulting in an annual requirement of between 130 and 860 EJ by 2100 to capture 12 GtCO2per year,63however, the total primary energy supply in 2100 is expected to grow to 1300–1800 EJ.64
Smithet al.61also point to other negative emission techno-logies, which could complement BECCS to alleviate the pressure on land that is also needed to feed a growing population, host biodiversity and many other ecosystem services. The dominance of BECCS in the current scenarios may be due to the fact that other options (see Table 2) are not included in the models. Incorporating other negative emission technologies could poten-tially lead to a lower uptake of BECCS, assuming that these other technologies are cost-competitive in comparison to BECCS, especially in scenarios limiting CCS and/or biomass use.
3.1.4 Outlook: the future of CCS in IAMs. As the IAM community is moving towards producing input for the Special Report on 1.51C – upon invitation from the UNFCCC – in order
to inform climate negotiations at COP23 in 2018 (and eventually the sixth assessment cycle), there are two developments, which could alter the role of CCS in their models.
The first is related to the above-mentioned concerns with respect to the high share of BECCS in low-stabilisation portfolios. More research along the lines of Smith et al.61 and Fajardy and Mac Dowell63 will help to shed light on the implications for other policy goals such as ensuring food security, as well as biodiversity and other ecosystem services. In addition, as can be seen in the adopted outline for the Special Report,65 climate change mitigation is closely embedded into a broader context of sustainable development, indicating that the new scenar-ios will also be designed to reflect a wider set of policy objectives.
The second development is the growing body of knowledge on other options for negative emissions and their interplay with what is currently included in the IAMs. There are already some IAMs that are experimenting with the integration of enhanced weathering66and direct air capture (DAC) is also an important candidate for integration into the IAMs despite current uncer-tainty on technical performance and cost.67
The main CCS research priorities in IAMs include:
More within-model studies to understand better the inter-actions between CCS characteristics and modelled deployment/ cumulative storage, which are difficult to discern in model intercomparisons.33
Update parameterisation with new insights from CCS research and demonstration.
Within-model studies also to better understand system dynamics.
Complement with geographically explicit techno-economic engineering approaches and geological suitability analysis to identify key areas for deployment and more realistic potentials.32,68
Explore scenarios considering technology choice depending on institutional barriers and social acceptance.
Include other negative emissions options (e.g. direct air capture, soil carbon sequestration, enhanced weathering) in addition to BECCS to decrease competition for storage capacity, and biomass (also other side effects, such as competition for land and water63).
Table 2 Other negative emissions technologies not included in IPCC AR5 scenarios, without claiming to be exhaustive
Technology Description
Direct air capture (DAC) Chemicals (e.g.amines or sodium hydroxide) are used to absorb CO2, which is then mineralised for solid storage, or is stored in geological formations.
Soil carbon sequestration
(SCS) Carbon soil sequestration is enhanced by increasing inputs or reducing losses (see Smith 57).
Biochar Through pyrolysis, biomass is made more resistant to decomposition and then added to the soil to store embedded carbon (see Smith57).
Enhanced weathering
(EW) Minerals like olivine that naturally absorb COthem absorb CO2more rapidly. 2are ground and spread out to increase their surface area and make Ocean fertilisation (OF) Iron can be used to make ocean phytoplankton absorb more CO2through photosynthesis, and then sink to the deep
ocean and sequester carbon after their death.
Indirect ocean capture Oceanic carbon uptake represents the largest sink for anthropogenic CO2, absorbing about 40% of CO2emissions from the atmosphere since the start of the industrial era.58The use of an efficient method for the extraction of CO
2(i.e. dissolved carbon) from seawater provides a method of CO2removal from the atmosphere, for example, using a pH swing with bipolar membrane electrodialysis59or electrolytic cation exchange units.60
*** For comparison, the land area of 380–700 Mha is equivalent to 53–97% of the total land used for cereal production worldwide (B720 Mha).62The land intensity of BECCS is 0.1–0.6 ha per tC,eqper year (energy crops and agricultural residues), requiring more land than other NETs,e.g., enhanced weathering requireso0.01
ha per tC,eqper year, direct air capture needso0.001 ha per tC,eqper year.61
Open Access Article. Published on 12 March 2018. Downloaded on 19/03/2018 15:21:11.
This article is licensed under a
Clearly, as ambitions become higher and action is further delayed, CCS will continue to play an important role in mitigation pathways. Broadening the portfolio of energy options to include CCS would improve the affordability of a near-zero emissions energy system.69 This is especially true in the case of combining it with bioenergy to generate negative emissions. Yet, especially with respect to negative emissions, many research gaps remain, which will need to be urgently addressed to keep this window of opportunity open.70
3.2 Integration of CCS into the electricity system
The following modelling assessment has been conducted in the context of the UK electricity system (i.e., uses data for the UK). There are a number of similar studies on the UK energy system which evaluate different scenarios.50,51,71–74Also, energy systems in the context of other countries have been evaluated, for example, the US,75,76Greece,77Poland,78or for Europe in general.79
3.2.1 Background.The UK is aiming to decarbonise the elec-tricity system.80,81To meet decarbonisation targets, the Committee on Climate Change (CCC) recommends that grid intensity in 2030 should be no more than 50 g kWh1 82to 100 g kWh1.83–85This will allow the partial decarbonisation of the heating and transport sectors
viaelectrification. The UK has also adopted the 20–20–20 targets proposed by the European Commission.86 This requires approxi-mately 30% of electricity to come from renewable sources by 2020 to achieve the UK’s overall target of 15% of primary energy from renewable sources,e.g., solar, wind and biomass, however, excludes nuclear and CCS.86,87This has led to a suite of policies that have subsidised the production of electricity from renewable sources. A significant proportion of this has come from intermittent sources such as wind and photovoltaic (PV). In financial year 2014/15, more than 50 TWh (representing 15% of the 340 TWh generated) was from intermittent renewable energy sources (IRES).88
It has been proposed that the UK could generate a very high proportion (if not all) its energy from IRES.89–91However, there are a number of issues that are likely to arise that could be expensive to solve or could ultimately limit the penetration of IRES. The three main factors that may constrain IRES deployment:
(1) IRES technologies do not displace firm capacity on a one for one basis, nor do they typically provide ancillary services such as inertia, frequency response, or reserve capacity;50
(2) Their intermittent output and the relatively unpredict-able element of their output demand more of these ancilliary services from the grid than conventional plants;50,51
(3) The highly correlated nature of the wind and sun across the UK means that at high penetration level, IRES output is weighted towards periods of surplus and away from times of system shortages. Consequently, the surplus causes wind out-put to be curtailed and become increasingly lower in value (market cannibalisation†††).92
Many studies have considered some of the costs that arise from integrating IRES.93However, in addition to cost, it is vital to include the above issues and consider the need to balance energy, whilst also considering the margin of firm capacity over peak demand and the provision of response, reserve and inertial services. Using the BERIC model,94 we provide some new analysis of these issues here.
3.2.2 Modelling the system.Input data on technology costs were based on the nth of a kind (NOAK) ‘‘medium’’ costs published by Parsons Brinckerhoff (PB) on behalf of the former Department of Energy and Climate Change (DECC)‡‡‡ in the
UK.95,96 Interest during construction was calculated at 10% assuming a linear spend and the discount rate was also set at 10%. Where different options exist within a technology class, the most cost effective was chosen. So ‘‘wind’’ is represented by onshore, CCS by post-combustion capture in gas power plants, and nuclear by pressurised water reactors (PWR).
The carbon price was set at d70 per tCO2 for most runs described here, except for some sensitivities run at d100 per tCO2. Captured carbon had a total burial cost ofd19 per tCO2to cover all downstream costs as in the reports by PB.95,96Other commodity costs were gas at 75 p per therm and biomass at d23.23 per MWh thermal HHV basis, making biomass-fuelled power plants slightly more expensive than a combined cycle gas turbine (CCGT) at full load.
Taking these inputs gave a full load cost of nuclear ofd87 per MWh which compares well with Hinkley’s nth of a kind strike price ofd89.50 per MWh.§§§97,98Onshore wind would
needd81 per MWh which again compares well with payments under the Renewables Obligation (RO) which came out at an average ofd84 per MWh in 2015/16.99 Note that the reported strike price for CCS varies fromd90 per MWh (gas-CCS in 2030) tod100 per MWh (coal-CCS in 2030).100However, if technology learning is taken into account, the cost of CCS may reduce to be d85 per MWh, enabling CCS to be competitive with other forms of clean energy.101
The availability profile for wind was based upon the genera-tion reported to Elexon during 2012102which, of the five years examined, had the most typical characteristics.¶¶¶ PV avail-ability was simulated using a curve rising from zero at sunrise to maximum at noon back to zero at sunset. This was randomly scaled by a factor between zero and 1 to represent the daily variability of insolation, and scaled again to give the expected
†††Market cannibalisation refers to the effect of decreasing market price that
occurs with increased production of intermittent renewable energy. The reduction in market price is due the following reasons: (i) highest production of wind and solar energy does not coincide with the peak electricity demand, and (ii) market value tends to reduce with increased market share.
‡‡‡In July 2016, the Department of Energy and Climate Change (DECC) merged with the Department for Business, Innovation and Skills (BIS) to form the Department for Business, Energy and Industrial Strategy (BEIS).
§§§The agreed strike price of 89.50 per MWh has been fully indexed to the Consumer Price Index. It also includes a price reduction benefit, which is based on the assumption that EDF Energy will distribute the first of a kind costs of the reactors across the Hinkley Point C and Sizewell sites. However, if EDF decides not to invest in Sizewell C, the strike price for Hinkley Point C alone will be 92.50 per MWh.97,98
¶¶¶ Examination of the profiles for the last five years showed that the profiles for 2012/13/14 were very similar in shape. However, 2011 had significant fluctuations (more peaks) and 2010 had substantially lower load factors. Thus, 2012 was chosen to represent a typical availability profile.
Open Access Article. Published on 12 March 2018. Downloaded on 19/03/2018 15:21:11.
This article is licensed under a
profile for monthly energies as predicted by the JRC online PV tool103for Birmingham.
Demand data was based on 2012 outturns corrected for the small proportion of wind which is embedded and assumed to generate in line with the majority of the portfolio. This calculated consumer demand was then scaled to match the peak energy demand for 2030, derived from the National Grid’s Slow Progression scenario,104 which gave an annual energy demand of 317 TWh.
Scenarios.The main modelling explored a matrix of scenarios covering all combinations of 9 levels of nuclear penetration (0–40 GW), 8 levels of wind (0–56 GW) and 7 levels of CCS (0–30 GW). For other technology, capacities were set at levels in National Grid’s ‘‘Gone Green’’ scenario for 2030.104 Further sensitivity analysis looked at varying the capacity of each of the 17 technologies in the model one by one away from the central scenario. In all cases unabated gas-CCGT was treated as the ‘‘slack variable’’, its capacity being adjusted to retain the same derated capacity margin over demand.
Methodology. BERIC is a linear program (LP), whose objec-tive function is to minimise short run costs at each scheduling point in the scenario run.94 A sample set of 220 half hour ‘‘points’’ are scheduled independently from each other. The model is constrained to stay within the following bounds:
(1) Energy demand must be balanced exactly by generation. Demand is given by the 2012 shape scaled to meet peak energy demand of the 2030 Slow Progression scenario.
(2) There must be sufficient reserve to meet the requirement at all times. BERIC meets a reserve demand that represents the requirements for frequency response and faster reserve products covering timescales of seconds and minutes. Wind and PV generation creates a demand for reserve cover at a rate of 17% of output (similar to typical values used by National Grid).94
(3) There must be sufficient inertia to meet the requirement at all times. It is assumed that inertia levels will be allowed to drop from the current minimum level of 150 GW s down to 90 GW s following recent changes to the grid code that improved tolerance to a higher Rate Of Change Of Frequency (ROCOF).
Generation is scheduled in fleets according to type, so the fleet of CCGTs is scheduled as one, all wind turbines as another
etc.However, the solver has freedom to assign any proportion of the fleet to one of four operating states (i) off, (ii) minimum stable generation, (iii) optimum level for providing spinning reserve, and (iv) full capacity. In effect, there are no quanta associated with individual units.
3.2.3 Decarbonising the electricity system
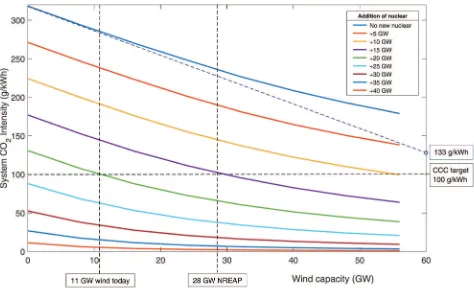
The effect of renewable energy. Fig. 4 shows the carbon intensity of the grid as a function of wind and nuclear capacity. Following the top blue line where no new nuclear (or CCS) is built, it can be seen that even with 56 GW of wind, CO2 emissions have only dropped to around 180 g kWh1. The curvature of the line indicates that further wind build suffers from diminishing returns as emissions reduce – i.e., the
available output of wind is increasingly ineffective at replacing fossil generation. This is due to curtailment when low carbon output exceeds demand. The ideal situation would be to have sufficient storage and/or demand side management to be able to make use of all curtailed output.51,74This is represented by the dotted blue line that is tangential to the initial blue curve. Even without output curtailment, CO2intensity is 133 g kWh1 at 60 GW wind capacity, greater than the 50–100 g kWh1target by CCC,83–85 which is needed to enable decarbonisation of other sectors through electrification.
The lower curves represent 5 GW increments of new nuclear build. It can be seen that with 20 GW of new nuclear then 100 g kWh1can be achieved with around 11 GW of wind. The National Renewable Energy Action Plan (NREAP) targets a wind build of 28 GW by 2020 (combined onshore and offshore capacity).105It can be seen that if this is accompanied by about 15 GW of nuclear then 100 g kWh1is achievable. It should be noted that other firm low carbon plant (such as biomass and CCS) could achieve similar results, albeit with slightly higher capacities to account for their residual emissions.
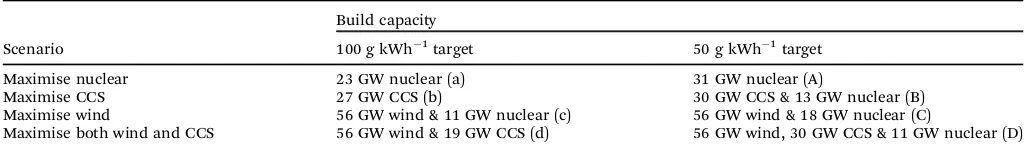
Need for low carbon firm capacity.Fig. 5 shows the carbon intensity with different levels of nuclear, CCS and wind in the grid mix. The two surfaces represent the target of 50 g kWh1 recommended by CCC for deep decarbonisation82and the UK’s Department of Business, Energy and Industrial Strategy (BEIS) central estimate of 100 g kWh1.72 Meeting either of these targets would mean the solution would have to lie on the visible side of the surface. For example, point A is the pure nuclear solution meeting 50 g kWh1, which corresponds to 31 GW of new nuclear. In the absence of gas-CCS at point C, 56 GW of wind is required, scaling back nuclear build to 18 GW. Adding gas-CCS is less effective at reducing emissions (it was modelled with 91% capture), so 30 GW will only displace 18 GW of nuclear build and achieve the same target grid intensity. This highlights the importance of considering the residual CO2 emissions. As decarbonisation targets become more stringent, there is the potential need for CO2 capture of 95% or more (Fig. 5),i.e.minimise/eliminate residual CO2emissions.
Table 3 summarises the various technology adoption path-ways that will meet the CCC targets for CO2intensity (based on results in Fig. 5). Adopting the weaker 100 g kWh1 target72,83–85 means a pure CCS (no wind, no new nuclear) solution is possible within the bounds modelled, at just 27 GW of gas-CCS. However, even with 56 GW of wind (‘‘maximise wind’’ scenario), a significant amount of firm low carbon capacity is required, either 11 GW of new nuclear or 19 GW of CCS.
3.2.4 The role of CCS
Inherent storage and flexibility of the capture plant.Carbon capture plants of nearly all designs have some additional opportunities (over an unabated plant) to store energy by time shifting energy intensive processes.106 For post-combustion, the amine regeneration could be scheduled at times of excess power enabling output to be boosted when required,107–113 which could provide reserve, response or firm capacity services.
Open Access Article. Published on 12 March 2018. Downloaded on 19/03/2018 15:21:11.
This article is licensed under a
Fig. 4 The CO2emissions in 2030 as a function of wind and nuclear build when unabated CCGT is used as flexible back-up.
Fig. 5 The CO2emissions as a function of nuclear, CCS and wind build. The surfaces show the technology deployment requirements in order to meet
the CCC targets for CO2emissions of 100 g kWh1and 50 g kWh1.
Open Access Article. Published on 12 March 2018. Downloaded on 19/03/2018 15:21:11.
This article is licensed under a
[image:12.595.61.535.46.335.2] [image:12.595.103.482.372.692.2]Similarly for oxy-fuel or pre-combustion capture, an oxygen buffer would allow the air separation unit (ASU) to run inde-pendently of generation so energy was not sapped at times of high export value (e.g., operate ASU during off-peak electricity demand).114,115
In a system with a growing proportion of generation from low running cost options, such as IRES, the value of energy is likely to decline, and the supply of some grid services and firm capacity is likely to be limited whilst demand for them grows. Therefore, it is important to consider the balance between IRES and different services (firm capacity, reserveetc.) at the design stage so the full value of a CCS plant can be accessed.
Value of CCS, nuclear and wind.Many studies focus on the cost of technologies that can help decarbonise a system and often divide a discounted cash flow with a discounted energy output to give a levelised cost of electricity (LCOE) in dper MWh. Although this approach has value for the comparison of a homogeneous set of thermal technologies providing a similar service (energy, firm capacity, reserve, response, inertia,etc.), it is no longer relevant when comparing technologies that deliver only a selection of these services, and nor does it account for the effects seen here where the effectiveness of a technology is strongly dependant on the existing grid mix.50,51,71,94,116
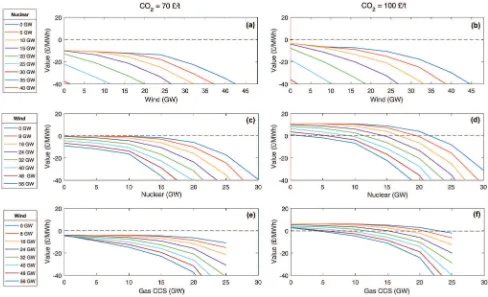
An alternative metric that works for all technologies is the value of technology addition (VOTA), also referred to as system value.51,116VOTA is defined here as the reduction in annualised total system cost with the deployment of a technology and is in units ofdper MWh of capacity deployed in a given year. Fig. 6 illustrates VOTA of various energy technologies for a number of different scenarios in 2030. For a higher carbon price, the value is generally higher (Fig. 6b, d and f), as might be expected. It can also be seen that the VOTA profiles have a similar shape, following a path of continuous additions of a technology eventually leads to an accelerating decline in the VOTA. If the system already has a significant amount of another low carbon technology, the drop-off in the VOTA will start earlier and decline faster. This has also been observed in some recent work by Heubergeret al.51The value of CCS is less affected by the addition of wind to the system than nuclear plant is (Fig. 6c–f). This is due to CCS having lower capital cost and greater flexibility compared to nuclear.
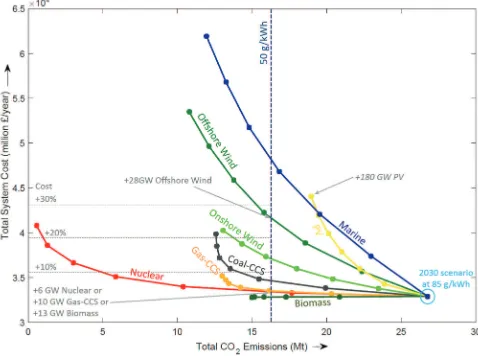
Competitor technologies. Fig. 7 shows all the generation technologies that were modelled, starting with a 2030 system that meets 85 g kW1by incorporating 10 GW of new nuclear, 5 GW of gas-CCS, 28 GW of wind and 20 GW of PV. The trajectories
for each technology represent the addition of more capacity. The left direction of Fig. 7 represents a reduction in emissions, whilst moving upwards corresponds to an increase in total system cost. Most technologies curve more steeply upwards as capacity is added (e.g.marine, PV, offshore wind), indicating the addition of cost whilst becoming increasingly less effective at reducing emissions. To achieve CO2emissions of 50 g kWh1, it would take an additional 28 GW of offshore wind, with an addition to total system cost of more than 25%. Adding nuclear would require 6 GW, whereas the addition of gas-CCS requires 10 GW, which results in an additional cost of 3–4%. Biomass moves directly left, indicating CO2emissions reduce at no additional cost.
The prediction of which technologies are cheapest is of course entirely dependent on the cost assumptions used. Although the absolute cost of a technology varies with the assumptions used, the curves have been independently shown to exhibit the same functional form. This demonstrates that there is a law of diminishing returns,94and that this effect tends to be more pronounced for intermittent technologies than firm capacity as with increasing deployment the former delivers energy during increasingly congested periods.51,74,94 In summary, the three classes of technologies that can make significant reductions in emissions with only a small increase in total system costs are: (i) CCS, (ii) nuclear, and (iii) bioenergy.888
3.2.5 What next for system integration?The decarbonisa-tion of the energy sector will inevitably increase the average cost of electricity generation. The selection of different technologies has a significant impact on the overall CO2intensity, value of technology addition and total system cost. It is increasingly recognised that decarbonisation targets (for both 50 and 100 g kWh1 grid intensity) cannot be achieved solelyviathe deployment of intermittent renewable energy (e.g., PV, wind). To balance the use of IRES in the system, firm capacity technologies are necessary for reliable low/neutral carbon electricity. The modelling of the UK system has shown that only fossil CCS, nuclear or bioenergy could take on this essential role. Some other systems will have additional options such geothermal, reservoir hydro power or even solar + energy storage in a predictably sunny climate. It is these low carbon technologies that will compete with CCS to provide firm capacity and not IRES technologies, which operate in a different market.
[image:13.595.41.554.71.146.2]The value added to the system by a certain technology is dependent on the existing energy mix and the services that the Table 3 Technology capacity deployment required to meet the CCC targets for CO2emissions of 100 g kWh1and 50 g kWh1. The alphabetical letters
in the parentheses corresponds to the points shown in Fig. 5
Scenario
Build capacity
100 g kWh1target 50 g kWh1target
Maximise nuclear 23 GW nuclear (a) 31 GW nuclear (A)
Maximise CCS 27 GW CCS (b) 30 GW CCS & 13 GW nuclear (B)
Maximise wind 56 GW wind & 11 GW nuclear (c) 56 GW wind & 18 GW nuclear (C)
Maximise both wind and CCS 56 GW wind & 19 GW CCS (d) 56 GW wind, 30 GW CCS & 11 GW nuclear (D)
888Assuming that the embodied energy in the biomass supply chain are not themselves great.
Open Access Article. Published on 12 March 2018. Downloaded on 19/03/2018 15:21:11.
This article is licensed under a
technology can provide (e.g., inertia, reserve, firm capacity). Thus, a single number such as the LCOE cannot be used to characterise the performance of a technology. Similarly, value assessment of a single technology in isolation is inadequate. A whole systems approach to valuing technologies and their impact on total system cost would recognise the role of low-carbon technologies in balancing demand and cost. Such an approach would enable better characterisation (e.g.availability, controllability, economic benefit) of different generation technologies within a given energy mix.
3.3 Industrial CCS
A significant proportion of GHG emissions can be attributed to industrial processes,6 contributing 25% of the global CO
2 emissions.119 Thus, decarbonisation of the industrial sector will be essential to meet the CO2 emissions targets by IPCC.6 Some key industrial sectors that have been the focus of CCS studies include cement, petroleum refining, iron and steel manufacturing, and pulp and paper,120,121with iron and steel, cement and refining being especially ‘‘high-emitting’’,119 together consuming 38% (43 EJ) of total industrial energy consumption.122CCS is regarded as a cost effective option to reduce CO2 emissions from industrial processes.119,123 The physical properties, composition and gas volume flows are different for each industrial process.124Thus, the suitability and selection of a CCS technology would depend on these stream properties, e.g., CO2 concentration, moisture content.125–127 The
challenge for the industrial sector will be maintaining international competitiveness with the implementation of technologies that reduce CO2emissions, but increase costs.128
3.3.1 Decarbonisation of the iron and steel industry. The industrial sector with the largest CO2emissions is the iron and steel industry, accounting for 31% of all industrial emissions.123 Steel production generates high levels of CO2emissions due to: (i) being energy intensive, (ii) the dependence on using coal, and (iii) the significant volumes of steel being manufactured.118The two main steel manufacturing processes are:
Integrated steel mills, which uses the blast furnace-basic oxygen furnace (BF-BOF) process. Coke is used to reduce the iron ore in the blast furnace to form ‘‘pig iron’’, which is then converted to liquid steel in the basic oxygen furnace (with an addition ofB30% scrap steel).118
Mini-mills using an electric arc furnace process and a feedstock consisting of scrap metal, direct reduced iron (DRI) and cast iron.118
The larger integrated steel mills are the main source of emis-sions and on average emit 3.5 Mt of CO2 annually, whereas the smaller mini-mill plants each emito200 kt of CO2annually.120,121
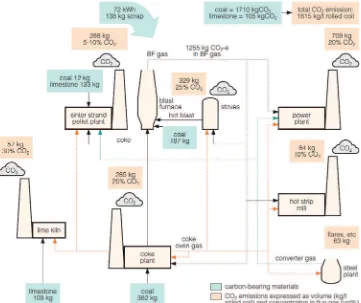
The average CO2 emissions from a typical steel mill is about 1.8 tCO2per tonne of crude steel, where the major carbon sources are from coal and coke (1.7 tCO2) and limestone (0.1 tCO2).117Fig. 8 shows that there are multiple sources of the CO2emissions within a steel mill process. Of these, the stream from the blast furnace contributes the greatest direct CO2emissions (69%).117However, Fig. 6 Value of technology addition (VOTA) or system value of building of wind, nuclear and gas CCS technology.
Open Access Article. Published on 12 March 2018. Downloaded on 19/03/2018 15:21:11.
This article is licensed under a
[image:14.595.53.541.48.345.2]this flue gas is not directed to a stack, but instead, the energy in the gas is recovered in the on-site power plant.118
The cost of CO2 capture in the iron and steel industry is dependant on the type of technology and the location within the process. Most of the research has focussed on applying CO2 capture in the blast furnace. Post-combustion capture from the BF has been estimated to cost between $65.1–119.2 per tonne of CO2 avoided, capturing 50–55% of emissions.129–131 A top-gas recycling blast furnace using post-combustion capture can capture 65% of emissions at $54–88 per tonne of CO2avoided.132The mean cost to capture 65% of total emissions from the blast furnace is $76.6 per tonne of CO2avoided. Post-combustion capture from the coke oven will cost an average of $86.4 per tonne of CO2 avoided (27% of total emissions).121
In the short term, minimising energy consumption and improving energy efficiency is the most cost effective approach to reducing CO2 emissions.133–137 Some of the measures used to improve energy efficiency include heat loss reduction, heat recovery of waste energy, and efficient process design.133,137Over the years, there have been efforts to reduce CO2emissions from the overall production process, such approaches include increased recycling
of steel scrap, use of biomass or renewable energy, utilisation of by-product fuels to reduce the use of coke and coal.118
The implementation of CCS technologies could further significantly reduce CO2 emissions. In integrated steel mills, it is possible to capture CO2from the flue gas exiting the lime kiln, sinter plant, coke oven plant, stove, blast furnace and basic oxygen furnace. In the case of mini-mills, the main source of CO2would be the electric arc furnace.130Post-combustion capture technology can be applied to these gas streams without affecting the iron and steel making process. Alternatively, an ‘‘in-process’’ capture process could be employed, merging the iron/steel making and the CO2 capture processes.117,138 One such strategy is to use oxy-combustion conditions in the BF to produce flue gas of high CO2 concentration, which would enhance CO2capture efficiency.117Some commercial iron and steel facilities employ CO2capture and removal as part of the production process, however, the CO2 is currently flared. For example, CO2is captured as part of some DRI facilities,118the Saldanha steel plant in South Africa,139the Finex process (South Korea)140and HIsarna process (Germany and Australia).141,142To prevent this CO2from being emitted to atmosphere, integration of CO2storage would be necessary.
Fig. 7 Effect of adding new technologies in 5 GW increments from a 2030 central scenario at the origin.
Open Access Article. Published on 12 March 2018. Downloaded on 19/03/2018 15:21:11.
This article is licensed under a
[image:15.595.57.535.53.409.2]In November 2016, the world’s first large-scale application of CCS in the iron and steel sector commenced operation as part of the Emirates Steel Industries (ESI) CCS Project (Phase 1 of the Abu Dhabi CCS Project).119,143The system uses an amine-based absorption process with a capture capacity of 0.8 Mt of CO2 per year. The CO2is subsequently transported through a 43 km onshore pipe to be injected for enhanced oil recovery (EOR) and stored.143
3.3.2 Decarbonisation of the cement industry.After clean water, mankind produces a greater volume of concrete than any other product,144and considering that each tonne of cement used within it causes the emission of around 880 kg of CO2145 (depending upon the method of production, between 600 and 1000 kg146), it is unsurprising that more than 5% of global CO
2 emissions are caused by its manufacture.147 Approximately 60% of CO2 emissions from cement production arise from the calcination of limestone (CaCO3) to form CaO (the main precursor for cement production),146with the remaining emis-sions from the process being from the fuel used to heat the kiln and effect the clinkering reactions. Both sources of CO2can be treated at the same combined stack. The intrinsic emissions of CO2, which are part of the production process, mean that in order to make the scale of emissions cuts necessary to limit anthropogenic warming to 21C, CCS is a prerequisite.148
There are a number of different CCS technologies that are applicable to cement production; there are several variants of post-combustion CO2 capture, including solvent scrubbing or
the use of solid sorbents, calcium looping, oxy-fuel and ‘‘direct capture’’.145 In this context, the most obvious difference between cement production and power generation is that pre-combustion technologies are not applicable. This is because of the large quantity of process-related emissions from calcination of limestone that are not captured when pre-combustion is applied. The technologies are in general (with the exception of direct capture) conceptually similar to their counterparts in power generation, though it is notable that calcium looping utilises one of the feed stocks for cement production (CaO) as its main sorbent; this leads to significant synergies between the cement process and Ca looping. Direct capture has no obvious analogue; it utilises indirect radiative heating of the limestone-containing raw meal feed to the system to ‘‘directly’’ produce a pure stream of CO2. Both direct capture and oxy-fuelled systems have the potential for efficiency gains within the system, owing to either thermodynamic benefits (direct capture) or a reduction in the total amount of thermal ‘‘ballast’’ in the system by eliminating the nitrogen from air.
The key issue for cement CCS is to ensure that the quality of the product remains the same after the CCS system has been applied. This is the main advantage for a scrubbing system based on post-combustion capture using alkanolamines (or other sorbent-based system). Unfortunately, cement plants are not in general endowed with sufficient low-grade heat to (without the addition of a CHP plant) allow capture of more than around 50% of the CO2produced in a cement plant.145,149 Fig. 8 A typical steel mill and the CO2emissions, which vary in concentration.117,118
Open Access Article. Published on 12 March 2018. Downloaded on 19/03/2018 15:21:11.
This article is licensed under a
[image:16.595.119.480.49.352.2]