Contents lists available atScienceDirect
International Journal of Pharmaceutics
journal homepage:www.elsevier.com/locate/ijpharm
Engineering of acetaminophen particle attributes using a wet milling
crystallisation platform
Bilal Ahmed
a,b, Cameron J. Brown
a,b, Thomas McGlone
a,b, Deborah L. Bowering
a,b, Jan Sefcik
a,c,
Alastair J. Florence
a,b,⁎aEPSRC Future Manufacturing Research Hub for Continuous Manufacturing and Advanced Crystallisation (CMAC), University of Strathclyde, Technology and Innovation Centre, 99 George Street, Glasgow G1 1RD, United Kingdom
bStrathclyde Institute of Pharmacy and Biomedical Sciences (SIPBS), University of Strathclyde, 161 Cathedral Street, Glasgow G4 0RE, United Kingdom cDepartment of Chemical and Process Engineering, University of Strathclyde, James Weir Building, 75 Montrose Street, Glasgow G1 1XJ, United Kingdom
A R T I C L E I N F O
Keywords: Wet milling Crystallisation Breakage
CLD to PSD inversion Particle size Surface heterogeneity
A B S T R A C T
Wet milling coupled with crystallisation has considerable potential to deliver enhanced control over particle attributes. The effect of process conditions and wet mill configuration on particle size, shape and surface energy has been investigated on acetaminophen using a seeded cooling crystallisation coupled with a wet mill unit generating size controlled acetaminophen crystals through an interchangeable rotor-tooth configuration. The integrated wet milling crystallisation platform incorporates inline focused beam reflectance measurement (FBRM) and particle vision measurement (PVM) for in-depth understanding of particle behaviour under high-shear conditions. We used a recently developed computational tool for converting chord length distribution (CLD) from FBRM to particle size distribution (PSD) to obtain quantitative insight into the effect of the com-peting mechanisms of size reduction and growth in a wet milling seeded crystallisation process for acet-aminophen. The novelty of our wet milling crystallisation approach is in delivery of consistent surface energies across a range of particle sizes. This highlights the potential to engineer desirable particle attributes through a carefully designed, highly intensified crystallisation process.
1. Introduction
Crystallisation is a widely used technique for purification and im-parting control of the physical properties of molecular solids including pharmaceuticals, agrochemicals, dyes, pigments as well as other func-tional materials. Within pharmaceutical manufacturing, an important goal is to design the required crystallisation process to deliver robust control over particle properties (form, purity, size, shape, mechanical) to ensure consistent performance (Baxendale et al., 2015; Beckmann,
2013). Theflexibility of batch crystallisations and ease of operation for pharmaceuticals &fine chemicals is widely established both in research and industrial settings (Fujiwara et al., 2002; Pérez-Calvo et al., 2016; Saleemi et al., 2012). However there is an increasing interest in the application of continuous processing technologies using continuous crystallisation in pharmaceutical manufacturing as a means to control crystal properties and deliver consistent particulate products (Badman and Trout, 2015; Brown et al., 2017; Lawton et al., 2009; Mascia et al., 2013). Whilst widely used in the production of large volume
https://doi.org/10.1016/j.ijpharm.2018.10.073
Received 29 August 2018; Received in revised form 27 October 2018; Accepted 30 October 2018
Abbreviations: Acr, Area of collision on rotor tooth; API, Active pharmaceutical ingredient; BET, Brunauer, Emmett and Teller equation; CE, Circle equivalent diameter for particle size measurement; CLD, Chord length distribution; CSTR, Continuous stirred tank reactor; DVS, Dynamic vapour sorption; ESI, Electronic supplementary information; FBRM, Focused beam reflectance measurement; FDA, Food & drug administration;fsr, Shear frequency;Hr, Rotor height; iGC-SEA, Inverse gas chromatography surface energy analyser; MSMPR, Mixed-suspension mixed-product removal;N, Avogadro’s constant; n, Volume of gas adsorbed at standard temperature and atmospheric pressure; n/nm, Number of moles adsorbed onto the monolayer sub-coverage;NG, Number of generators;NR0, Number of outer teeth located on rotor tooth;NS0, Number of outer teeth located on stator tooth;NST, Number of slurry turnovers; PAT, Process analytical technology; PBM, Population balance model; PFR, Plugflow reactor; PSD, Particle size distribution; PVM, Particle vision measurement;P, Partial vapour pressure of adsorbate gas in equilibrium with the surface at 77.4 k;P0, Saturated pressure of adsorbate gas, in pascals;Q̇, Volumetricflow rate through wet mill; SEM, Scanning electron microscope; STC, Stirred tank crystalliser;Sr, Rotor tip speed;τ, Residence time; WMSC, Wet milling seeded crystallisation;Wr, Rotor width;γSV
d, Dispersive surface energy;φr, Relative weighting factor
⁎Corresponding author at: EPSRC Future Manufacturing Research Hub for Continuous Manufacturing and Advanced Crystallisation (CMAC), University of
Strathclyde, Technology and Innovation Centre, 99 George Street, Glasgow G1 1RD, United Kingdom. E-mail address:alastair.fl[email protected](A.J. Florence).
Available online 31 October 2018
0378-5173/ © 2018 The Authors. Published by Elsevier B.V. This is an open access article under the CC BY license (http://creativecommons.org/licenses/BY/4.0/).
commodity chemicals, there is increasing number of industrial ex-amples and support from regulatory authorities including the FDA in demonstrating the potential value of continuous crystallisation in the supply of medicines and other high value chemicals (Chatterjee, 2012; Srai et al., 2015; Yang et al., 2017).
Recent integration of wet media milling technologies particularly rotor-stator devices, have been shown to avoid common issues en-countered with traditional dry milling units. These include introduction of crystal lattice disorder, undesired polymorphic and amorphous transformations, broad bimodal particle size distributions, loss of yield and process control as well as increased energy cost (Anderson, 2012; Kim et al., 2003; Variankaval et al., 2008). They can be applied in an array of process configurations such as in a recycle-loop mode with integrated PAT showing controlled crystal size reduction in suspensions even with the occurrence of competing phenomena such as primary & secondary nucleation and multiple breakage mechanisms (Cote and Sirota, 2010; Lee et al., 2004; Yang et al., 2016). Mass fracture is a common breakage mechanism in wet milling which is usually under-stood as rapid crystal size reduction of the primary particle (Donovan, 2003).
There are a range of fundamental mechanisms that have been pro-posed to describe secondary nucleation in suspensions of crystals (Agrawal and Paterson, 2015; Botsaris, 1976; Garside and Davey, 1980). Kamahara (Kamahara et al., 2007) demonstrated the dominance of secondary nucleation through a semi-batch crystallisation process with the aim of generatingfine particles both at laboratory and pilot scale in wet milling. Yang (Yang et al., 2015) applied a high shear wet mill as an upstream & downstream nucleating device for acet-aminophen crystallisation. Analysis of start-up, yield index and size distribution on a continuous mixed suspension mixed product removal (MSMPR) crystalliser with PAT was investigated to which secondary nucleation was predominant when used in a downstream recycle
con-figuration. The practical ease of incorporating the recycle method was further demonstrated on a 3-stage MSMPR for a seeded cooling crys-tallisation workflow development via Brown (Brown et al., 2018). The number of continuously generated seeds allowed for the crystallisable product mass to be targeted and optimised via an integratedflowsheet produced in gCrystal 4.2.0where secondary nucleation kinetics were modelled explicitly. Further characterisation and population balance modelling of wet milling facilitating nucleation and breakage kinetics have also been implemented (Acevedo et al., 2017; Luciani et al., 2015; Szilágyi and Nagy, 2018; Yang et al., 2016). However, complete de-coupling of mechanisms in wet milling-crystallisation processes is yet to be extensively investigated.
In addition, several studies have outlined scaling expressions for geometrical characterisation of wet mills. Harter (Harter et al., 2013) constructed a slot event model through predicting milling time to achieve a target particle size whereby the frequency and probability of a slot event within a Quadro Ytron HV wet mill was modelled. Engstrom (Engstrom et al., 2013) introduced an energy dissipation rate (E*) model for particle size reduction in toothed rotor-stator wet mills across process scales by accounting for the mechanistic framework of the wet mill. More recently, Luciani (Luciani, 2018) correlated the relative critical particle size and relative cumulative energy imparted to the particles for breakage analysis and particle size prediction through construction of a master curve for several organic materials. Whilst considerable attention has been focused towards particle change during a milling process, understanding the effect of toothed rotor-stator wet milling on surface properties such as surface energy distributions and surface areas are yet to receive wider attention (Ho et al., 2012; R Williams, 2015). A particular study from Luner (Luner et al., 2012) found the impact of high shear wet milling to increase surface energies of sucrose and succinic acid when compared to dry milling and crys-tallised material however a definitive rationale for the observed effects has yet to be developed.
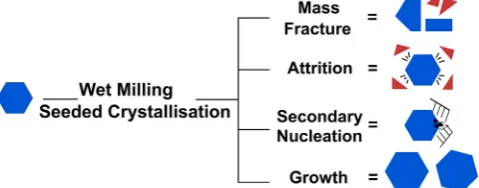
In this study, an investigation of the relationship between process
parameters and product attributes is presented for acetaminophen using a semi-continuous wet milling seeded cooling crystallisation process (Fig. 1). Utilising a toothed rotor-stator wet mill, selected teeth
con-figurations (coarse, medium, fine and multiple-stage) were operated from low to high rotational speeds (rpm). Constant inline PAT (process analytical technology) monitoring of chord length distributions (µm) with offline volume weighted circle equivalent diameter [4,3] (µm), aspect ratio and circularity was assessed simultaneously at various milling turnovers. Chord lengths (μm) from FBRM were inverted to provide an estimation of inline particle size distribution (PSD) at spe-cified milling times through an in-house inverse algorithm method (Agimelen et al., 2015; Agimelen et al., 2018a, 2018b). Agglomerated bimodal seeds which are commonly produced by standard offline seed generation techniques, was the input material to test for the overall robustness of the process to deliver narrowing of the particle size dis-tribution throughout. This work to our knowledge is thefirst study to test this process as well as variability in wet mill teeth and speed (rpm) arrangement on material surface properties through measurement of surface areas and surface heterogeneity.
2. Experimental section
2.1. Materials and methods
The model compound studied for this system was acetaminophen which is a widely known analgesic and antipyretic compound. It was purchased fromSigma-Aldrich(98–102%). 2-propanol (reagent grade, CAS: 67-63-0, Assay (GLC) > 99.5%) was purchased from Fisher Scientific,UK. Distilled water was used for all experiments. AMettler Toledo OptiMax™workstation consisting of a 1 L stirred tank crystalliser (STC) equipped with an inline Hastelloy®Pt100 temperature sensor was used for all experiments with the system controlled and operated through theiControlv5.4 software. The followingMettler Toledoinline process analytical technology tools used for each of the experiments were:FBRMprobe (G400series) for particle tracking and chord length distribution by laser back-scattering (iC FBRMV4.3) and aPVMV819 probe with online image acquisition software V8.3 included. AnIKA MagicLab (Module UTL)wet mill unit was used for the inline milling process. Mill outlet temperature was monitored on the IKA operating unit display. Rotational speeds were operated from 6000 to 18000 rpm, with varying teeth configurations investigated across coarse, medium andfine rotor-stator tooth pairs as well as a multiple-stage confi gura-tion incorporating all three (coarse, medium,fine). The temperature of the wet mill chamber was manually controlled during milling to match the temperature of the feed solution within 1 °C throughout cooling.
2.2. Seed preparation
[image:2.595.313.553.62.156.2]Seed crystals of raw acetaminophen used for the experiments were prepared through an offline vibratory ball mill (Griffin & George) and
Fig. 1.Schematic highlighting potential mechanisms involved when operating
sieved (Fritsch analysette 3 type) approximately into the required size fraction; 25–63 (μm). This fraction was used for all experiments.
2.3. Particle size and shape characterisation
For offline sample analysis, a Malvern Morphologi G3 (Malvern Instruments Ltd, Malvern, UK) was used for both particle size and shape measurements (×10, 0.5–1000μm). Samples were prepared using a high energy dry dispersion unit requiring 5 mm3 of recrystallised acetaminophen. Particle properties were then measured as responses ranging from volume weighted circle equivalent diameter [4,3] (µm), aspect ratio and circularity of the milled compound. Both a high and low energy dispersion method was used for characterising the seed crystals. Offline particle size distribution data was further processed to give a density distribution on the ordinate axes; a probability density distribution (PSD) was plotted against volume weighted circle equiva-lent diameter [4,3] (μm) to give afinal offline particle size distribution.
2.4. Scanning electron microscope (SEM)
SEM images of obtained samples were recorded in backscattered mode at a beam voltage of 900 V using a U9320B Field Emission Scanning Electron Microscope (Keysight, USA). Sample preparation in-volved mounting the samples on aluminium stubs using a carbon tape and coating with a 10 nm gold layer using an EM ACE 200 sputter-coater (Leica Inc., Germany).
2.5. Surface energy characterisation
An iGC-SEA (Surface Measurement Systems Ltd, London, UK) system was used for surface energy andBrunauer, Emmett, Teller(BET) specific surface area analysis. Acetaminophen powder (∼800 mg) from the milled product on starting seeds was packed into an iGC glass column (3000 × 4 mm ID) with silanised glass wool inserted at each end. Duplicate columns were prepared for all samples. Helium was used as the inert carrier gas at aflow rate of 10.0 standard cubic centimetre per minute for all injections. First the BET specific surface area was cal-culated( / [P n P0−P])for each sample using octane as the adsorbate and
each target fractional surface coverage( /n nm) assigned between the
minimum and maximum coverage (P/P0 range 0.05–0.35). Then, a
series of purely dispersiven-alkane vapour probes all of high purity, HPLC-grade solvents (undecane, decane, nonane and octane) were in-jected at different concentrations and a target fractional coverage area from 0.005 to 0.2. This allowed the dispersive component (γd) at a given surface coverage ( /n nm) to be determined for all the samples
using the net retention volume (VN) at specified target coverage by the peak maximum parameter. Using all non-polar solvents, the surface heterogeneity of the samples was determined by calculating the dis-persive surface energy(Y )SVd of acetaminophen according to the Dorris-Gray peak max method using the surface measurement systems ad-vanced analysis software (V.1.4.2) (Doris and Gray, 1980; Kondor et al., 2015). Each sample produced a standard error ranging from 0.2 to 2.2%. A detailed background review to deriving the surface energy descriptor can be found from numerous sources (Kondor et al., 2015; Newell et al., 2001; R Williams, 2015).
2.6. Wet milling seeded crystallisation process
[image:3.595.311.554.78.280.2]A seeded cooling crystallisation process was selected using ca. 1.84% seed loading, solution starting concentration 179.6 g/1000 g of 2-propanol and a constant cooling profile from 35 °C to 10 °C over 3 h. The rationale for the selected conditions was to maximise crystal growth within the metastable zone width by adding low seed mass of high surface areas at high concentrations (Table 1, Fig. 2). A slow cooling profile was employed to promote growth and avoid any un-desired nucleation events. To monitor the impact of wet milling
Table 1
Seed characterisation and conditions used for all experiments.
Seed mass (g) 2.24
Seed size (Dv50,μm) 30.49
Seeding supersaturation 1.18
[image:3.595.327.538.323.710.2]Seeding concentration (g/1000 g solvent) 182.60
Fig. 2.Temperature dependent solubility profile for acetaminophen in
2-pro-panol (Hojjati and Rohani, 2006) with the experimental trajectory and key process step annotated. Seed conditions are shown inTable 1.
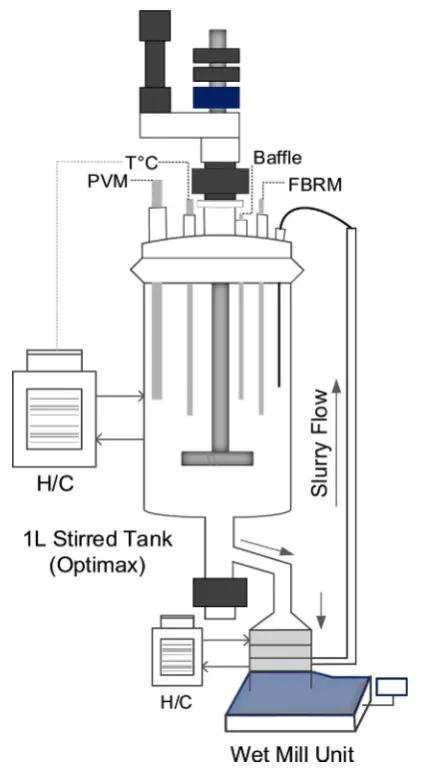
Fig. 3.Experimental apparatus consisting of a baffled crystalliser vessel
mechanisms and its performance as a continuous device, the crystal-lisation was then operated whilst simultaneously wet milling the sus-pension under different rotor-stator teeth configurations and rotational speeds (rpm) from low to high through a recycle-loop mode (Figs. 2 and 3).
A normalised energy dissipation rate E∗ resulting from the wet milling geometry for predicting particle size was calculated from in-corporating the rotor tip speedSr and shear frequency fsr (Engstrom
et al., 2013):
=
E* φ Er. r (1)
= E S S r r rb 2 2 (2) =
φ NR NS ω
NR NS ω
N N Q
N N Q
W H W H . . . . . . / ̇ . / ̇. . . r O O
Ob Ob b
ST G
STb Gb b
r r
rb rb (3)
Here subscriptbrepresents the reference case where experimental va-lues are obtained and normalised to andEr is the relative energy term which considers the kinetic energy of the rotor tooth collision with particles in slurry. The relative weighting factor φrincludes the shear frequency fsr, residence timeτ and area of collision on the rotor tooth Acr. For shear frequency fsr, the number of outer teeth located on the rotorNROand statorNSOtooth as well as the angular rotational speedω were measured. Hence, shear frequency fsr expands on rotor tip speed Sras the outer diameter of the rotor tooth and angular rotational speed are included. Residence timeτ includes the slurry turnoversNST, the number of generatorsNGand the volumetricflow rate through the wet millQ̇. Measured widthWrand heightHrof the rotor is included in the area of collisionAcrterm. A more detailed description to the normalised energy dissipation rateE*model can be found (Engstrom et al., 2013). Acetaminophen (120 g) was added to 2-propanol (669.5 g) within the OptiMax 1 L vessel. FBRM and PVM were integrated within the vessel. The cooling profile was based on the temperature dependent solubility of acetaminophen in 2-propanol (Fig. 2) (Hojjati and Rohani, 2006). The solution was prepared by heating the mixture to 50 °C over 15 min with the agitator set to 600 rpm. After a further 30 min the solution was then slowly cooled to 35 °C over 15 min. Seed crystals (size fraction of 25–65μm) were prepared in a separateflask and added to the vessel as a slurry suspension (2.24 g/1.84%,Fig. 3). An additional 30 min hold period at 35 °C was carried out to allow seed dispersion. A linear cooling profile (0.13 °C/min) over 3 h was then implemented down to 10 °C with wet milling occurring simultaneously during this cooling period. A further hold period from 30 min to 1 h at 10 °C was carried out. The recrystallised product suspension was then filtered (90 mm mean diameter) using a Büchner funnel, washed with chilled distilled water and dried overnight (40 °C) in a vacuum oven.
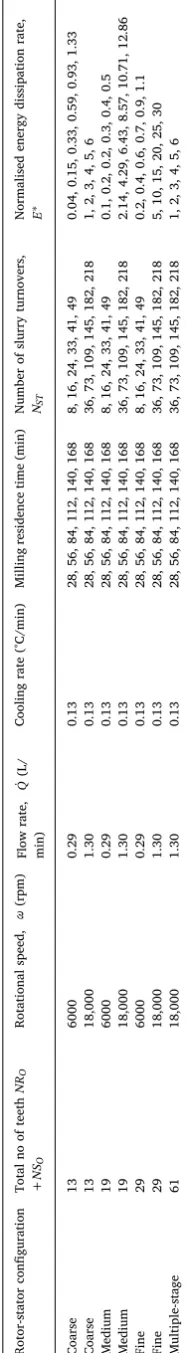
Experimental runs tested different rotor-stator configurations in-cluding the number of teeth (coarse, medium andfine) and rotational speeds (Table 2). The total number of outer teeth on the rotor and stator ranged from 13 to 61 which only considered the outer teeth. TheE∗ model considers the combination of generators within the mill setup to consist of one generator as additional generators simply increases the residence time in the wet mill chamber with the imparted energy being the same from one generator to the next. Samples were taken for the majority of the experiments at different milling residence times (min) consisting of every 28 min as each set of conditions was dependent on the number of slurry turnoversNSTand the volumetricflow rate Q̇. As no separate pump was used in the recycle-loop to avoid process com-plexity, the wet mill rotational speed provided continuous recirculation of the suspension and can be selected to match the volume to pumping ratio (Fig. 3). The volumetricflow rateQ̇was calculated from the wet
mill rotational speed and the suspension volume (Table 2). A relatively highflow rate of 1.30 (L/min) was achieved for the selected 18000 rpm speed in comparison to 0.29 (L/min) at 6000 rpm. For the decoupling experiments, a seeded cooling crystallisation experiment with no mill Table
[image:4.595.329.423.58.738.2]was carried out using the same concentration and cooling profile as well as seed mass and size. Two saturated wet milling experiments under the same process configurations were also conducted atfixed temperature with no cooling profile implemented (Table 3).
3. Results and discussion
3.1. Particle size and shape analysis
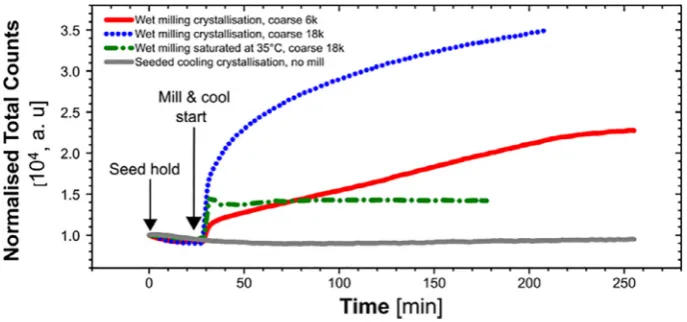
To control the behaviour of cooling crystallisation, seeding with existing crystals of the parent form allows greater reproducibility of the desired product attributes such as PSD (Aamir et al., 2010). However, often poor seed qualities such as bimodality and agglomerated seeds are commonly introduced into crystallisation processes making it difficult to control and deliver a monodisperse PSD of thefinal product. One method to overcome this is to integrate a wet mill to deliver tightening of the PSD over time and increase nucleation kinetics of slowly nucle-ating compounds as shown inFig. 4.
3.1.1. Cooling crystallisation, no mill
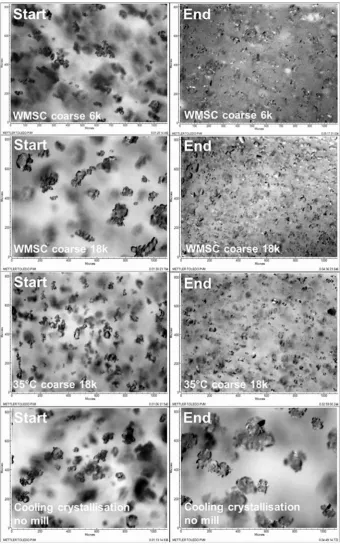
FromFig. 4, initial data captured via an FBRM probe displays nor-malised total particle counts as a function of time from the conducted experiments. A seeded cooling crystallisation process without wet milling with the same seeding conditions and cooling profile was im-plemented. This was to observe the growth behaviour of acet-aminophen in 2-propanol. For this experiment, total counts increase very slowly over time in contrast to other observed trends when wet milling is coupled (Fig. 4). This indicates the crystallisation to be of a slow growing system with agglomeration occurring as observed from the PVM images (Fig. 5). Ultimately, this results from agglomerated seeds introduced which leads to a broadfinal PSD (Fig. 7B). Therefore secondary nucleation, breakage or de-agglomeration is likely to be in-significant from this experiment.
3.1.2. Saturated 35 °C, coarse 18 k rpm
The wet mill was now coupled to the stirred-tank with a seeded suspension being continuously recycled at constant temperature to decouple the effect of crystallisation. This was to primarily identify the mechanisms arising from wet milling only. For the saturated coarse 18 k at constant temperature of 35 °C had shown a significant impact on the
total counts (Fig. 4). Here, the dominant effect of mass fracture after mill start-up is clearly observed with de-agglomeration of the seed particles. The effect of mill start leads to an immediate sharp increase in total counts (5–10 min,Fig. 4) resulting in rapid size reduction within 30 min of milling as seen from the immediate shift from inline particle size distributions (Fig. 6C). The total counts then reached an almost steady-state value (Fig. 4) for the remainder of the experiment as no additional mechanisms are believed to be occurring which can be fur-ther noticed from the matching inline PSD trends for 1 hr and end milling periods (Fig. 6C). Hence no increase or decrease in particle size occurred. For this decoupling experiment, mass fracture and de-ag-glomeration are therefore predominant.
3.1.3. WMSC, coarse 6 k rpm & coarse 18 k rpm
Examining two selected WMSC at low and high rotational speeds (rpm) (Fig. 4, coarse 6 k & 18 k) introduces additional mechanisms with the most significant being secondary nucleation. Total count trends and inverted chord length distributions (Fig. 4,Fig. 7A & B) indicate that milling the suspension under supersaturated conditions during cooling gives rise to a significant reduction in mean particle size with an ac-companying increase in the number of counts, largely due to mass fracture and de-agglomeration during the initial 30 min of mill start. This immediate breakage and de-agglomeration of the starting seed particles is simultaneously observed from the significant inline particle size distribution (μm) shift (Fig. 6A and B) and is clearly seen from the PVM images (Fig. 5). Total counts display sharp increases within 20 min of starting the mill after which they approach constant values (Fig. 4). Larger counts decrease rapidly over time as a result of mass fracture due to interaction of the largest particles with the mill teeth (Figs. S3 and S4 ESI). The gradual levelling of the total counts during the latter stages of milling is attributed to the completion of the initial mechanisms and depletion of larger particles remaining in the system, withfines gen-eration still evident (< 10μm,Figs. S3 and S4 ESI) due to milling and secondary nucleation (Kamahara et al., 2007; Yang et al., 2015). In-terestingly during the WMSC process, mass fracture followed byfines generation whereby attrition of particles producesfines growing under the influence of supersaturation results in observed particles. During the saturated milling experiment at 35 °C, mass fracture is followed by no detectablefines generation as the attrition mechanism is creating
[image:5.595.38.550.81.122.2]fines subsequently not growing to a point observable without the Table 3
Investigated parameters for saturated wet milling experiments at constant temperature.
Rotor-stator configuration Total no of teethNRO+NSO Rotational speed, ω(rpm) Flow rate,Q̇(L/min) Temperature (°C) Concentration (g/1000 g solvent)
Coarse 13 18,000 1.3 15 97.80
Coarse 13 18,000 1.3 35 151.57
[image:5.595.126.470.569.730.2]driving force of supersaturation (Agrawal and Paterson, 2015). How-ever, from the conducted experiments we observed initial occurrence of a mass fracture process from both the WMSC and saturated wet milling at constant temperature. As a consequence, secondary nucleation arising from the driving force of supersaturation and attrition during WMSC process is predominant during the latter stages of cooling with imaging showing the clear increase in particle population as a result of this process (Fig. 6). Similar trends were consistently seen when varying teeth configuration across the WMSC experiments (Table 2). In-corporation of inline FBRM and PVM during a wet milling process thus serve as essential process monitoring tools (PAT) to identify and
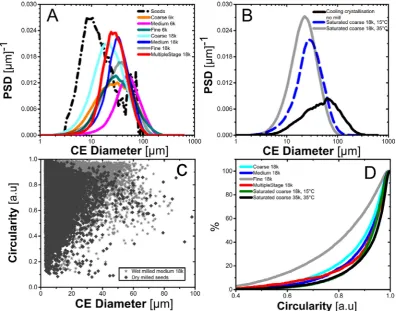
[image:6.595.127.469.55.600.2]distinguish between coinciding mechanisms (Fig. 1) occurring at spe-cific time intervals during an experimental run (Cardona et al., 2018). The CLD-inversion algorithm had successfully tracked inline particle size during the experiments. For WMSC at coarse 6 k & 18 k, a gradual shift in PSD from right to left is seen (Fig. 6A–C). Whilst tightening of the distribution occurs from the effect of wet milling, wider distribu-tions were obtained for end mill & cool points (Fig. 6A and B). This was due to particle agglomeration during the end hold period without wet milling. A substantial advantage from inline wet milling is its ability to act as a continuous de-agglomerating tool whilst maintaining a narrow PSD. This is also evident from the breakage only experiments to which
Fig. 6.Changes in particle size distributions (PSDs) derived from FBRM measurements during the experimental runs. WMSC with 6k (A); WMSC at 18k (B); saturated at 35 °C at 18k (C) and cooling crystallisation with no milling (D).
Fig. 7.Offline particle size and shape from different experimental conditions. PSDs shown for runs (A) saturated at 15 and 35 °C, (B) with no milling, and Circularity
[image:7.595.100.497.407.718.2]particles had reduced and remained narrow with a shorter end hold period (Fig. 6C). Without wet milling applied, a minimal shift in PSD from left to right occurs due to slow growth kinetics of acetaminophen in 2-propanol (Fig. 6D).
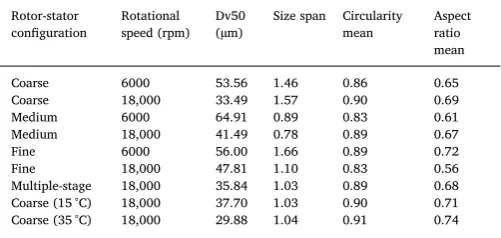
Collected offline particle sizes as a function of volume weighted circle equivalent diameter (μm) of end milled product emphasises the robustness of the process to deliver a consistent narrow PSD when using a higher rotational speed (rpm) than lower speeds (Fig. 7A and B). PSDs measured at different slurry turnovers can be additionally seen in the ESI. As rotor-stator teeth arrangement and rotational speed (rpm) are the two main governing factors of the wet mill, we identify rotational speed (rpm) as the main factor for targeting smaller particle size ranges with tighter spans as seen from the Dv50 values (Table 4). Maximum energy dissipatedE∗values reached 6 for 18000 rpm compared to 1.33 for 6000 (rpm). The normalised energy dissipation rateE∗correlated well with mean square weighted CLD (μm) from FBRM measurements for individual experiments, however a breakdown in the correlation term occurred when incorporating all conducted experiments and predicting against offline particle sizes at different slurry turnovers (Table 2,ESI). The breakdown can be attributed to several reasons such as breakage, attrition, growth and secondary nucleation (Fig. 1) all of which are not included in the mechanistic model. Selecting an accurate method for particle size characterisation, contribution of inner teeth to the overall energy dissipated and particle mechanical properties could be additional factors. Interestingly, the wet milling process was able to deliver narrow PSDs from a significantly skewed bimodal seed starting material under different rotor-stator teeth configurations specifically at higher rotational speeds (Fig. 7).
The effect of wet milling on crystal shape is yet to receive wider attention in the literature, however coupling temperature-cycling with milling for needle-like crystals is an emerging area of interest (Salvatori and Mazzotti, 2017; Wilson et al., 2018). Whilst dry milling can often produce irregular shaped particles, the WMSC process through varying teeth arrangement and rotational speed (rpm) has shown to deliver consistent circularity and aspect ratio values for acetaminophen. Both of these are important attributes in systems whereflowability andfi l-tration can be highly sensitive to any significant deviations. Mean particle circularity stays consistent from 0.83 to 0.91 with aspect ratios of 0.56–0.74 (Table 4). For majority of the milled samples increasing rotational speed (rpm) within the same teeth configuration had creased the circularity and aspect ratio. This was primarily due to in-creased volumetricflow rate from 0.29 to 1.3 (L/min) through the re-cycle setup which subsequently leads to greater number of slurry turnovers and more particle-teeth collisions. After the initial mass fracture process, during attrition and de-agglomeration, particles were considerably rounded off whilst colliding with more teeth present within the geometry. Hence, the controlled secondary nucleation phase after mass fracture shows that the competing processes were in equal states with particles still growing, healing & size reducing demon-strating simultaneous size and shape control whilst maintaining a high particle circularity from the WMSC process. This is further illustrated
from the comparison of wet milled circularity from the seed material used indicating that due to the nature of dry milling, particles are lar-gely irregular with greater surface roughening with a high presence of
fines present (Fig. 7C).
3.2. Surface heterogeneity analysis
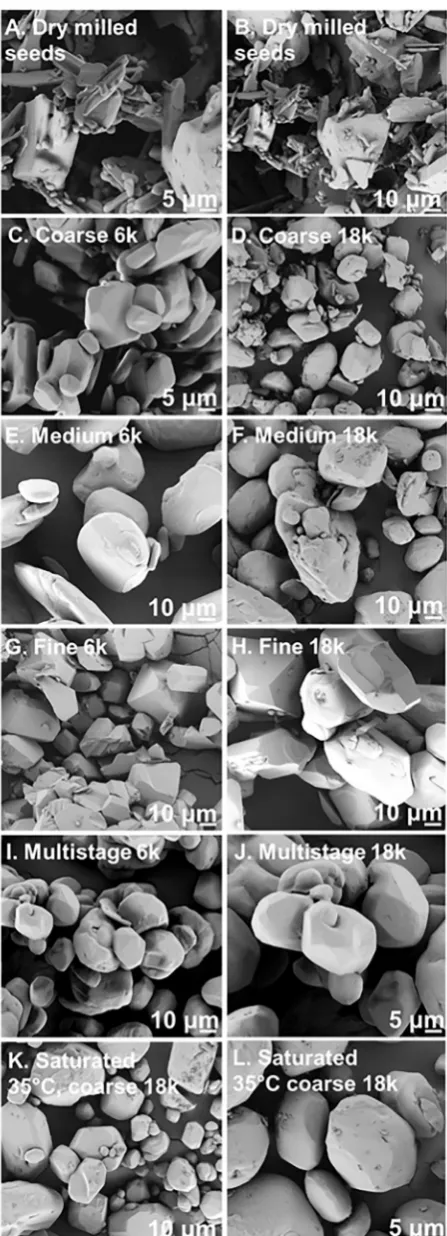
Milling is believed to cause significant variation in particle surfaces as a result of breakage and overall intensity of the mill operation. As a consequence, this will lead to a significant change of an API’s structural and chemical heterogeneity which in turn could pose difficulty during downstream processing (Ticehurst and Marziano, 2015). Therefore, analysing the consistency of particle surfaces between solid samples is important. In addition to particle size and shape analysis, surface en-ergies of wet milled acetaminophen under different teeth configuration, rotational speed (rpm) and of the dry milled material are reported here. Surface areas through BET analysis show values in the range of 0.1–0.3 (m2/g) for the wet milled samples (Table 5). Operating at higher rotational speed (rpm) for each configuration resulted in smaller sizes and higher surface areas. However, the seed material generated via a dry ball mill yielded a much higher specific surface area than other samples (0.726 ± 0.0076 m2/g;Table 5). The dry milled seeds also showed extensivefines, a range of aspect ratios and a large number of small agglomerated primary particles in comparison to the wet milled samples from the SEM images (Fig. 8). In contrast for all wet milled samples, the number of fine particles had evidently reduced during the course of cooling and size reduction when compared to dry milling (Fig. 7A–C). The wet milled crystals showed a range of mor-phological features between different teeth configurations (coarse, medium, fine, Fig. 8C–L) which included rounded, almost spherical particles (Fig. 8I and J) and evidence of particle breakage (Fig. 8F, K, L) presumably due to particle-teeth collisions. Across the SEM data, the impact of breakage as well as growth can clearly be seen (Fig. 8C–L).
Crystallised and wet milled samples from the different confi gura-tions exhibited maximumγSdvalues between 37.6 and 50.2 (mJ/m2
) in comparison to the dry milled seed particles having the highestγSdof 51.79 ± 0.57 (mJ/m2) (Table 5). Whilst consistentγ
S
[image:8.595.38.289.79.198.2]dvalues amongst the majority of wet milled samples was observed irrespective of the particle size (Table 5), analysing particle surface heterogeneity profiles across low and high energy surface sites displays variability inγSd dis-tributions from the measured samples (Fig. 9A and B). For the dry milled seed material, a considerably higher degree of heterogeneity from process induced disorder across surface coverage (0.005–0.09) is seen from 51.79 ± 0.57 (mJ/m2) to a final value of 42.95 ± 0.38 (mJ/m2). This is considerably higher to all low & high wet milled samples with the exception of medium 18 k (Fig. 9A and B). The area increment distribution of the seed is also relatively broad, emphasising the surface irregularity and distorted molecule orientation (Fig. 9C and D). This is consistent with the observation that this sample Table 4
Offline particle size and circularity spans for the WMSC experiments.
Rotor-stator configuration
Rotational speed (rpm)
Dv50 (µm)
Size span Circularity mean
Aspect ratio mean
Coarse 6000 53.56 1.46 0.86 0.65
Coarse 18,000 33.49 1.57 0.90 0.69
Medium 6000 64.91 0.89 0.83 0.61
Medium 18,000 41.49 0.78 0.89 0.67
Fine 6000 56.00 1.66 0.89 0.72
Fine 18,000 47.81 1.10 0.83 0.56
Multiple-stage 18,000 35.84 1.03 0.89 0.68
Coarse (15 °C) 18,000 37.70 1.03 0.90 0.71
[image:8.595.308.557.89.217.2]Coarse (35 °C) 18,000 29.88 1.04 0.91 0.74
Table 5
Particle size and measured surface energy at starting surface coverage (0.005 n/ nm) and surface area values measured for the majority of the experiments.
Rotor-stator configuration & speed (rpm)
Particle size, Dv50 (µm)
BET specific surface area [m2/g]
Dispersive specific surface energy (mJ/ m2)
Coarse 6 k 53.6 0.20 ± 0.004 42.9 ± 0.28
Coarse 18 k 33.5 0.28 ± 0.001 41.5 ± 0.45
Medium 6 k 64.9 0.10 ± 0.001 37.6 ± 2.19
Medium 18 k 41.5 0.12 ± 0.006 50.2 ± 1.17
Fine 6 k 56.0 0.11 ± 0.004 41.8 ± 0.27
Fine 18 k 47.8 0.30 ± 0.004 42.9 ± 0.58
Multiple-stage 18 k 35.8 0.12 ± 0.003 43.8 ± 0.16 Saturated coarse 18 k
35 °C
29.9 0.18 ± 0.004 43.0 ± 0.50
with the highest γSd shows a greater propensity to agglomerate in comparison to the wet milled particles as increasing surface energy at low surface coverage leads to stronger cohesiveness between particles.
At each rpm, the different wet mill teeth configurations yieldedfinal particle sizes varying by approximately 20 (μm). Reported studies such as Trowbridge (Trowbridge et al., 1998) showed a 20% increase in dry milledγSdwith a decrease in particle size from 30 to 10 (μm). We have observed similar trends to a somewhat lesser extent from the majority of collected wet milled samples when increasing the rotational speed (rpm) between each rotor-stator configuration (Table 5). Medium 6 k (19 total teeth), had a Dv50 of 64.91 (μm) and surface energy of 37.59 ± 2.12 (mJ/m2) whereas a medium 18 k had a Dv50 of 41 (μm) and surface energy of 50.15 ± 1.17 (mJ/m2) (Table 5). The relatively highγSdof medium 18 k in comparison to other wet milled confi gura-tions was unexpected, showing more surface roughening from breakage and subsequently an increase in exposure of specific crystal planes with different surface chemistries (Fig. 8). Fine 6 k (29 total teeth) had a Dv50 of 56 (μm) and surface energy of 41.84 ± 0.27 mJ/m2, whereas
fine 18 k had a Dv50 of 47.81 (μm) and surface energy of 42.91 ± 0.58 mJ/m2(Table 5). The increase in heterogeneity profiles forfine 18 k & multiple-stage 18 k after 0.06 surface coverage could be attributed to other interactions occurring at the higher energy sites such as solvent effects (Fig. 9B).
Nevertheless, both samples maintained expected circular mor-phology withfine 6 k & 18 k showing well-faceted crystal faces (Fig. 8). In addition to the coarse 6 k, which possessed 13 total teeth, these wet milled configurations at low rotational speed (rpm) had fairly similar particle size ranges (53.56μm, 64.91μm, 56μm; Table 5) but with clearly different absolute energy heterogeneity profiles across the full surface coverage (Fig. 9A). Altering between different rotor-stator teeth arrangement and speed (rpm) will subsequently lead to a different number of particle-teeth collisions and morphological features (Fig. 8) throughout, as the total number varies from 13 to 61 from 6000 (rpm) to 18,000 (rpm). When comparing the reduction inγSdas surface cov-erage is increased, for low rotational speed (rpm) the percentage de-crease ranged from 7.4 to 9.0% whereas for high rotational speed (rpm) including the decoupled experiment at 35 °C and dry milled seed, values ranged from 6.9 to 22% (Fig. 9A and B). This indicates that the number and direction of crystal faces and functional groups exposed varies when increasing or decreasing the number of teeth, rpm and conse-quently energy dissipated (0.04–30). Heng (Heng et al., 2006) reports that during a milling process, crystals of paracetamol fracture along their weakest attachment energy resulting in the dominant exposure of the crystal facet (0 1 0) determined by contact angle measurements with the surface chemistry of the facet being hydrophobic. In agreement with literature, for this process it would be reasonable to assume the immediate exposure of the crystal facet (0 1 0) is dominant upon mass fracture. However, crystal face indexing measured at different wet milling configurations and turnovers is out with the scope of this work. In addition to measuring particle size distribution spans, a hetero-geneity profile constitutes an energy landscape of the material surface. To represent the heterogeneity of the samples in a more illustrative manner, the surface energy distributions are obtained by a point-by-point integration of the surface energy profiles, resulting in plots of dispersive surface energy versus percentage of surface (area increment), as shown in (Fig. 9C and D). Area increment curves plotted alongside surface energy distribution profiles show lower surface energy dis-tributions are present for low rotational speeds (rpm) from areas 0 to 2.5% (Table 5) whereas for the WMSC and saturated coarse 18 k
con-figuration which has a tighter and smaller particle size distribution varies from areas 0 to 3.4% (Fig. 7C).
[image:9.595.52.276.55.674.2]Interestingly, Luner (Luner et al., 2012) observed high shear wet milling for sucrose and succinic acid generated significantly higher surface energies than dry milling. In contrast, we found through com-bining wet milling with crystallisation generated small uniform particle size distributions with lower surface energies, which is desirable for numerous crystallisation applications and downstream processing. Wet milling is increasingly being applied for continuous seed generation as producing in situ slurry seed particles with small sizes, high surface
areas and low surface energies has the potential to provide greater control and reproducibility for uniform crystal growth. PVM images (Fig. S7 ESI) demonstrate an example of wet milled (coarse 18 k rpm) acetaminophen seeds being subjected to growth during cooling (0.13 °C/min) with no milling whereby regular, large and well-faceted crystals can be produced and recovered.
Although careful manipulation of wet mill parameters for targeting size and shape can be achieved, we report the heterogeneous nature of particle surfaces that can be obtained from a wet milled and crystallised process as a result of changing teeth configuration. This work starts to address the limited predictive capabilities for achieving specific surface area and energy attributes from wet mill devices. This would enable greater control for seed generation and size reduction processes for specific attributes (Ticehurst and Marziano, 2015).
4. Conclusions
The effect of process parameters of a WMSC process have been demonstrated on three physical particle attributes of acetaminophen namely, particle size, shape and surface energy. Crystal sizes in the range of 30–60μm with narrow particle size distributions (span = 0.78–1.66) and crystal shape control (e.g. circularity 0.80–0.98) have been selectively achieved through tuning of the prin-ciple wet mill parameters, rotational speed and teeth configuration. The combination of advanced inline CLD to PSD conversion with simulta-neous offline imaging analysis was an effective means to measure and track key changes to PSD and shape during the dynamic wet milling processes. The WMSC experiments generated acetaminophen particles with surface energies in the range of 37–50 mJ/m−2 achieved from different teeth configurations. The combination of wet milling and crystallisation yielded lower surface energies than reported elsewhere (Luner et al., 2012) due to the surface healing driven by the crystal growth process. The heterogeneity of surface sites was impacted by increasing the number of teeth more than rotational speed. This is important as minimising heterogeneity can potentially improve
manufacturability in downstream processing. Ultimately, selecting a high rotational speed with lower teeth proved to be desirable for en-gineering particle attributes.
The robust andflexible nature of a WMSC strategy has the potential to serve as a smart particle engineering toolbox for future API manu-facturing demands where the properties can be selectively manipulated for chosen processing performance characteristics. In order to deploy this method routinely, work is progressing to develop an integrated workflow for process design to complement what has been shown elsewhere for continuous crystallisation (Brown et al., 2018).
Acknowledgments
The authors would like to acknowledge the EPSRC and the Doctoral Training in Continuous Manufacturing and Crystallisation (Grant Ref: EP/K503289/1) for funding as well as the Centre for Innovative Manufacturing in Continuous Manufacturing and Crystallisation (Grant Ref: EP/1033459/1) and EPSRC Future Manufacturing Research Hub (Grant Ref: EP/K014250/1) for supporting this work. The authors would also like to acknowledge that this work was carried out in the CMAC National Facility housed within the University of Strathclyde’s Technology and Innovation Centre and funded with a UKRPIF (UK Research Partnership Institute Fund) capital award (Grant Ref: HH13054) from the Higher Education Funding Council for England (HEFCE). The author would also like to thank Monika Warzecha for running the SEM samples and Dr Anett Kondor (Surface Systems Measurements) for her contribution to the surface property analysis of this work.
Appendix A. Supplementary data
[image:10.595.101.495.57.344.2]Supplementary data to this article can be found online athttps:// doi.org/10.1016/j.ijpharm.2018.10.073.
References
Aamir, E., Nagy, Z., Rielly, C., 2010. Evaluation of the effect of seed preparation method on the product crystal size distribution for batch cooling crystallization processes. Cryst. Growth Des. 10, 4728–4740.
Acevedo, D., Kamaraju, V.K., Glennon, B., Nagy, Z.K., 2017. Modeling and character-ization of an in situ wet mill operation. Org. Process Res. Dev. 21, 1069–1079. Agimelen, O.S., Hamilton, P., Haley, I., Nordon, A., Vasile, M., Sefcik, J., Mulholland,
A.J., 2015. Estimation of particle size distribution and aspect ratio of non-spherical particles from chord length distribution. Chem. Eng. Sci. 123, 629–640.https://doi. org/10.106/j.ces.2014.11.014.
Agimelen, O.S., Mulholland, A.J., Sefcik, J., 2018a. Software for transforming measured chord length distribution data to particle size distribution.
Agimelen, O.S., Svoboda, V., Ahmed, B., Cardona, J., Dziewierz, J., Brown, C.J., McGlone, T., Cleary, A., Tachtatzis, C., Michie, C., Florence, A.J., Andonovic, I., Mulholland, A.J., Sefcik, J., 2018b. Multi-sensor inline measurements of crystal size and shape distributions during high shear wet milling of crystal slurries. Adv. Powder Technol.
https://doi.org/10.1016/j.apt.2018.09.003.
Agrawal, S., Paterson, A., 2015. Secondary nucleation: mechanisms and models. Chem. Eng. Commun. 202, 698–706.
Anderson, N.G., 2012. Practical Process Research and Development: A Guide for Organic Chemists. Academic Press.
Badman, C., Trout, B.L., 2015. Achieving continuous manufacturing. May 20–21, 2014 continuous manufacturing symposium. J. Pharm. Sci.-US 104, 779–780.
Baxendale, I.R., Braatz, R.D., Hodnett, B.K., Jensen, K.F., Johnson, M.D., Sharratt, P., Sherlock, J.-P., Florence, A.J., 2015. Achieving continuous manufacturing: technol-ogies and approaches for synthesis, workup, and isolation of drug substance. May 20–21, 2014 Continuous Manufacturing Symposium. J. Pharm. Sci.-US 104, 781–791.
Beckmann, W., 2013. Crystallization: Basic Concepts and Industrial Applications. John Wiley & Sons.
Botsaris, G.D., 1976. Secondary Nucleation—A Review. In: Mullin, J.W. (Ed.), Industrial Crystallization. Springer, US, Boston, MA, pp. 3–22.
Brown, C., McGlone, T., Florence, A., Khinast, J., Rantanen, J., 2017. Continuous crys-tallisation, continuous manufacturing of pharmaceuticals. John Wiley & Sons Ltd, pp. 169–226.
Brown, C.J., McGlone, T., Yerdelen, S., Srirambhatla, V., Mabbott, F., Gurung, R., Briuglia, L.M., Ahmed, B., Polyzois, H., McGinty, J., Perciballi, F., Fysikopoulos, D., MacFhionnghaile, P., Siddique, H., Raval, V., Harrington, T.S., Vassileiou, A.D., Robertson, M., Prasad, E., Johnston, A., Johnston, B., Nordon, A., Srai, J.S., Halbert, G., ter Horst, J.H., Price, C.J., Rielly, C.D., Sefcik, J., Florence, A.J., 2018. Enabling precision manufacturing of active pharmaceutical ingredients: workflow for seeded cooling continuous crystallisations. Mol. Syst. Des. Eng. 3, 518–549.https://doi.org/ 10.1039/c7me00096k.
Cardona, J., Ferreira, C., McGinty, J., Hamilton, A., Agimelen, O.S., Cleary, A., Atkinson, R., Michie, C., Marshall, S., Chen, Y.-C., Sefcik, J., Andonovic, I., Tachtatzis, C., 2018. Image analysis framework with focus evaluation for in situ characterisation of par-ticle size and shape attributes. Chem. Eng. Sci. 191, 208–231.https://doi.org/10. 1016/j.ces.2018.06.067.
Chatterjee, S., 2012. FDA Perspective on Continuous Manufacturing. IFPAC Annual Meeting, Baltimore, MD.
Cote, A., Sirota, E., 2010. CRYSTALLIZATION: the pursuit of a robust approach for growing crystals directly to target size. Am. Pharm. Rev. 13, 46.
Donovan, J.G., 2003. Fracture toughness based models for the prediction of power con-sumption, product size. PhD Thesis. And Capacity of Jaw Crushers. Virgina Polytechnic Institute and State University, Blacksburg, Virginia.
Doris, G., Gray, D., 1980. Adsorption of n-alkanes at zero surface coverage on cellulose paper and woodfibers. J. Colloid Interface Sci. 77, 353–362.
Engstrom, J., Wang, C.C., Lai, C.J., Sweeney, J., 2013. Introduction of a new scaling approach for particle size reduction in toothed rotor-stator wet mills. Int. J. Pharmaceut. 456, 261–268.
Fujiwara, M., Chow, P.S., Ma, D.L., Braatz, R.D., 2002. Paracetamol crystallization using laser backscattering and ATR-FTIR spectroscopy: metastability, agglomeration, and control. Cryst. Growth Des. 2, 363–370.
Garside, J., Davey, R.J., 1980. Invited review secondary contact nucleation: kinetics, growth and scale-up. Chem. Eng. Commun. 4, 393–424.
Harter, A., Schenck, L., Lee, I., Cote, A., 2013. High-shear rotor-stator wet milling for drug substances: expanding capability with improved scalability. Org. Process Res. Dev. 17, 1335–1344.
Heng, J.Y., Thielmann, F., Williams, D.R., 2006. The effects of milling on the surface properties of form I paracetamol crystals. Pharm. Res. Dord. 23, 1918–1927.
Ho, R., Naderi, M., Heng, J.Y.Y., Williams, D.R., Thielmann, F., Bouza, P., Keith, A.R., Thiele, G., Burnett, D.J., 2012. Effect of milling on particle shape and surface energy
heterogeneity of needle-shaped crystals. Pharm. Res. Dord. 29, 2806–2816.
Hojjati, H., Rohani, S., 2006. Measurement and prediction of solubility of paracetamol in water-isopropanol solution. Part 1. Measurement and data analysis. Org. Process Res. Dev. 10, 1101–1109.
Kamahara, T., Takasuga, M., Tung, H., Hanaki, K., Fukunaka, T., Izzo, B., Nakada, J., Yabuki, Y., Kato, Y., 2007. Generation offine pharmaceutical particles via controlled secondary nucleation under high shear environment during crystallization-process development and scale-up. Org. Process Res. Dev. 11, 699–703.
Kim, S., Wei, C., Kiang, S., 2003. Crystallization process development of an active pharmaceutical ingredient and particle engineering via the use of ultrasonics and temperature cycling. Org. Process Res. Dev. 7, 997–1001.
Kondor, A., Quellet, C., Dallos, A., 2015. Surface characterization of standard cottonfi -bres and determination of adsorption isotherms of fragrances by IGC. Surf. Interface Anal. 47, 1040–1050.
Lawton, S., Steele, G., Shering, P., Zhao, L., Laird, I., Ni, X.-W., 2009. Continuous crys-tallization of pharmaceuticals using a continuous oscillatory baffled crystallizer. Org. Process Res. Dev. 13, 1357–1363.
Lee, I., Variankaval, N., Lindemann, C., Starbuck, C., 2004. Rotor-stator milling of APis-empirical scale-up parameters and theoretical relationships between the morphology and breakage of crystals. Am. Pharmaceut. Rev. 7, 120–123.
Luciani, C.V., 2018. Impact of process parameters on the grinding limit in high-shear wet milling. Org. Process Res. Dev. 22, 1328–1333.
Luciani, C.V., Conder, E.W., Seibert, K.D., 2015. Modeling-aided scale-up of high-shear rotor-stator wet milling for pharmaceutical applications. Org. Process Res. Dev. 19, 582–589.
Luner, P.E., Zhang, Y., Abramov, Y.A., Carvajal, M.T., 2012. Evaluation of milling method on the surface energetics of molecular crystals using inverse gas chromatography. Cryst. Growth Des. 12, 5271–5282.
Mascia, S., Heider, P.L., Zhang, H., Lakerveld, R., Benyahia, B., Barton, P.I., Braatz, R.D., Cooney, C.L., Evans, J.M.B., Jamison, T.F., Jensen, K.F., Myerson, A.S., Trout, B.L., 2013. End-to-End continuous manufacturing of pharmaceuticals: integrated synth-esis, purification, andfinal dosage formation. Angew. Chem. Int. Ed. 52, 12359–12363.
Newell, H.E., Buckton, G., Butler, D.A., Thielmann, F., Williams, D.R., 2001. The use of inverse phase gas chromatography to measure the surface energy of crystalline, amorphous, and recently milled lactose. Pharm. Res. Dord. 18, 662–666.
Pérez-Calvo, J.-F., Kadam, S.S., Kramer, H.J.M., 2016. Determination of kinetics in batch cooling crystallization processes—A sequential parameter estimation approach. AIChE J. 62, 3992–4012.
R Williams, D., 2015. Particle engineering in pharmaceutical solids processing: surface energy considerations. Curr. Pharm. Des. 21, 2677–2694.
Saleemi, A.N., Rielly, C.D., Nagy, Z.K., 2012. Comparative investigation of super-saturation and automated direct nucleation control of crystal size distributions using ATR-UV/vis spectroscopy and FBRM. Cryst. Growth Des. 12, 1792–1807.
Salvatori, F., Mazzotti, M., 2017. Manipulation of particle morphology by crystallization, milling, and heating cycles—A mathematical modeling approach. Ind. Eng. Chem. Res. 56, 9188–9201.
Srai, J.S., Badman, C., Krumme, M., Futran, M., Johnston, C., 2015. Future supply chains enabled by continuous processing—opportunities and challenges. May 20–21, 2014 Continuous Manufacturing Symposium. J. Pharm. Sci.-US 104, 840–849.
Szilágyi, B., Nagy, Z.K., 2018. Population balance modeling and optimization of an in-tegrated batch crystallizer–wet mill system for crystal size distribution control. Cryst. Growth Des. 18, 1415–1424.
Ticehurst, M.D., Marziano, I., 2015. Integration of active pharmaceutical ingredient solid form selection and particle engineering into drug product design. J. Pharm. Pharmacol. 67, 782–802.
Trowbridge, L., Grimsey, I., York, P., 1998. Influence of milling on the surface properties of acetaminophen. Pharm. Sci. (Suppl.) 1, 310.
Variankaval, N., Cote, A.S., Doherty, M.F., 2008. From form to function: crystallization of active pharmaceutical ingredients. AIChE J. 54, 1682–1688.
Wilson, D., Bunker, M., Milne, D., Jawor-Baczynska, A., Powell, A., Blyth, J., Streather, D., 2018. Particle engineering of needle shaped crystals by wet milling and tem-perature cycling: Optimisation for roller compaction. Powder Technol. 339, 641–650.
Yang, X., Acevedo, D., Mohammad, A., Pavurala, N., Wu, H., Brayton, A.L., Shaw, R.A., Goldman, M.J., He, F., Li, S., Fisher, R.J., O’Connor, T.F., Cruz, C.N., 2017. Risk considerations on developing a continuous crystallization system for carbamazepine. Org. Process Res. Dev. 21, 1021–1033.
Yang, Y., Song, L., Gao, T., Nagy, Z.K., 2015. Integrated upstream and downstream ap-plication of wet milling with continuous mixed suspension mixed product removal crystallization. Cryst. Growth Des. 15, 5879–5885.