Rochester Institute of Technology
RIT Scholar Works
Theses Thesis/Dissertation Collections
12-19-2014
Progress in Energy Storage Technologies: Models
and Methods for Policy Analysis
Schuyler W. Matteson
Follow this and additional works at:http://scholarworks.rit.edu/theses
This Dissertation is brought to you for free and open access by the Thesis/Dissertation Collections at RIT Scholar Works. It has been accepted for inclusion in Theses by an authorized administrator of RIT Scholar Works. For more information, please [email protected]. Recommended Citation
Progress in Energy Storage Technologies:
Models and Methods for Policy Analysis
By Schuyler W. Matteson
A Dissertation Submitted in Partial Fulfillment of the
Requirements for the Degree of
Doctorate of Philosophy in Sustainability
Department of Sustainability
Golisano Institute for Sustainability
Rochester Institute of Technology
Rochester, NY
December 19, 2014
Author:___________________________________________________________
Golisano Institute for Sustainability
Certified by:_______________________________________________________
Dr. Eric Williams
Associate Professor, Golisano Institute for Sustainability
Approved by:______________________________________________________
Mr. Dennis Andrejko
Interim Department Head, Golisano Institute for Sustainability
NOTICE OF COPYRIGHT
© 2015
Schuyler W. Matteson
REPRODUCTION PERMISSION STATEMENT
Permission Granted
Progress in Energy Storage Technologies:
Models and Methods for Policy Analysis
I, Schuyler W. Matteson, hereby grant permission to the Wallace Library of the Rochester Institute of Technology to reproduce my dissertation in whole or in part. Any reproduction will not be for commercial use or profit.
Signature of Author:
Progress in Energy Storage Technologies:
Models and Methods for Policy Analysis
By
Schuyler W. Matteson
Submitted by Schuyler W. Matteson in partial fulfillment of the requirements for the degree of Doctor of Philosophy in Sustainability and accepted on behalf of the Rochester Institute of Technology by the dissertation committee.
We, the undersigned members of the Faculty of the Rochester Institute of Technology, certify that we have advised and/or supervised the candidate on the work described in this dissertation. We further certify that we have reviewed the dissertation manuscript and approve it in partial fulfillment of the requirements of the degree of Doctor of Philosophy in Sustainability.
Approved by:
_______________________________________ Date:
_______________________________________ Date:
_______________________________________ Date:
_______________________________________ Date:
_______________________________________ Date:
ABSTRACT
Golisano Institute for Sustainability
Rochester Institute of Technology
Degree: Doctorate of Philosophy
Name of Candidate: Schuyler W. Matteson
Title: Progress in Energy Storage Technologies: Models and Methods for Policy Analysis
Climate change and other sustainability challenges have led to the development of new
technologies that increase energy efficiency and reduce the utilization of finite resources. To
promote the adoption of technologies with social benefits, governments often enact policies
that provide financial incentives at the point of purchase. In their current form, these subsidies
have the potential to increase the diffusion of emerging technologies; however, accounting for
technological progress can improve program success while decreasing net public investment.
This research develops novel methods using experience curves for the development of
more efficient subsidy policies. By providing case studies in the field of automotive energy
storage technologies, this dissertation also applies the methods to show the impacts of
incorporating technological progress into energy policies. Specific findings include
learning-dependent tapering subsidies for electric vehicles based on the lithium-ion battery experience
curve, the effects of residual learning rates in lead-acid batteries on emerging technology cost
competitiveness, and a cascading diffusion assessment of plug-in hybrid electric vehicle
development can save billions of dollars in public funds, while also lending insight into the
decision of whether or not to subsidize a given technology.
Abstract Approval:
Committee Chair: _________________________________
ACKNOWLEDGEMENTS
First and foremost I would like to thank my family for all of their love and support
throughout my academic career. My parents, Jeff and Renee, have always pushed me to
succeed, and my brother, Travis, through his successes, has been an excellent role model. Most
importantly, my wife Laura and new daughter Sophie have provided me with all of the
motivation I need to pursue my dreams.
I would also like to thank my Professors at Rochester Institute of Technology for their
teaching and guidance throughout my time in the program, and specifically Dr. Eric Williams,
my advisor, and the rest of the members of my committee, Dr. Thomas Trabold, Dr. Eric
Hittinger, and Dr. Gabrielle Gaustad.
This research was supported by the Golisano Institute for Sustainability and by the
Environmental Sustainability program of the National Science Foundation (grant# CBET
Table of Contents
List of Figures ... x
List of Tables ... xiii
I. INTRODUCTION ... 1
1.1 Background and Rationale ... 1
1.2 Research Objectives ... 4
1.3 Dissertation Outline ... 6
II. LEARNING-DEPENDENT SUBSIDIES FOR LITHIUM-ION ELECTRIC VEHICLE BATTERIES ... 9
2.1 Introduction ... 9
2.2 Methodology ... 13
2.2.1 Experience Curve ... 13
2.2.2 Subsidy costs ... 15
2.2.3 Cost Target ... 17
2.2.4 Justifying Zero Long-Term Cost ... 19
2.2.5 National versus International Experience Curves and Subsidy Policies ... 19
2.3 Results and Discussion ... 20
2.3.1 Experience Curve ... 20
2.3.2 Subsidy Analysis ... 22
2.3.3 EV market growth rates and learning ... 25
2.3.4 Discrete Subsidy Tapering ... 26
2.3.5 Policy Discussion... 30
2.3.6 Discussion of Uncertainty ... 32
2.4 Conclusions and Recommendations ... 33
III. RESIDUAL LEARNING RATES IN LEAD-ACID BATTERIES: EFFECTS ON EMERGING TECHNOLOGIES ... 36
3.1 Introduction ... 36
3.2 Methodology ... 39
3.2.1 Residual Experience Curve ... 39
3.2.2 Learning in an Incumbent Technology ... 41
3.2.3 Assessing Future Development Potential ... 41
3.2.5 Materials Cost ... 45
3.3 Results ... 47
3.3.1 Fitting data to the traditional experience curve ... 47
3.3.2 Materials Costs ... 49
3.3.3 Residual Experience Curve ... 50
3.3.4 Comparing traditional and residual cost experience curve models ... 52
3.3.5 Asymptotic Cost Assessment ... 54
3.4 Discussion ... 55
3.4.1 Lead-Acid Battery Learning Compared to Other Energy Technologies ... 55
3.4.2 Materials Costs in Lead-Acid Batteries ... 56
3.4.3 The Potential for Future Developments ... 58
3.4.4 Gap-to-Parity Analysis ... 60
3.5 Conclusions and Recommendations ... 63
IV. CASCADING DIFFUSION AND ENERGY TECHNOLOGY SUBSIDIES: THE CASE OF PLUG-IN HYBRID ELECTRIC VEHICLES ... 64
4.1 Introduction ... 64
4.2 Methodology ... 68
4.2.1 The Concept of a Subsidy ... 68
4.2.2 The PHEV Experience Curve ... 69
4.2.3 Incompressible Cost... 70
4.2.4 PHEV Market Curves ... 71
4.2.5 Cascading Diffusion and PHEV Subsidy Cost ... 75
4.3 Results and Discussion ... 76
4.3.1 Nation and State Level Cascading Diffusion Assessment ... 76
4.3.2 Person Level Cascading Diffusion ... 78
4.3.2 Net Benefits of a PHEV Subsidy ... 80
4.4 Sensitivity Analysis ... 81
4.4.1 Variability in Gas Prices ... 81
4.4.2 Sensitivity of Total Adoption to Electricity and Gas Prices ... 84
4.4.3 Sensitivity Analysis of PHEV Subsidy Net Benefits ... 87
4.5 Discussion and Conclusions ... 90
4.5.1 Gas Price as a Determinant of Subsidy Program Viability ... 90
4.5.2 Considering Program Administration ... 90
V. CONCLUSIONS ... 96
5.1 Discussion of Uncertainty in This Research.……….………...………96
5.2 Summary and Key Points………..……….98
5.3 The Path Forward for Sustainability Research………..………...…100
VI. APPENDICES ... 102
6.1 Appendix to Chapter II ... 102
6.2 Appendix to Chapter III ... 108
6.3 Appendix to Chapter IV ... 109
List of Figures
Figure I1. The experience curve of photovoltaic modules………...3
Figure 1. Comparison of subsidy levels for different tapering schedules ... 17
Figure 2. Experience Curve for Lithium-ion Batteries 1993-2005. ... 22
Figure 3. Cumulative production of lithium-ion batteries needed to reach cost target of
$300/kWh as a function of learning rate ... 23
Figure 4. Total subsidy cost as a function of learning rate and tapering interval ... 24
Figure 5. Annual growth in lithium-ion battery production necessary to meet cost goal in target number of years at various learning rates, and annual tapering ... 26
Figure 6. Annual and Cumulative budget of annually tapered subsidy – 9.5% learning rate, 10 year target to reach $300/kWh cost, 62% EV annual market growth ... 27
Figure 7. The effect of tapering frequency on total subsidy program cost with a learning rate of 9.5% ... 29
Figure 8a and 8b. Prices of lead-acid batteries in the U.S., 1985-2012 for a) smaller size (e.g. automotive) and b) larger size (e.g. uninterruptible power supply) ... 44
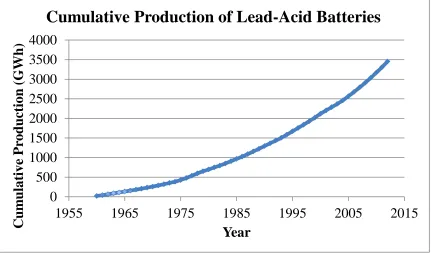
Figure 9. Cumulative production, in Gigawatt-hours, of lead-acid batteries in the United States, from 1975-2012 ... 45
Figure 10a and 10b. Price and cumulative production data fit to traditional experience curve, equation (1), from 1985-2012, for a) smaller size (e.g. automotive) and b) larger size (e.g. uninterruptible power supply) ... 48
Figure 11. Materials Costs per kWh of lead-acid batteries, 1989-2012, separated into Lead cost, all other materials, and total materials costs. ... 50
Figure 13. Projected experience curves for Lithium-Ion and Lead-Acid Batteries ... 60
Figure 14. Combining experience curves and market curves for subsidy policy analysis ... 66
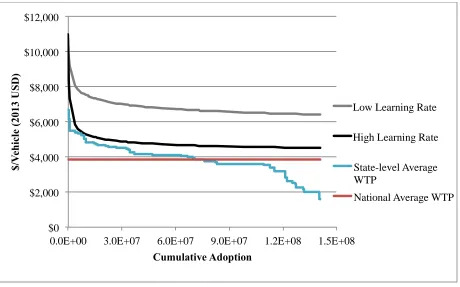
Figure 15: State- and Nation-level market curves for the U.S. paired with pessimistic and optimistic experience curves for PHEVs in a cascading diffusion analysis of vehicle
subsidies ... 77
Figure 16: Person-level market curve with pessimistic and optimistic experience curves for PHEVs in a cascading diffusion analysis of vehicle subsidies ... 79
Figure 17. The effect of gas price variability on market curves for PHEVs ... 82
Figure 18. Sensitivity analysis of total PHEV adoption driven by a subsidy program at various electricity and gas price combinations and a low learning rate of 9.5%. ... 85
Figure 19. Sensitivity analysis of total PHEV adoption driven by a subsidy program at various electricity and gas price combinations and a high learning rate of 22%. ... 86
Figure 20. Sensitivity analysis of subsidy program net benefits at various electricity and gas price combinations and a low learning rate of 9.5%. ... 88
Figure 21. Sensitivity analysis of subsidy program net benefits at various electricity and gas price combinations and a high learning rate of 22%. ... 89
Figure 22. A comparison of a continuous subsidy function, subsidy programs that taper at discrete intervals, and a fixed subsidy program ... 92
Figure 23. Sensitivity analysis of a fixed subsidy program’s net benefits at various electricity and gas price combinations and a low learning rate of 9.5%. ... 93
Figure 24. Sensitivity analysis of a fixed subsidy program’s net benefits at various electricity and gas price combinations and a low learning rate of 22%. ... 94
Figure A1. The experience curve and cost target for lithium-ion electric vehicle batteries, where the cost target is $300/kWh and the learning rate is 9.5%. ... 102
Figure A3. Annual and cumulative investment for a subsidy program tapered annually over a 15-year timeline given a 9.5% learning rate. ... 104
Figure A4. Annual and cumulative investment for a subsidy program tapered annually over a 10-year timeline given a 7.5% learning rate. ... 105
Figure A5. Annual and cumulative investment for a subsidy program tapered annually over a 10-year timeline given a 22% learning rate. ... 106
Figure A6. Percentage of total investment in electric vehicles provided by the government subsidy program. ... 107
Figure A7. Annual vehicle miles travelled microdata from the National Household
Transportation Survey fit to a normal distribution. ... 109
Figure A8. State-level gas price data fit to a normal distribution ... 110
Figure A9. The potential effect of introducing non-economic constraints into the PHEV
market curve ... 112
List of Tables
Table 1. Historical Price and Production Data for lithium-ino batteries ... 21
Table 2. Total cost of an electric vehicle subsidy program, in billions of USD, for select
learning rates and taper schedules. ... 24
Table 3. Annual subsidy per kWh for lithium-ion batteries at 9.5% LR and 62% market
growth ... 28
Table 4. Cost, in $/kWh of various energy storage systems ... 36
Table 5. Material inputs, in kilograms, and costs required for each equivalent kilowatt-hour of lead-acid battery ... 46
Table 6. Complete results of the learning assessment for all lead-acid batteries including
residual cost learning. All results are for the time period 1989-2012. ... 53
Table 7. Learning rates of various energy technologies ... 55
Table 8. Gap to parity analysis for lithium-ion batteries using lead-acid batteries as the
incumbent technology and various combinations of learning rates for each technology ... 61
Table 9. Results of the cascading diffusion assessment of a plug-in hybrid electric vehicle subsidy considering person-level sub-markets ... 80
Table 10. Cascading diffusion assessment of a PHEV subsidy at current electricity prices and various gas prices relative to current levels. ... 83
Table A1. Producer Price Index (PPI) values for small and large lead-acid batteries ... 108
I.
Introduction
1.1
Background and Rationale
Population growth, aging infrastructure, increased electricity demand and the growth of
intermittent renewable energy sources have placed new demands on the electricity grid. A
variety of options exist to decrease these demands, including energy efficiency measures,
transmission and distribution upgrades, and the adoption of energy storage technologies. Of
these options, energy storage is the least utilized due to the relative immaturity of the market,
though investment in the development of new energy storage has been increasing rapidly. At
the same time, consumers and governments are looking for alternative fuel options for personal
transportation. Energy storage in the form of vehicle batteries has been a key component in the
growth of the plug-in hybrid electric and all-electric vehicle markets. As a result, the energy
storage sector is consistently introducing new technologies for both grid and automotive
applications. A recent report predicts that the global market for energy storage for grid use
alone could rise from $200 Million in 2012 to over $10 Billion in 2017 (Warshay 2013).
However, even with new systems, such as lithium based batteries, flywheels, and compressed
air technology, providing a range of potentially valuable services, mature technologies that
have achieved lower cost through experience and scale have only recently begun to lose market
share to emerging technologies (KEMA 2012).
To bridge the gap in upfront capital cost between emerging technologies and the
incumbents, billions of dollars of public funds are spent every year to incentivize the adoption
of technologies with perceived public benefits. These subsidy programs are often developed
without clear description of methods and information, and may result in a less than optimal
technological progress to draw insight into the future costs of emerging energy storage
technologies to help create lower cost and higher impact subsidy policies.
The experience curve and its variants are often used for energy policy analysis
(International Energy Agency 2000; Junginger et al. 2005; Neij et al. 2003), and allow users to
quantify and forecast cost reductions in a technology as cumulative production increases.
Tsuchiya (1989) is among the first to utilize experience curves to quantify the total investment
needed to bring a technology, in his case photovoltaics, to price parity. Herron and Williams
(2013) analyze how differences in willingness to pay among different consumers influences the
subsidy required to bridge the gap between current and target costs. Experience curves have
also been used to forecast technological growth in many energy technologies (Harmon 2000;
Weiss et al. 2010).
The empirical experience curve gives a statistically robust fit over a range of costs and
production for variety of energy technologies (Neij et al. 2003), including photovoltaic
(Harmon 2000; van der Zwaan and Rabl 2004), wind (Junginger et al. 2005), and coal (Yeh and
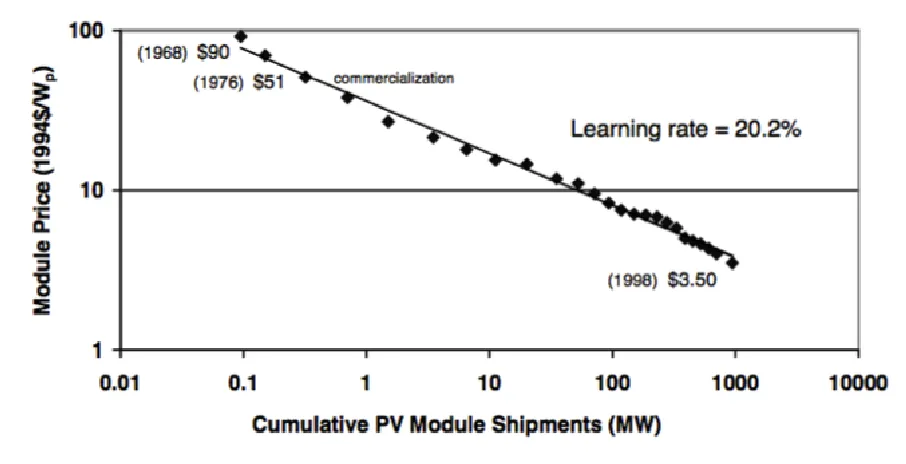
Rubin 2007). Figure 1 shows the well-known derivation of the photovoltaic experience curve,
which uses historical cost and production data to determine the percentage decrease in module
cost for each doubling of cumulative production. Further applications and review of experience
curves is presented in Anzanello and Fogliatto (2011). There is also a stream of literature which
seeks to develop multi-factor experience curves that distinguish factors such as learning by
Figure I. The experience curve of photovoltaic modules (Harmon 2000)
There is a gap in the literature, with a limited amount of technological progress studies,
including experience curves and learning rate information for energy storage technologies.
There is also limited application of this information to policy analysis. Some studies assess the
progress of batteries through the lens of technical performance characteristics. For example,
Gerssen-Gondelach and Faaij (2012) project likely scenarios for lithium-ion battery
performance traits over various timelines to determine whether the batteries may be able to
reach certain energy, emissions, and cost targets. Mayer et al. (2012) address technological
progress modeling by forecasting the cost of proton exchange membrane fuel cells and
lithium-ion batteries to 2020 using an augmented two-factor experience curve. However, the methods
result in a scenario analysis of the experience curve model, in order to determine input criteria
This project fills the gap by providing case studies for constructing the experience
curves of three separate energy storage technologies including lithium-ion batteries, lead-acid
batteries, and plug-in hybrid electric vehicles. The experience curves are developed utilizing a
traditional single factor experience curve, which is augmented based on the technology’s
material inputs and costs and is utilized for policy and market analysis.
There are also three new methods developed, one in each section, to supplement the
literature on policy analysis for energy technologies. Each method utilizes information derived
from the experience curves to show how the incorporation of technological progress models
improves policy development and assessment. The first method is for developing cost-effective
learning-dependent tapering subsidies and is outlined to show the benefits of using
technological learning analysis in subsidy program development. Second, new residual
experience curve methodologies are used to assess how learning rates in incumbent
technologies affect policies and markets for emerging technologies. Finally, market curves
constructed using various resolution levels are combined with experience curves to determine
how diffusion patterns are affected in fractional markets.
1.2
Research Objectives
This research has been completed to provide additional resources to policymakers and
new information and methodologies to researchers. New case study information is provided
regarding the historical development of energy storage technologies, and is in the form of
newly developed experience curves and learning rates for three separate energy storage
vehicles. This contribution expands the knowledge base of sustainable energy research by
providing additional resources to those studying technological progress.
The second area of contribution is methodological: in each of the three chapters, a new
method is developed to aid in the assessment of technological learning and provide guidance to
those interested in the adoption of emerging technology. These new methods result in policy
implications and recommendations in the specific cases presented, and also allow for a wide
range of applications to other energy technologies and markets.
The specific methods developed include:
The creation of learning-dependent tapering subsidies based on changes in the
distance between the experience curve and a cost target, using lithium-ion
batteries as a case study,
The development of a residual experience curve – experience curve minus
material costs – and learning rates in lead-acid batteries and the application of
the results in a gap-to-parity analysis (the distance of a technology to price
parity) of lithium batteries, and
The construction of a person-level market curve for a cascading diffusion
analysis of plug-in hybrid electric vehicles.
With better information, researchers and policymakers can create more efficient policies
to enhance the adoption and diffusion of key sustainability technologies. Higher economic
efficiency in the promotion of these technologies, such as electrified transportation and energy
storage systems, benefits society by providing improved technical performance and decreased
1.3
Dissertation Outline
The case study and method contributions described above are explained in Chapters II, III,
and IV respectively. An outline of the dissertation and a summary of each chapter are provided
below:
Chapter II: Governments subsidize diffusion of a variety of energy technologies believed to
provide social benefits. These subsidies are often based on the idea that stimulating learning
and industry development will lower costs to make the technology competitive, after which
point the subsidy can be removed. Two questions related to the design of subsidy programs are
investigated. One question is how net public investment changes with the time interval over
which subsidies are reduced, i.e. semi-annually, annually, etc. Governments prefer to reduce
subsidies more often to lower public costs, producers prefer longer time periods for a more
stable investment environment. The second question addressed is uncertainty in learning rates.
Learning rates describe the fractional cost reduction per doubling of cumulative production;
slower learning implies more government investment is needed to reach a cost target. These
questions are analyzed via a case study of subsidizing electric vehicles (EV) in the United
States. Given the importance of lithium battery cost in the price of an EV, historical data is
gathered to build an experience curve that describes cost reductions for lithium-ion vehicle
batteries as a function of cumulative production. Our model assumes vehicle batteries
experience the same learning as consumer electronics, yielding a learning rate of 22%. Using
learning rates ranging from 9.5-22%, the public subsidy needed to reach a battery cost target of
$300/kWh battery in ten years is estimated. For a 9.5% learning rate, semi-annual, annual and
biannual tapering costs a total 24, 27, and 34 billion USD respectively. For 22% learning,
While the tapering does affect program cost, uncertainty in learning rate is the largest source of
variability in program cost, increasing the importance of realistic ranges for learning rates when
planning electric vehicle and other technology subsidies.
Chapter III: The low price of lead-acid, the most popular battery, is often used in setting cost
targets for emerging energy storage technologies. Future cost reductions in lead acid batteries
could increase the investment and time scales needed for emerging storage technologies to
reach cost-parity. To characterize cost reductions, this chapter develops the first documented
experience curves for lead-acid batteries. Results of regression to a standard experience curve
using 1985-2012 data yield a poor fit, with R2 values of 0.17 for small batteries and 0.05 for
larger systems. To address this problem, battery costs are separated into material costs (of
which lead is the largest component) and residual costs, and find experience curves for residual
costs. Running time averages are also used to address market volatility in material costs. These
two modifications increase R2 to 0.78 and 0.74 for small and large systems respectively. The
learning rate for residual costs is found to be around 20%, a discovery with policy implications.
Neglecting to consider cost reductions in lead-acid batteries could result in failure of energy
storage start-ups and public policy programs. Generalizing this result, learning in incumbent
technologies must be understood to properly assess the potential of emerging technologies.
Chapter IV: The social benefit of energy technology subsidies is typically underestimated when
considering only the costs and benefits per item directly subsidized. This approach misses the
motivation underlying many subsidies: increased production drives technological progress and
after the technology becomes economically competitive, the social benefits of the subsidy are
markedly greater. Subsidies for Plug-in Hybrid Electric Vehicles (PHEV) in the U.S are
examined, showing that accounting for technological progress and eventual market activation
reduces the subsidy cost per vehicle by over 90%, suggesting that the current $7,500 per
vehicle PHEV subsidy is in the public interest. The modeling framework shows, more
generally, that assessing technological progress is critical to understand the benefits of a
subsidy policy.
Chapter V: This chapter summarizes the key results of this dissertation regarding experience
II.
Learning-Dependent Subsidies for Lithium-Ion Electric Vehicle
Batteries
2.1
Introduction
Electric vehicles (EV) are thought to provide a variety of benefits to society, including
decreased emissions, improved environmental performance in regions with clean grid
electricity, and have recently shown safety improvements over internal combustion vehicles
due to increased crumple zones and low centers of gravity (Inside EVs 2013). Due to these
potential benefits, federal and state governments in many countries offer subsidies and/or tax
credits toward the purchase of EVs. In the United States, for example, the federal incentive is
an income tax deduction of up to $7,500 depending on the battery capacity of the vehicle and is
set to end after the first 200,000 EVs purchased (Department of Energy 2013).
EV subsidies are an example of broader government efforts to promote the development
of energy technologies viewed as socially desirable, such as photovoltaic modules (Dincer
2011), and fuel cells (Brown et al. 2007). In general, a diffusion subsidy is set up to support a
technology at a specified level over a fixed time period (Kimura and Suzuki 2006) or target
production level (Internal Revenue Service 2013). At the expiration date and/or production
level, a decision is made to cease or decrease the subsidy. A recent, more innovative system in
Europe sets an explicit schedule for annual subsidy decreases (degression) for feed-in-tariffs
(FIT) for renewable energy (del Rio 2012; Munoz et al. 2007; Wand and Leuthold 2011). The
idea behind degression is that government support should decrease as costs fall due to industry
development, e.g. (Kimura and Suzuki 2006; del Rio 2012)
There are important questions as to how to best design subsidy policies. A pervasive
subsidy over time (Wand and Leuthold 2011; Herron and Williams 2013). Ideally, a diffusion
subsidy stimulates the industry to reduce cost to the point that the subsidy is no longer needed.
The central idea is to fix the subsidy rate as the difference between the technology and the
average consumer’s willingness to pay. Once the technology reaches the average willingness to
pay, price parity has been achieved and the subsidy is removed.
A variety of prior work has explored relationships between technological progress and
subsidy policies. The experience curve, a empirically observed power law decline of cost as a
function of cumulative production, is often used to forecast future costs (International Energy
Agency 2000; Junginger et al. 2005; Neij et al. 2003). Tsuchiya (1989) pioneered the use of
experience curves to quantify the total investment needed to bring a technology to price parity,
in this case, photovoltaic modules. Wand and Leuthold (2011) embed learning rates into a
larger model estimating the public benefits and costs of the FIT of PV in Germany. Herron and
Williams (2013) analyze how differences in willingness to pay among different consumers
influences the subsidy required to bridge the gap between current and target cost.
A critical design component of a subsidy is how it is tapered, i.e. how often and by how
much it is reduced. There is an important tension to balance in the frequency of tapering:
governments prefer to reduce the subsidy more often in response to cost reductions in order to
lower public costs. Producers on the other hand prefer longer-term subsidy commitments to
justify capital investments. There are also administrative considerations, e.g. reducing a subsidy
every week would not be practical to implement.
Two open questions with respect to subsidy design are explored. The first is how public
subsidy investments change as a function of the time interval over which the subsidy is tapered,
reduction, but it is worth examining the implications of other choices. The second question is
how variability in learning rates effect the public investment required to reach cost parity. Prior
analyses of subsidy-induced progress assume a single learning rate value (Wand and Leuthold
2011; Tsuchiya 1989). However, there is substantial variability in learning rates (Electric
Power Research Institute 2013), and lower learning could substantially increase the public
investment required to reach price parity. The German FIT policy goes the furthest to account
for variability in expected learning by allowing optional year-end adjustments of plus or minus
1%, according to observed cost reductions (Klein et al. 2010; Ragwitz and Huber 2005). It is
important, however, to explicitly analyze the variability in public investments as a function of
uncertain learning rates at the outset. This will inform the degree of flexibility to build into the
subsidy and also government willingness to invest if cost reductions are lower than baseline
expectations. A model is therefore constructed to estimate the net government subsidy required
to reach price parity as a function of how often the subsidy is reduced for various set learning
rates.
These questions are analyzed via a case study of the subsidy of electric vehicles in the
United States. The case study has its own merit; in particular it produces the first publicly
available experience curve for lithium batteries. While the International Energy Agency reports
a value for EV battery learning rates (International Energy Agency 2013), the underlying data
and analysis are not publicly available. The main challenge in building an experience curve is
lack of publicly available data on price/cost and production. An experience curve using the
assumption that learning rates for vehicle lithium batteries will be similar to their consumer
This choice will increase uncertainty in the results, though the methods for constructing
the curve in this analysis can be utilized again when future data become available. Furthermore,
larger lithium-ion batteries that are used in electric vehicles are most often simply a collection
of smaller cells, like those in consumer electronics, connected in a circuit, and share materials,
chemistry, and energy characteristics (Andrea 2010). For example, 6,000 – 8,000 of the most
common type of small cell lithium-ion battery, the 18650, are combined to form the new Tesla
Model S battery pack (Fisher 2013; Mayer et al. 2012). There are additional components in this
case, such as a control system and wiring, though for this analysis we do not assess learning in
these components, and choose to represent lithium-ion electric vehicle battery learning as
analog to learning in smaller lithium-ion batteries.
In recent years, lithium-ion batteries have grown in popularity and applications,
resulting in active research and development, particularly for transportation. Much of the
published research centers around reducing the costs of these batteries (Anderson 2009; Axsen
et al. 2008; Gaines and Cuenca 2000; Cready et al. 2003; Kalhammer et al. 2007; Takashita
2007; Lowe et al. 2010; Barnett 2009). Another stream of research examines the resource and
environmental implications of battery use (Dunn et al. 2012; Gaines et al. 2010; Goonan 2012;
Notter et al. 2010; Wilburn 2008; Zackrisson et al. 2010). Research, development and
industrialization has led to improved battery performance and reduced cost.
Over the past few decades, lithium-ion batteries have been most commonly used to
power small electronic devices, such as laptop computers and mobile phones. Due to their high
specific energy, lithium ion batteries are becoming the dominant technology for Electric
Vehicles (EVs). Currently though, they are an expensive choice compared to gasoline in
costs. In many cases, the EV battery accounts for around 50% of the total cost of the vehicle
(International Energy Agency 2013). High battery costs imply EVs are not economically
profitable for most consumers, presenting a substantial barrier to adoption. However, battery
costs continue to fall. The rapidity and extent of cost reductions in lithium-ion batteries is a
critical driver of the affordability of EVs in the near term.
While impacts from the life cycle of batteries need assessment and management (Notter
et al. 2010), questions regarding the current and future environmental benefits of electric
vehicles will not be addressed. In addition, it has been argued that the operation phase of an
electric vehicle is only as clean as its electricity supply (Michalek et al. 2011), though other
studies suggest pollutants will be reduced regardless of the power supply due to improvements
in energy efficiency by switching away from internal combustion engines (Electric Power
Research Institute and National Resources Defense Council 2007; Massachusetts Institute of
Technology 2010). Carbon and criteria air pollutant emissions associated with EVs are
expected to reduce along with increased electricity production from renewable sources. The
co-evolution of the electricity grid and future demand from EVs is, however, a complicated matter.
2.2
Methodology
2.2.1 Experience Curve
The experience curve is a mainstay of retrospective forecasting for energy technologies.
Developed first to describe cost reductions in aircraft manufacturing (Wright 1936), the
experience curve is an empirically observed power law decay of some characteristic of
industrial processes and cumulative experience implementing that process (Teplitz 1991; Yelle
C (P) = C0(P/P0)-α (1)
where P is a measure of cumulative adoption of the technology (e.g., the total kilowatt-hour
capacity of batteries produced), C is the price per energy unit (e.g., $/Wp or $/kWh), C0 and P0
are initial cost and production values, α is a (positive) empirical constant, known as the learning
coefficient. The fractional reduction in cost for every doubling of production is known as the
Learning Rate (LR) and is given by
(2)
Equation (1) gives a statistically robust fit over a surprising range of costs and production for
variety of energy technologies (Neij et al. 2003), including photovoltaic (Harmon 2000; van der
Zwaan and Rabl 2004), wind (Junginger et al. 2005), circuitry (Moore 1965), and coal (Yeh
and Rubin 2007). Experience curves have been used to forecast progress for a variety of energy
technologies (Harmon 2000; Weiss et al. 2010). There is also a stream of literature to develop
multi-factor experience curves that distinguish factors such as learning by doing, learning by
searching, economies of scales and material costs (Kobos et al. 2006; Yu et al. 2011). In this
chapter, a single factor experience curve is used, focusing on how to utilize it for subsidy policy
analysis. Future analyses could include potential spillover effects from other types of battery
production; such as additional types of consumer electronics or batteries manufactured for use
in uninterruptable power supply systems.
Note that this analysis utilizes experience curves rather than learning curves.
Conceptually, the terms are very similar, however they are technically different in that
experience curves refer to the reduction in production costs (labor, process, etc.) with every
doubling of cumulative production, whereas learning curves refer only to the reduction in direct
labor input (hours worked, etc.) required to complete a task (produce one battery).
At varying learning rates, lithium-ion batteries will require different quantities of
cumulative production to reach cost targets, following the relationship that higher learning rates
require less production to meet the per kWh cost goal. These production totals are calculated
using the equation
(3)
where PCt is cumulative production needed to meet the cost target, P0 is cumulative production
in the initial year, Ct is the target cost of the technology, and C0 is the cost of the technology in
the initial year. Note that equation 3 is a reorganization of equation 1. This allows us to input
the empirically determined learning rate to solve for the cumulative production.
The cumulative production targets vary substantially, meaning that at similar annual
production rates, scenarios operating at low learning rates will take much longer to reach cost
goals than those at higher learning rates. Analogously, at different learning rates, cost
reductions occur at different rates. At a given level of cumulative production, the learning rate
will determine the number of units needing to be produced to reach the cost target.
2.2.2 Subsidy costs
Given that the primary goal of a subsidy is to bring the technology to price parity, the
learning-dependent investment formula can used to determine the subsidy (S) needed for a
given level of production (P): the difference between the experience curve cost and a target cost
(Ct) that represents price parity with some alternative:
(4)
PC
t =P0´
Ct C0 æ è ç ö ø ÷ -1 a æ è ç öø÷
S=C0´ P0
P
æ è ç öø÷
a
( )
As units are produced and cumulative production increases, the subsidy decreases until the
technology reaches price parity, at which point government support can be withdrawn.
Equation 4 allows us to calculate the instantaneous subsidy, the subsidy required at any given
point of the experience curve.
Equation 4 can be integrated to calculate the total cost of a subsidy plan, representing a
scenario in which the subsidy is reduced infinitesimally for each incremental increase in
production:
(5)
Continuous decrease of the subsidy is infeasible from an administrative standpoint, in
practice the subsidy needs to be reduced over discrete intervals of increases in production.
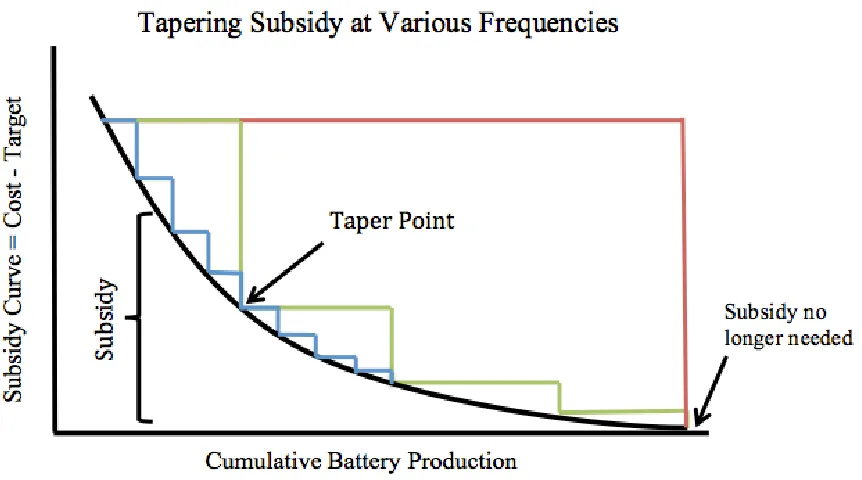
Figure 1 illustrates different tapering schedules and how the schedules affect total public
investment. Instead of an integral of the experience curve, the total investment in a tapered
subsidy is the sum of rectangular areas with each height as the experience curve cost during an
interval, and the width is the difference in production over the interval. The red line in figure 1
represents a flat subsidy that remains constant over the life of the program. The green and blue
lines are tapered more frequently, while a subsidy plan that follows the black curve is tapered
with each unit of production. The black line represents the minimum subsidy policy, calculated
with equation 5. The area under each separate colored line represents the total cost of the
subsidy plan. Clearly, the red line subsidy plan results in the highest total cost, while tapering
more frequently reduces the total cost of the plan.
Min{Subsidy(P)}= (C0 P
P0
æ è
ç ö
ø ÷
-a
-Ct)dP P0
P
Figure 1. Comparison of subsidy levels (red, green, blue) for different tapering schedules.
The area under each separate line is the total public investment for the subsidy plan.
2.2.3 Cost Target
It is common in policy analysis to compare the cost of an evolving technology to some
cost target or price parity, typically chosen as static in time (International Energy Agency 2013;
Howell 2012; Tsuchiya 1989; Wand and Leuthold 2011). While it is certainly worth
considering dynamic and heterogeneous targets, to bound the scope of this work the following
practice is used. For EVs, the International Energy Agency and the Department of Energy use a
cost target of $300/kWh for vehicle batteries (Howell 2012; International Energy Agency
2013). While this number is not explained, it is found to correspond to the net present value of
electric and conventional vehicles becoming equivalent for plausible values of input parameters
(e.g. vehicle lifespan of 10 years, 10,000 miles driven annually, $3.50/gallon gasoline price,
In reality this target is a moving one, because gasoline and electricity prices vary over
time. However, gas prices are expected to increase in the future rather than decrease, and
therefore this target represents an upper bound on the total subsidy program costs for EVs,
since any increase in gas price will raise the target line, decreasing the distance between the
technology cost and the target.
Chapters III and IV incorporate alternative methods for determining the cost target of a
given technology, in order to account for potential variability or heterogeneity in the parity
price. Whereas the current chapter assesses a constant target price, chapter III treats price
parity for emerging technologies as the cost of the incumbent technology, which more than
likely is not constant. In that case, the parity price is often a moving target, corresponding to
cost reductions in the incumbent proportional to the incumbent’s learning rate. Chapter IV
takes the price parity discussion a step farther, treating the target cost as a heterogeneous value
that varies by consumer. The cost target is thus different for each consumer, and is represented
by the individual’s economic willingness to pay for the emerging technology relative to the
incumbent.
Figures A1 and A2 in Section 6.1 of the Appendix show how reducing the cost target
would affect the total cumulative production required to meet the goal. A small decrease in the
price parity target, whether due to technological learning in an incumbent technology or an
increase in the emerging technology’s material costs, can drastically affect the cumulative
production requirement, thereby increasing the total cost of the subsidy program. Depending
on how large the gap to price parity becomes, the subsidy program cost may exceed social or
2.2.4 Justifying Zero Long-Term Cost
In equation (1) the limit as cumulative production goes to infinity is zero cost.
Obviously, no technology has zero cost; the implicit assumption is that long-term cost is too
small to influence the variable region over which the equation is being used. While there can
arise practical obstacles to progress in cost reduction that are difficult or even impossible to
predict, it is possible to estimate an asymptotic cost based on material prices in the
thermodynamic limit. Estimating this cost and comparing it to the cost target is part of the
process of using equation (1) for the assessment of energy technologies. Due to the high
potential for efficiency improvements in lithium batteries (Srinivasan 2008) the asymptotic cost
per kWh of the technology is very small. Using current experimentally determined material
composition data (Wang et al. 2013), applying thermodynamic efficiency limits (R. A. Huggins
2010), and utilizing current material cost data (Infomine 2013), the asymptotic cost is estimated
to vary between $3 and $11 per kWh, or around 1-2% of current costs. Since asymptotic cost is
significantly less than the target cost and it would not noticeably affect the results, the
asymptotic cost is neglected hereafter.
2.2.5 National versus International Experience Curves and Subsidy Policies
Many technologies, including electric vehicles, are produced by multi-national
companies and have global markets. The experience curve for many components of a
technology should thus apply to global prices and global cumulative production. This section
focuses on a national analysis (the United States) based on the following rationale: While there
is potential for international coordination (Herron and Williams 2013), subsidy policies are
effects of lower prices due to adoption in other nations. However, a national policy ought to
realize its goals regardless of actions taken outside its jurisdiction.
This is not always optimal or even feasible, but analyzing a purely national policy is an
appropriate starting point, particularly since the US represents nearly 40% of the global EV
stock (International Energy Agency 2013). If the national policy is deemed too expensive or
otherwise ineffective, analysis can be expanded to include actions by other nations. While
learning in lithium batteries for consumer electronics could also contribute to a reduction in the
price of electric vehicles, this consideration is neglected via reasoning analogous to the above.
It is important to understand the potential of an EV subsidy aside from possible spillovers from
other sectors.
2.3
Results and Discussion
2.3.1 Experience Curve
It is preferable to use cost data to develop the experience curve, equation (1), but here,
as in many other cases, only price data is available. Historical pricing for lithium-ion batteries
in consumer electronics over the interval 1993-2005 was taken from (Brodd; Takashita 2007).
These prices are converted to real 2005 dollars using annual national inflation rates for the
United States (Inflation Calculator 2013). Annual production data, on a per kWh basis, are
found for lithium-ion batteries in consumer electronics (Battery University 2013). This is
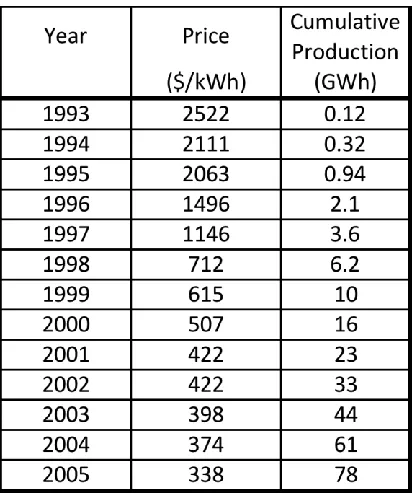
converted to cumulative production so that the adjusted data, shown in Table 1, is suitable for
Table 1. Historical Price and Production Data for lithium-ion batteries (in 2005 US$) (Brodd;
Takashita 2007; Battery University 2013)
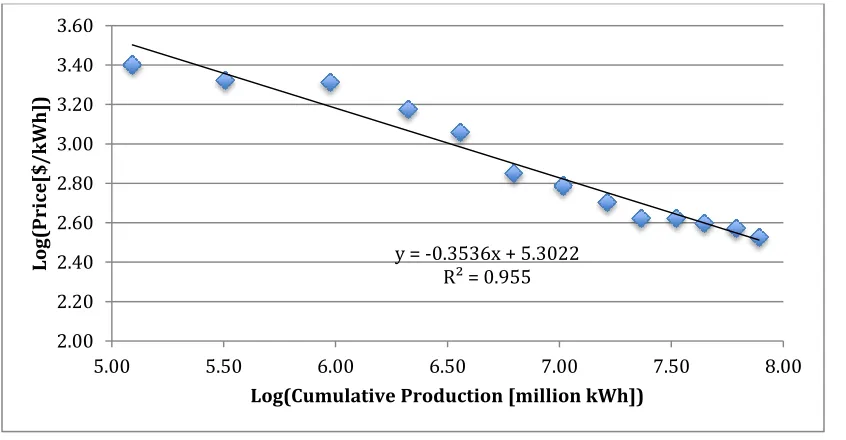
Fitting this data to Equation (1), the historical learning rate for lithium-ion batteries is
found to be 22% for the time period between 1993 and 2005. The curve and data are plotted
together in Figure 2, and the resulting r-squared value for this statistical fit is 0.955. It is
important to note that during this time period, lithium-ion batteries were used primarily for
small portable electronics.
Throughout this paper the initial cost of lithium-ion batteries is taken to be $600/kWh
(Howell 2012) and the initial production level is 2.3 million kWh annually in 2012
(International Energy Agency 2013). In a recent publication, the IEA reports having calculated
a learning rate of 9.5% for EV batteries (International Energy Agency 2013). Data supporting
the calculation of these learning rates is not provided however, and it is not entirely clear what
uncertainty in future learning rates and to account for this, a range of learning rates are
[image:36.612.99.522.153.373.2]considered, including the range between the empirically derived value and the IEA value.
Figure 2. Experience Curve for Lithium-ion Batteries 1993-2005.
The experience curve used is thus
( ) [ ] ( ),
Where P is measured in kWh. The existing range of learning rates between 9.5 and 22% is
examined. Some results are shown as a function of this range, and others using the IEA (9.5%)
scenario.
2.3.2 Subsidy Analysis
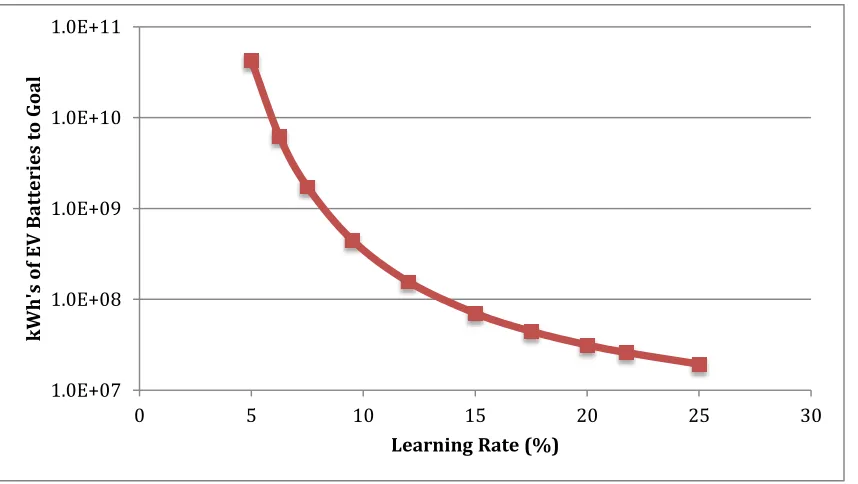
The learning space, consisting of learning rates between 5% and 25%, is used in
equation 3 to calculate the cumulative production needed to reach the cost target, and the
results are shown in figure 3. With a 22% learning rate, lithium-ion batteries will reach a cost
target of $300/kWh after 26 million kWh of cumulative production, but at the IEA rate of
y = -0.3536x + 5.3022 R² = 0.955
2.00 2.20 2.40 2.60 2.80 3.00 3.20 3.40 3.60
5.00 5.50 6.00 6.50 7.00 7.50 8.00
Log
(Price[
$/kWh
])
9.5%, 425 million kWh of additional battery capacity would be required to reach the same
target. The total production of capacity required spans orders of magnitude, highlighting the
[image:37.612.95.524.180.422.2]importance of the value of the learning rate.
Figure 3. Cumulative production of lithium-ion batteries needed to reach cost target of
$300/kWh as a function of learning rate
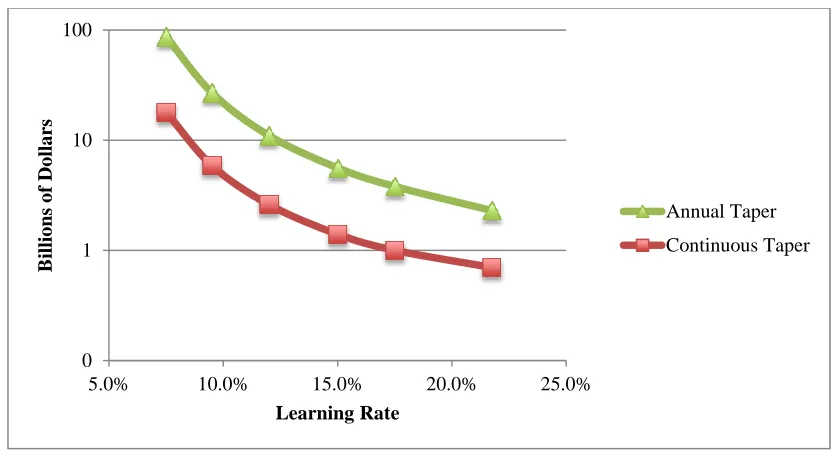
Shown in figure 4, results for the total cost of a continuous decreasing subsidy range
from $2 – $87 billion as a function of learning rate, while the total cost of an annually tapered
subsidy range from $1 – $18 billion. This is because at higher learning rates, much less
cumulative production is required to reach the cost target, as shown by figure 3. As the
cumulative production needed to reach the goal increases, both total public investment and the
required annual market growth rate increase.
1.0E+07 1.0E+08 1.0E+09 1.0E+10 1.0E+11
0 5 10 15 20 25 30
kWh
's
of
EV
Ba
tt
er
ies
to
G
oa
l
Figure 4. Total subsidy cost as a function of learning rate and tapering interval
An important aspect of figure 4 is how tapering affects total cost at each learning rate.
Tapering less frequently increases total cost, shifting the curve up. This phenomenon is shown
by the total program costs for different learning rates and taper schedules in Table 2, and will
be discussed further in the following sections. Figure A3 in Section 6.1 of the Appendix
expands on this idea by illustrating the reductions in subsidy level as cumulative production
increases at various learning rates.
7.5% 9.5% 12.0% 15.0% 17.5% 21.7%
Semi-Annual 75 24 10 5.1 3.5 2.1
Annual 87 27 11 5.6 3.8 2.3
[image:38.612.96.512.68.296.2]Bi-annual 115 34 14 6.7 4.4 2.6
Table 2. Total cost of an electric vehicle subsidy program, in billions of USD, for select
learning rates and taper schedules.
0 1 10 100
5.0% 10.0% 15.0% 20.0% 25.0%
B
illi
o
ns
o
f
Do
lla
rs
Learning Rate
Annual Taper
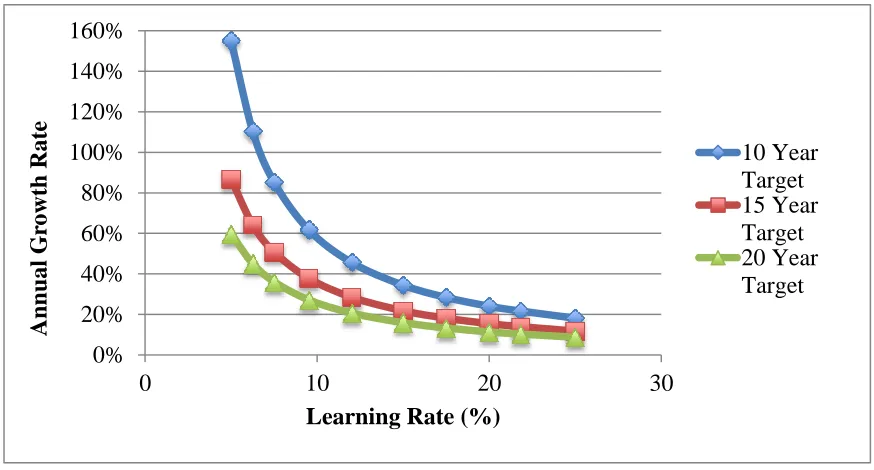
2.3.3 EV market growth rates and learning
The experience curve does not contain a time component. Ramping up manufacturing
and building consumer markets both have rate limitations, thus is important to consider how
quickly the EV industry would need to grow in order to achieve the cost target. Three time
frames are considered: 10, 15 and 20-year goals. These time frames are representative of
practical goals for the lithium-ion battery market, but are longer compared to aggressive
programs such as the recent “EV Everywhere Grand Challenge” in the United States, which
sets a goal of five years or less (Department of Energy 2011), and the goal of cost parity by
2020 set forth in the recent “Global EV Outlook” (International Energy Agency 2013). Figure 5
shows the relationship between learning rate and the annual growth rate needed to meet
different timeline goals. Due to the exponential relationship, marginal increases in the learning
rate lead to drastic changes in necessary growth rates. While it is difficult to alter a
technology’s learning rate, figure 5 does show that it is important to have a grasp on the
learning rate in order to set reasonable market goals.
At the historical 22% learning rate, battery price falls rapidly with production and only
26 million kWh of lithium-ion battery capacity must be produced worldwide to reach a
$300/kWh cost target. This is equivalent to about 1.3 million EVs with an average battery size
of 20 kWh. At an annual growth rate of 22%, this would be achieved in ten years. To put this
in perspective, the IEA reports that in 2012, the EV market grew by over 160% (International
Energy Agency 2013). While this rate is unlikely to continue for a decade, growth rates in
excess of those needed in the 22% learning rate scenario are possible.
With the slightly more favorable IEA learning rate of 9.5% a total of about 450 million
cost target. A growth rate of 62% is necessary to meet the target in ten years. Additionally, if
all of this purchasing occurred within the United States, EVs would represent about ten percent
[image:40.612.86.523.180.415.2]of the country’s total vehicle fleet by 2022 (Department of Transportation 2013).
Figure 5. Annual growth in lithium-ion battery production necessary to meet cost goal in
target number of years at various learning rates, and annual tapering
2.3.4 Discrete Subsidy Tapering
Figure 4 shows the total cost for a continuously decreasing subsidy. As mentioned
earlier, in practice subsidies must be tapered in discrete steps. Regular intervals (e.g. annual,
biannual) are presumed to be preferable to provide stability for producers and consumers,
although different tapering schedules would affect total subsidy cost. An interval subsidy works
as follows. For each learning rate, setting a 10-year target determines required growth rates to
meet the target, shown in Figure 5. After a given time interval, the subsidy is reduced to meet
the cost reduction via the experience curve, as shown in Figure 1. The areas of each rectangle 0%
20% 40% 60% 80% 100% 120% 140% 160%
0 10 20 30
Ann
u
al
G
row
th Rat
e
Learning Rate (%)
are added to obtain total subsidy cost until the target is met. Figure 5 shows the total subsidy
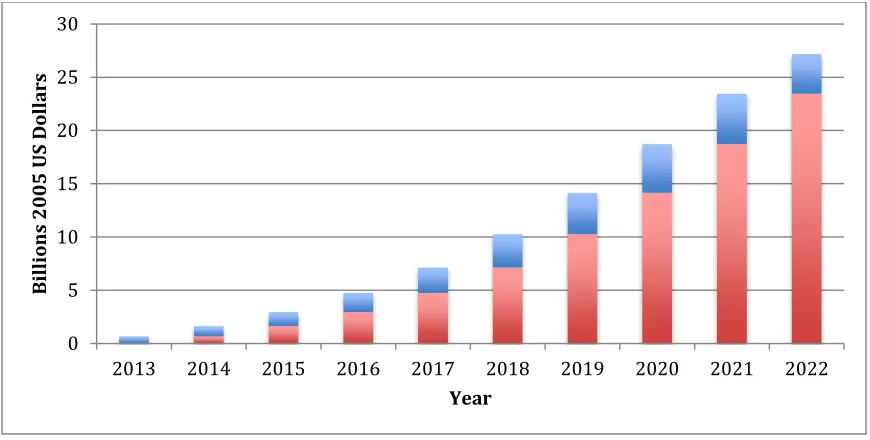
cost for different tapering schedules. Figure 6 shows the annual and cumulative budget for a
subsidy policy with a resolution of one year. The total cost of the plan amounts to $27 billion
[image:41.612.88.523.209.429.2]over the course of ten years.
Figure 6. Annual (blue) and Cumulative (red) budget of annually tapered subsidy – 9.5%
learning rate, 10 year target to reach $300/kWh cost, 62% EV annual market growth
An important aspect of this plan is the annual budget for the subsidy. While the subsidy
per kWh for lithium-ion batteries decreases each year as shown in Table 3, the annual budget
for the plan increases every year except the final year of the plan (as shown by the blue
segment of the bars in figure 6). This is due to the exponential growth in the production of the
batteries, which is a constant 62% growth in annual production per year. The amount of
batteries produced increases by a greater magnitude each year under these conditions, gradually
increasing the annual budget for subsidies until the final year. Figures A5–A7 in Section 6.1 of
0 5 10 15 20 25 30
2013 2014 2015 2016 2017 2018 2019 2020 2021 2022
Bil
lio
ns
20
05
US
D
oll
ar
s
the Appendix show how annual and cumulative budget can be increased or decreased by
altering learning rates and program timelines.
Year Subsidy/kWh
2013 $300
2014 $260
2015 $222
2016 $187
2017 $155
2018 $124
2019 $96
2020 $69
2021 $45
2022 $22
Table 3. Annual subsidy per kWh for lithium-ion batteries at 9.5% LR and 62% market
growth
In the first year of the program, 2013, the current price of lithium-ion batteries is
$600/kWh and the target price is $300/kWh, therefore the subsidy needed per kWh is $300.
Mathematically, due to the continuous nature of the learning rate formula, the technology
learns with each kWh of production, which results in a marginal decrease in cost. It follows
then that as the cost decreases, the necessary subsidy decreases as well. However, in this plan
the subsidy is re-evaluated only at the beginning of each year, not after each kWh, which
essentially results in the government overpaying for all but the first kWh of each year.
The frequency of subsidy tapering is important. If the subsidy is more frequently
tapered the total cost of the subsidy plan will decrease, as shown in Figure 4. To more clearly
demonstrate variance in the total cost of the subsidy plan as function of interval, Figure 7
learning rate of 9.5%. The growth rate of the EV market is held constant for all time periods to
aid in the comparison of the various tapering schedules.
Figure 7. The effect of tapering frequency on total subsidy program cost: learning rate = 9.5%
The calculations show that tapering the subsidy for lithium-ion batteries quarterly as
opposed to annually saves $4 billion, or 15% of the total project budget. The cost savings are
even greater when compared to flat subsidy programs, in which the same quantity is paid to the
consumer over the life of the subsidy. For example, if the subsidy was set to the initial rate,
$300/kWh, and maintained at that level for the life of the program, the total cost would amount
to $134 billion, four times greater than the annually tapered subsidy, which emphasizes the
importance of adjusting subsidy levels.
Figure A8 in Section 6.1 of the Appendix shows how the percentage of the total
investment provided by the government varies by tapering schedule. The results show that
tapering more frequently not only saves on total program costs, but also reduces the
technology’s dependence on public funds. This allows the government to provide a smaller
0 5 10 15 20 25 30 35
Bi-Annually Annually Semi-Annually Quarterly per kWh
Bil
lio
ns
of
D
oll
ar
s
percentage of the total investment required to drive adoption of a technology; in this case,
electric vehicles.
2.3.5 Policy Discussion
The results indicate that, when tapering annually, the total cost of a lithium-ion battery
subsidy is in the range of $2-27 billion for learning rates from 9.5-22%. Setting aside the
robustness of this range for the time being, the policy implications of this result are discussed
next. To first recap the current U.S. subsidy since 2009, consumers purchasing an electric
vehicle are entitled up to a $7,500 tax deduction (Internal Revenue Service 2013). Our results
suggest that this current subsidy level of $7,500 per EV roughly matches the gap between
current EV prices and the government cost target. Adoption of EVs, partly due to this subsidy,
has increased rapidly in recent years, with the number of EVs purchased more than doubling
each of the past three years. While renewal is possible, the current subsidy is phased out after
three production increments of 200,000 vehicles. For this subsidy to realize the $300/kWh cost
goal on this schedule, a learning rate of 33% would be required. The current policy production
range is thus not likely to bridge EVs to economic competitiveness.
This finding moves the discussion forward to whether or not the government should
adopt a new subsidy plan, estimated here to cost $2-27 billion USD when tapered annually.
This is a complex issue that connects to the expected benefit of electric vehicles compared to
competing avenues for public spending. This dissertation will only take a narrow view of the
issue here, restricting the discussion to a comparison with U.S. federal subsidies for corn
ethanol. The electric vehicle and biofuel scenarios are not strictly congruent, however many of
the expected social benefits of corn ethanol and EV are similar, such as increased energy
willingness for the federal government to invest in a transport fuel perceived as socially
beneficial.
Corn ethanol has been federally subsidized in the U.S. since the early 1970’s. The
primary form of subsidy from 1970-2011 was a tax credit ranging from 40-51 cents per gallon.
In 2011, the direct subsidy expired, and corn ethanol is now indirectly subsidized through the
Renewable Fuels Standard, which mandates a schedule of production targets for ethanol
(Environmental Protection Agency 2013). The General Accounting Office estimates the sum of
federal subsidies from 1970-2000 totaled $7.7-11.7 billion USD (General Accounting Office
2000). Ethanol production grew rapidly in 2000 onwards, increasing from 1.62 billion gallons
in 2000 to 13.9 gallons in 2011 (Energy Information Administration 2013). Subsidy
investments increased accordingly, ranging from $1-5 billion USD annually after 2001 (Cox
and Hug 2010). This results in a total subsidy cost of around $40 billion USD over the full life
of the subsidy program from 1970-2011. Viewed through the narrow lens of the biofuels
subsidy policy, even the upper end of the range for EV subsidies – $27 billion USD – is well
below what has been historically spent on ethanol. Considering that technological learning
suggests that the subsidy holds promise to be a one-time, rather than ongoing, expense, a
lithium-ion battery program seems an attractive investment.
In addition to the net sum the federal government is willing to invest in EV subsidies,
there is also the critical question regarding tapering schedules. Direct ethanol subsidies
continued at similar levels for a period of decades and then were cut to zero in 2011. Mitigating
the net cost of the electric vehicle subsidy requires tapering. At the same time, industry
requires a certain degree of stability in subsidies to justify long-term investments. Tapering that
confidence. While a degree of adaptability is desired, a schedule for tapering based on observed
and projected cost reductions, such as an experience curve, is a way forward.
2.3.6 Discussion of Uncertainty
While this study has provided an initial assessment of the range of expected costs for an
electric vehicle subsidy program, there are a number of issues not addressed here that should be
clarified in future work:
Using the right experience curve – First, decision-makers might consider the resulting
range in the net cost of EV subsidy programs cost unacceptably large. Even if the worst-case
cost were deemed acceptable, it is possible that learning rates could fall outside of our plausible
band of 9.5-22%. Also, it could be that a more complex experience curve relationship is
appropriate for lithium batteries. Research to better understand past and potential future cost
reductions in lithium-ion battery production could address these uncertainties. This research
must be completed for EV policy to succeed. A research investment of hundreds of thousands
to a few million dollars could do much to clarify a subsidy program that could run in the
billions of dollars.
Beyond battery price – Price is by no means the sole determinant of desirability of a
vehicle. The limited range of electri