City, University of London Institutional Repository
Citation
:
Barbur, J. L. and Rodriguez-Carmona, M. (2016). Color vision changes in
normal aging. In: Elliott, A. J., Fairchild, M. D. and Franklin, A. (Eds.), Handbook of Color
Psychology. (pp. 180-196). Cambridge: Cambridge University Press. ISBN 9781107043237
This is the accepted version of the paper.
This version of the publication may differ from the final published
version.
Permanent repository link:
http://openaccess.city.ac.uk/12513/
Link to published version
:
Copyright and reuse:
City Research Online aims to make research
outputs of City, University of London available to a wider audience.
Copyright and Moral Rights remain with the author(s) and/or copyright
holders. URLs from City Research Online may be freely distributed and
linked to.
City Research Online:
http://openaccess.city.ac.uk/
[email protected]
8
Color vision changes in normal aging
John L. Barbur and Marisa Rodriguez-Carmona
Introduction
The aging visual system undergoes myriad changes that affect physiological functions, with subsequent decline in visual performance as a result of either degraded retinal images or changes in the neural mechanisms in the retina and the visual pathways. The various attributes of vision, such as the ability to seefine spatial detail in objects of low contrast, to discriminate small color differences, and to detect motion and rapid flicker, decline gradually and in different ways (Haegerstrom-Portnoyet al.,1999; Owsley, 2011; Werneret al., 1990; Werner and Steele, 1988), but, as a result of adaptation processes, one often remains largely unaware of“normal” aging. We expect“good vision” throughout our lifetime (Enoch et al., 1999), and as we grow older we only become aware of visual deficits when the retinal images are degraded heavily by refractive errors, increased scattered light, reduced retinal illuminance, or the presence of disease that affects the retina or the visual path-ways. Separating the latter from the more gradual decline that can be attributed to normal aging is often difficult since during the early stages of disease many older subjects may not have normal vision but may exhibit no obvious clinical signs. There are many vision attributes we can assess, but the eye is arguably most sensitive to color differences (Chaparroet al., 1993), and, unlike achromatic contrast sensitivity, color thresholds under optimum conditions remain relatively unaffected by small changes in refraction, pupil size, and scattered light (Barbur et al., 1997;
Barbur and Rodriguez-Carmona, 2012). Color assessment is therefore of interest in detecting early neural changes that cannot be attributed to normal, age-related decline. Under optimum con-ditions of light adaptation, color appearance is also independent of the optical density of the ocular media (Werneret al., 2004), and, equally surprisingly, yellow/blue (YB) color thresholds remain relatively independent of both macular pigment optical density and absorption of short wavelength light by the lens (Rodriguez-Carmona et al., 2006). Significant reduction in retinal illuminance and stimulus size can, how-ever, cause large increases in color thresholds (Knoblauchet al., 1987).
the need to define adequatefilters to ensure that no subjects with increased thresholds as a result of congenital or acquired loss of chromatic sensi-tivity are included in the normal sample group. Since both RG and YB color thresholds remain relatively unaffected by moderate changes in the optics of the eye, it is also of interest to identify the most likely factors that cause the gradual loss of chromatic sensitivity with increasing age.
Rod photoreceptor density in central vision declines by as much as 30% over a lifetime, but the number of cones remains relatively constant in normal aging (Curcio et al., 1993). Color vision relies on cone signals and the integrity of the retina and visual pathways. The number of retinal ganglion cell (RGC) axons decreases line-arly by as much as 40% over a lifetime (Johnson et al., 1989; Jonas et al., 1992; Neufeld and Gachie, 2003). Although more difficult to count in older eyes, RGC cell body loss also increases gradually in normal aging.
The neuronal density and structural morpho-logy of the primary visual cortex and extra-striate areas exhibit little or no detectable changes in normal aging (Calkins, 2013; Hauget al., 1984; Vincentet al., 1989). It is therefore of great inter-est to inter-establish how the normal, gradual loss of RGC axons and the corresponding cell bodies in humans affects color vision and other aspects of visual performance. Equally important, the establishment of reliable, normal, upper threshold limits may make it possible to detect accelerated losses that cannot be attributed to normal aging. Such losses can reflect reduced inner retinal and choroidal blood circulation (Hirata and Nishiwaki, 2006), changes in the retinal pigment epithelium (Panda-Jonaset al., 1996), damage to photoreceptors, and accelerated loss of RGC bodies and axons as reported in Alzheimer’s dis-ease (Curcio and Drucker, 1993) or glaucoma (Marvasti et al., 2013; Tatham et al., 2014). Less well-defined, neural and vascular changes can cause vision degradation and loss of chro-matic sensitivity in patients with systemic disease
such as diabetes (Bronson-Castain et al., 2012; Calkins, 2013; Feitosa-Santana et al. 2010; Harrison et al., 2012; Tam et al., 2012). Accurate measurements of RG and YB color thresholds coupled with reliable age-related, upper-threshold limits are of great clinical interest as the means to detect the earliest signs of disease.
Methods employed to assess
chromatic sensitivity
–
isolation
of color signals
The majority of color vision tests were designed to discover congenital color deficiency, which almost exclusively results in a loss of RG chro-matic sensitivity. Many of the tests minimize the detection of luminance-contrast (LC) signals that are often present in the colored stimulus by employing spatial features that vary randomly in luminance contrast. Some tests such as the Ishihara test plates also employ YB chromatic noise to provide better isolation of RG color signals. This makes the test extremely sensitive for detection of RG deficiency (Rodriguez-Carmonaet al., 2012). Lantern tests require the subject to name correctly the color of small signal lights that are usually presented against a dark backgroundfield (Birch, 2008). These conditions do not favor chromatic mechanisms; as a result, many subjects with normal color vision also fail and on other occasions subjects with mild con-genital deficiency pass (Barbur and Rodriguez-Carmona, 2012; Squireet al., 2005).
distribution (Kinnear, 1970; Kinnear and Sahraie, 2002). In the case of pseudo-isochromatic plate tests, the number of errors the subject makes is often taken as a measure of the severity of loss. Although, in general, subjects with severe loss of RG color vision tend to produce larger error scores, the total error scores correlate very poorly with the subject’s loss of chromatic sensitivity (Rodriguez-Carmona, O’Neill-Biba, and Barbur, 2012). A number of new tests which emulate the Ishihara test plates on visual displays have been developed recently by generating static colored spots or patches that vary randomly in size and luminance so as to isolate the use of color signals (Birch et al., 1992; Regan et al., 1994; Wong et al., 2008).
A new approach to isolating the use of color signals has emerged from studies on camouflage that employed moving, color-defined stimuli buried in dynamic LC noise. The results show that when using such stimuli, the selective loss of color signals (as in the case of dichromats) makes the color-defined stimulus invisible for modulations along the corresponding color con-fusion line, even for chromatic saturations that are limited only by the phosphors of the display (Rodriguez-Carmonaet al., 2005). Exposing the retina to time-varying LC noise reveals the loss of chromatic sensitivity since the subjects cannot make use of LC signals to see the moving stimu-lus (Barburet al., 2002).
The following section describes briefly the Colour Assessment and Diagnosis (CAD) Test and in particular the standard normal (SN) CAD units which define the average thresholds for RG and YB color vision in young, normal trichro-mats. Many of the data that describe how normal aging affects color vision were obtained with the CAD test and are expressed in CAD units. Results from other important studies of aging that employed different tests have also been converted to CAD units and are shown and discussed for comparison.
The standard normal CAD observer
The CAD units are based on the mean thresholds measured in 333 young, normal trichromats. The thresholds were measured in several color direc-tions selected along the YB and RG axes (Figure 8.1A) and are shown normalized with respect to the median thresholds in Figure 8.2B and C. This sample is dominated by 20– 30-year-old subjects, an age group that turned out to have the best chromatic sensitivity.
The median YB and RG thresholds are shown as blue and red arrows in Figure 8.1A. The colored symbols show CAD test results for a typical normal trichromat. The 16 directions measured make it possible to compute reliably the mean RG and YB thresholds and to diagnose accurately the subject’s class of color vision (i.e., normal, deutan-, protan-, tritan-like conge-nital loss, or acquired color-vision deficiency) (Barbur and Rodriguez-Carmona, 2012). The amplitude of the measured thresholds relate almost linearly to the corresponding cone con-trasts generated (Figure 8.1B and C). The stimuli employed (Figure 8.1D) yield high chromatic sensitivity with threshold cone contrasts for the median observer of less than 0.4% (L) and 0.8% (M). The median thresholds along the YB axis which isolates S-cone signals correspond to ~7% S-cone contrast (Rodriguez-Carmona, O’ Neill-Biba, and Barbur, 2012).
The effects of retinal illuminance
and stimulus size
Retinal illuminance and stimulus size are impor-tant parameters that affect chromatic sensitivity at
[image:5.550.112.426.79.327.2]threshold (as shown in Figure 8.3). The back-ground luminance and the stimulus size employed in the CAD test are indicated by vertical arrows. These values were selected in order to achieve Figure 8.1 The statistical limits for the standard normal (SN) CAD observer
high chromatic sensitivity, to restrict the area tested to a small region of the visualfield, and to allow for variation in pupil size and viewing distance.
The use of a higher luminance restricts the gamut of the visual display that can be achieved. Interestingly, the YB thresholds show a more rapid rise with decreased background luminance. Following adjustment for the expected decrease in retinal illuminance caused by the subject’s lens and macular pigment absorption of short wave-length light, there is little or no difference between the YB and RG thresholds (see red and blue dashed traces in Figure 8.3A). Similarly, when the thresholds are expressed in SN CAD units, stimulus size affects equally both RG and YB thresholds (Figure 8.3C and D). The results sug-gest that a significant reduction in retinal illumi-nance, particularly for short wavelength light caused by selective absorption by the lens, the macular pigment, and a decrease in pupil size in older subjects, is likely to cause higher YB thresh-olds when the level of ambient illumination is low.
Effect of normal aging
–
subject
selection criteria
The large majority of subjects investigated were recruited from the Damme Optometri Practice (Kesteren, Netherlands), with some subjects (particularly in the younger age group) being recruited from and then tested at City University London.
A detailed medical history was taken from each subject followed by clinical assessment. The latter included examination of the anterior segment by a slit lamp and classification of lens opacity by the LOCS III system (Chylacket al., 1993). Only subjects with grade 2 or less for nuclear-, cortical-, and posterior subcapsular opa-cities were included in the study. The fundus was assessed by undilated, indirect ophthalmoscopy and photographed with the Topcon non-mydriatic fundus camera. The majority of subjects had RG and YB thresholds measured separately in each eye Age distribution for the Standard
Normal CAD Observer 100
75
50
25
0
0 25
RG thresholds: μ = 1; σ = 0.2 40
Age (yrs)
n = 333
n = 333
F
requency count
80
A
B
C 60
40
20
0
F
requency count
55 70 85
0 0.5
RG CAD thresholds
1 1.5 2
YB thresholds: μ = 1; σ = 0.24
n = 333 80
60
40
20
0
F
requency count
0 0.5
YB CAD thresholds
[image:6.550.72.271.83.526.2]1 1.5 2
by the CAD test. Many of the very young subjects (<10 years of age) examined at City University had congenital RG color deficiency, and their RG thresholds were not included in the study.
A number of“filters”were applied to all older subjects to ensure that those with potentially abnormal colour vision were not included in the analysis. Thefilters were defined as follows:
(1) all subjects with congenital deficiency exhi-biting elevated RG thresholds and normal YB thresholds
(2) subjects with medical conditions such as dia-betes, hypertension, and ocular abnormalities that may cause acquired loss of chromatic sensitivity
25
A B
C D
20
15
5 10
0
RG thresholds (CAD units)
Log luminance (cd/m2)
–2.5 –1.5 –0.5 0.5 1.5 2.5
4
3
2
1
0
RG thresholds (CAD units)
Log stimulus size (deg2)
0 0.5 1 1.5 2
4
3
2
1
0
YB thresholds (CAD units)
Log stimulus size (deg2)
0 0.5 1 1.5 2
25
20
15
5 10
0 24 cd/m2
1.1 sq. deg 1.1 sq. deg
24 cd/m2
YB thresholds (CAD units)
Log luminance (cd/m2)
[image:7.550.90.478.84.419.2]–2.5 –1.5 –0.5 0.5 1.5 2.5
(3) subjects with abnormal fundus appearance or drusen
(4) subjects exhibiting a statistically significant difference in RG and/or YB chromatic sensitivity between the two eyes. The index employed to describe the asymmetry between the two eyes was the difference in monocular thresholds referenced to the best eye:
j
jRELEjSmallest ofREorLE
j
. Figure 8.5 shows thestatis-tical distribution of this parameter for both RG and YB thresholds. All subjects outside the 2σ limit were initially eliminated from the study. Thisfilter is based on empirical observations which show that the two eyes are often affected differently in many cases of acquired loss of chromatic sensitivity.
Monocular and binocular thresholds
Previous studies revealed significant differences between binocular and monocular measurements for both RG and YB thresholds. Conversion from monocular to binocular thresholds was carried out by using the mean monocular to binocular ratio measured in 57 subjects with normal color vision. Best eye monocular to binocular ratios were calculated with means and standard devia-tions of 1.29 and 0.16 for RG and 1.3 and 0.18 for YB color vision. The mean ratios of right and left eye thresholds and the corresponding standard deviations were 1.03 and 0.12 for RG and 1.02 and 0.09 for YB, neither being significantly different from unity. Since binocular threshold limits are also of interest, these ratios were used to convert monocular to binocular thresholds for the normal sample group. The corresponding best-fit equations that describe the age depen-dence of monocular and binocular thresholds for the final data set are given in the caption to Figure 8.7. Although the subject-specific monocular (R and L eye) thresholds are corre-lated, at least one element of the measured monocular variability can be attributed to random noise. Since no statistical comparison with other
populations was carried out or intended, the thresholds for both eyes were included in the
final sample whenever available in order to reduce random noise and hence improve the esti-mated variability.
Effect of normal aging on RG
and YB thresholds
The filters described above were applied to the raw data, and the intermediate results after
filtering are shown in Figure 8.4C and D. The exclusion of several eyes that are likely to be abnormal following the filtering applied to the raw data reveals more clearly the linear trend above 20 years age in both RG and YB thresh-olds. Equations of the form mean threshold = k0+ k1* age + k3* exp (c4* age)werefitted to
the data, and the differences between the mea-sured points and the computed mean were then used to estimate ±2.5σlimits, as illustrated for the
final data set in Figure 8.7.
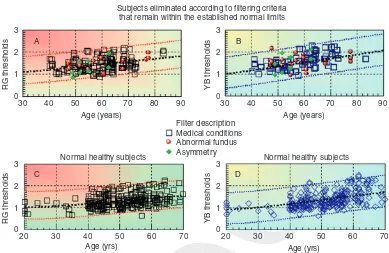
It soon became apparent that some of the subjects eliminated as a result offiltering had color thresholds within the computed normal limits (see Figure 8.6C and D). Data for each of the subjects eliminated were re-examined, and those with thresholds within the normal limits are shown in Figure 8.6A and B as a function of age. Nine of the 197 male subjects diagnosed with congenital color deficiency had large RG thresholds and are not shown in Figure 8.6. Out of the 153 subjects with known medical conditions, 67 had thresholds within the normal limits, and, most importantly, these thresholds were distributed equally above and below the median values. Half of the 18 subjects diagnosed with unusual fundus appearance and four out of the 27 subjects that failed the asymmetry test also had normal thresholds (see Figure 8.6A and B).
40
N = 393 720 eyes
A B
C D
30
RG thresholds
20
10
0
0 10 20 30 40 50 60 70 80 90 40 Unfiltered thresholds
Thresholds after filtering N = 393 720 eyes 30
YB thresholds
20
10
0
0 10 20 30 40 50 60 70 80 90
N = 179, 296 eyes 6
8
RG thresholds
4
2
0
0 10 20 30 40 50
Age (yrs) Age (yrs)
60 70 80 90
N = 179, 296 eyes 8
YB thresholds
6
4
2
0
[image:9.550.91.480.87.282.2]0 10 20 30 40 50 60 70 80 90
Figure 8.4 Comparison of thresholds before (panels A and B) and afterfiltering (panels C and D) the original monocular data measured at City University London and the Damme Optometrie Practice in the Netherlands (Kesteren). The age range of subjects was 4–90 years, and there were 215 females and 197 males. RG and YB CAD thresholds were measured separately for each eye. Exclusion criteria were applied to“filter”out subjects with congenital and acquired color-vision deficiencies. Thefilters were defined according to the following criteria: (1) congenital color-deficient subjects (which exhibit elevated RG and normal YB thresholds); (2) subjects with medical conditions (MC) such as diabetes, hypertension, and ocular abnormalities that may cause acquired loss of chromatic sensitivity; (3) subjects with abnormal fundus appearance or drusen; (4) subjects exhibiting a statistically significant difference in RG and/or YB chromatic sensitivity between the two eyes. The index employed to describe the asymmetry between the two eyes was the difference in monocular thresholds referenced to the best eye.
30
20
10
F
requency count
0
0 0.5
|(RE-LE)/Min(RE, LE)| |(RE-LE)/Min(RE, LE)|
1 1.5 0 0.5 1 1.5
30
A B
20
10
F
requency count
0
[image:9.550.90.472.424.601.2]sample, even if they failed the specified, initial inclusion criteria.
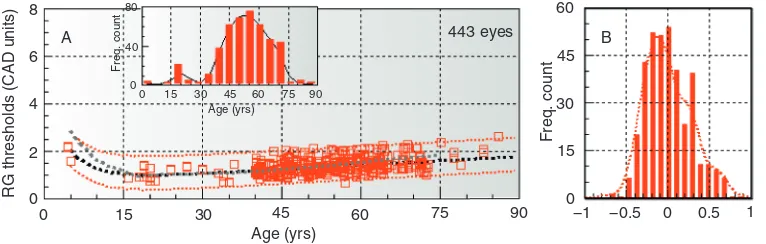
The revised data set based on 443 eyes for RG and 456 eyes for YB color vision was then used to calculate the mean thresholds and the corre-sponding ±2.5σlimits as a function of age. The results reveal the well-documented increase in thresholds below 10 years of age (Knoblauch et al., 1995), the optimum age for best thresholds around 20 years, and the remarkably gradual and linear increase which almost doubles both the RG and the YB thresholds during the normal life
span. There are other interesting observations. The variability remains relatively unchanged within each decade. Although, on average, there is a 2.2-fold difference between the most and least sensitive normal subject, the filtered results show relatively uniform variability as a function of age (within the“normal” sample group).
A test for homoscedasticity (see caption to Figure 8.7) carried out for data points above 35 years of age reveals no significant difference in variability within this range.
Subjects eliminated according to filtering criteria that remain within the established normal limits
3
A B
C D
2
1
0
30 40 50 60
Age (years)
Filter description Medical conditions Abnormal fundus Asymmetry
Normal healthy subjects Normal healthy subjects
70 80 90
RG thresholds
3
2
1
0
30 40 50 60
Age (years)
70 80 90
YB thresholds
3
2
1
0
20 30 40 50
Age (yrs)
60 70
RG thresholds
3
2
1
0
20 30 40 50
Age (yrs)
60 70
[image:10.550.72.461.85.338.2]YB thresholds
8
A 80
40
0
80
40
0
0 15 30 45 60 75 90
0 15 30 45 60 75
Age (yrs)
Age (yrs) Age (yrs)
90
Freq. count
Freq. count
Freq. count
6
4
RG thresholds (CAD units)
2
0
8
6
4
YB thresholds (CAD units)
2
0
0 15
C
Age dependence of binocular CAD threshold limits (±2.5σ)
30 45 60 75 90
D B
Age (yrs)
0 15 30 45 60 75 90
60
45
30
15
0
Freq. count
60
45
30
15
0
−1 −0.5 0 0.5 1
−1 −0.5 0 0.5 1 443 eyes
[image:11.550.88.471.89.211.2]456 eyes
Figure 8.7 RG (panels A and B) and YB (panels C and D) binocular thresholds as a function of age for all the subjects examined in the study and deemed to have normal color vision. Conversion from monocular to binocular thresholds was carried out by using the mean monocular to binocular ratio measured in 57 subjects with normal color vision. Best eye monocular to binocular ratios were calculated with means (μ) and standard deviations (σ) of 1.29 and 0.16 for RG and 1.3 and 0.18 for YB color vision, respectively. The ratios of right and left eye thresholds were 1.03 (RG) and 1.02 (YB), neither being significantly different from unity. The histograms (panels B and D) plot the differences between the measured RG and YB thresholds (in CAD units) and the corresponding mean values derived from the best-fit functions (black, dotted lines).
Thefiltered results show significant, but relatively uniform variability in color thresholds as a function of age within normal trichomats. Koenker’s test for homoscedasticity (Koenker, 1981) carried out for data points within age range 35–75 years confirmed this observation (Ho-true,p= .224,n= 270).
The mean binocular thresholds as a function of age are given by: RGbin= 0.698 + 0.0121 * age + 3.373 * exp (−0.19 * age) and YBbin= 0.24 + 0.0218 * age + 2.99 * exp (−0.1136 * age). The corresponding monocular thresholds are given by: RGmon= 0.901 + 0.0156 * age + 4.351 * exp (−0.19 * age) and YBmon= 0.306 + 0.0283 * age + 3.889 * exp (−0.1136 * age).
Comparison with other studies
The comparison is restricted to key studies that attempted to quantify color thresholds as a func-tion of age in a way that can be traced back to the CIE (x,y) chromaticity chart.
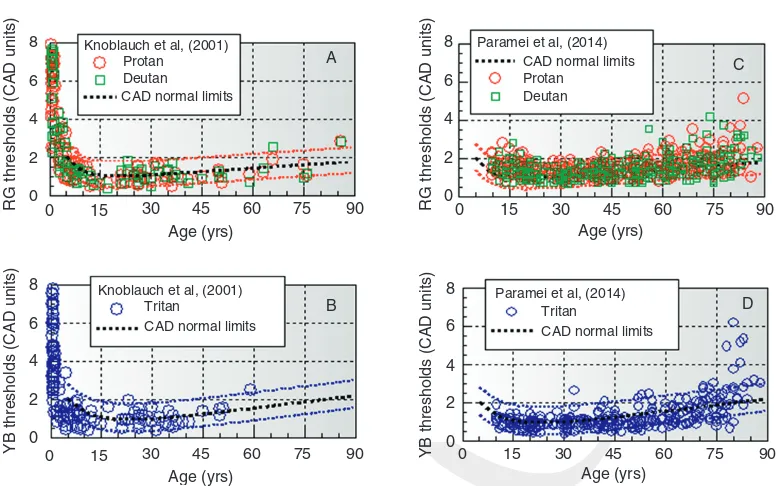
One of the most extensive studies with emphasis on infant vision (Knoblauchet al., 2001) measured thresholds along the deutan, protan, and tritan color confusion axes, using either the two-alternative or the forced-choice, preferential-looking techniques (Vital-Durand, 1996), depending on age. The “BabyCol”test used in this study also employed dynamic LC noise to isolate the use of color sig-nals. Very young subjects show large thresholds with a rapid increase below 5 years. The thresholds measured along the deutan and protan directions were very similar and are shown together in Figure 8.8A. As age increases, all color directions show similar and gradual improvement until
adolescence, only to increase steadily afterwards over the remaining life span. The Knoblauch results shown in Figure 8.8A and Bfit remarkably well within the new CAD limits reported here in spite of differences in visual stimuli and the use of the two-alternative and the preferential looking techniques. Unlike Knoblauch et al.’s study, which focused mostly on young subjects, the majority of subjects examined in this study were older subjects (above 40 years of age).
More recently, Paramei and Oakley also measured thresholds for displacement directions along the protan, deutan, and tritan lines, using the Cambridge Colour Test (CCT) (Paramei and Oakley, 2014). From a total of 423 subjects, 291 were selected for the study following a number of exclusion criteria which included self-reported congenital deficiency, known history of ocular/ retinal disease, cataract, diabetes, and known neurological diseases. The measurements were 8 Knoblauch et al, (2001)
Knoblauch et al, (2001)
Paramei et al, (2014)
Paramei et al, (2014) CAD normal limits Protan
Deutan
Tritan Tritan
CAD normal limits CAD normal limits
Protan Deutan CAD normal limits
A C
D B
6
4
2
0
0 15 30 45 60
Age (yrs)
75 90 0 15 30 45 60
Age (yrs)
75 90
0 15 30 45 60
Age (yrs)
75 90
0 15 30 45 60
Age (yrs)
75 90
RG thresholds (CAD units)
8
6
4
2
0
RG thresholds (CAD units)
8
6
4
2
0
YB thresholds (CAD units)
8
6
4
2
0
[image:12.550.73.463.80.323.2]YB thresholds (CAD units)
carried out binocularly with the CCT test, which employs static patterns of disks that vary ran-domly in size and luminance. The stimulus was a Landolt C defined by color with the gap position randomly placed at one of four locations on the ring: top, bottom, left, or right. Thresholds were measured in the CIE 1976 (u’,v’) space, unidir-ectionally along each of the three color confusion axis, using a four-alternative, forced-choice procedure. The data of Paramei and Oakley were converted to CAD units and are shown in Figure 8.8C and D. Given the large differences in stimulus conditions and measurement proce-dures, the results turned out to be very similar, with much of the data within the reported CAD limits. The results exhibited the features observed in previous studies with an initial improvement in thresholds with increasing age into adolescence, followed by a gradual increase over the remain-ing life span. One noticeable difference is the somewhat greater variability with increased scat-ter particularly for subjects above 60 years.
Combined normative data for RG and YB color vision have also been obtained in a number of different studies using the F–M 100-hue test (Kinnear and Sahraie, 2002; Knoblauch et al, 1987; Verriest, 1963). Of particular interest is the study by Kinnear and Sahraie based on total error scores measured in 382 normal subjects. The age range covered was 5 to 79 years. The subjects selected for the study had normal color vision as assessed by the Ishihara test plates. Performance on this test is estimated by calculat-ing the square root of the totalffiffiffiffiffiffiffiffiffi “error score”,
TES
p
, a parameter that follows approximately a normal distribution (Kinnear, 1970). The best performance on the F–M 100-hue test was for subjects ~20 years of age, in agreement with the CAD results and the remaining studies. In order to compare the reported F–M 100-hue test scores with mean CAD thresholds, thepffiffiffiffiffiffiffiffiffiTESindex was normalized with respect to the average best scores measured for subjects between 18 and 22 years of age. The dashed, gray line in
Figure 8.7A and B plots the normalizedpffiffiffiffiffiffiffiffiffiTES index for direct comparison with the mean CAD thresholds. Since the F–M 100-hue test measures the subject’s ability to discriminate small hue differences along a closed contour in the chroma-ticity chart (as a combined measure of the sub-ject’s RG and YB sensitivity), we may be justified in expecting some correlation with the subject’s RG and YB thresholds.
The results are in remarkably good agreement, although some small differences remain, particu-larly for subjects below 10 years of age, who show a more rapid increase in the pffiffiffiffiffiffiffiffiffiTESindex with decreasing age. Although CAD predictions for RG and YB thresholds extend down to 5 years of age, the predicted thresholds for young sub-jects may not be as reliable as for the older group, simply because of the small number of young subjects investigated. On the other hand, the mean CAD thresholds down to 5 years of age are in good agreement with the Knoblauch et al. (2001)findings, a study with many more subjects in this age group. Performance on the F–M 100-hue test may also be affected by other factors such as the subject’s non-verbal IQ (Hurlbert et al., 2011). Further findings from Cranwell, Pearce, Loveridge, and Hurlbert (2013) (pub-lished abstract and paper presented at the 22nd Symposium of the International Colour Vision Society, Winchester, UK, 2013) suggest that in addition to chromatic discrimination sensitivity, performance on the F–M-100-hue test may also reflect intellectual and attentional ability (as cap-tured by the subject’s non-verbal IQ); hence, measures of threshold discrimination that do not relate directly to IQ are likely to provide a more accurate estimate of chromatic sensitivity.
Processes that may contribute
to color vision changes in normal
aging
stimulus parameters employed and the difficulties of the tasks designed to measure chromatic sen-sitivity, the results are in good agreement and confirm the rapid increase in sensitivity as one approaches adolescence and the gradual, linear trend that describes the loss of sensitivity over the remaining years. The improvement in visual sensitivity affects equally both RG and YB chro-matic mechanisms, is rapid during thefirst year of life, and continues during the next few years into adolescence. The best chromatic detection sensitivity corresponds to ~20 years of age. This is somewhat late given the earlier maturation of the retina and that the neural connections between the visual cortex and related areas of the brain that are needed for optimum vision are usually established during the first 5 to 6 years of life (Graven, 2004; Tucker and Fitzpatrick, 2004)). The gradual improvement in sensitivity may well reflect small contributions that can be attributed to a number of factors including improvements in attentional ability and overall performance. The second phase must be linked to aging processes and is likely to involve physiological changes that also follow a gradual, linear trend. As discussed in the introduction, small changes in the optics of the eye that affect the quality of the retinal image, and even the absorption of short wavelength light by the lens and the macular pigment, seem to have little effect on chromatic sensitivity when the task is to measure color-detection thresholds with large stimuli against a background of high luminance. This is a great advantage since, unlike achromatic contrast sensitivity, which can be strongly affected by the optics of the eye, increased RG and YB color thresholds are more indicative of acquired retinal and/or systemic disease.
Color vision relies largely on normal cone signals and the integrity of the retina and visual pathways. Rod photoreceptor density in central vision declines by as much as 30% over a life-time, but cone density is less affected (Curcio, Millican, Allen, and Kalina, 1993)), although phototransduction efficiency may not remain
constant over the life span. The number of RGC axons is known to decrease linearly by as much as 40% over the life span (Johnson, Miao, and Sadun, 1989; Jonas, Schmidt, Muller-Bergh, Schlotzer-Schrehardt, and Naumann, 1992; Neufeld and Gachie, 2003). Although more diffi -cult to count in older eyes, RGC cell body loss also increases gradually in normal aging, although this obvious expectation remains some-what equivocal (Calkins, 2013). The loss of RGC axons has been estimated in several studies to approach 0.5% per year (Jonas et al., 1990), although lower rates have also been reported (Balazsiet al.,1984; Repka and Quigley, 1989). Loss of myelinated axons and alterations or breakdown in the spatial distribution of myelin in nervefibers in the deeper layers of the visual cortex have been linked to impairment in cogni-tion, which, in turn, affects visual processing (Peters, Moss, and Sethares, 2000, 2001). Structural changes in the cortex caused by aging tend to affect other myelinated structures of the brain such as the axons of fibers in the fornix (Peters et al., 2010) and are indicative of increased susceptibility to diminished metabolic resources with aging (Calkins, 2013).
thresholds above 40 years of age. If the loss of RGC axons during the life span accounts for much of the increase in RG and YB thresholds observed in normal aging, accelerated loss of RGC axons and cell bodies as documented in glaucoma (Marvasti, Tatham, Zangwill, Girkin, Liebmann, Weinreb, and Medeiros, 2013]) may be directly linked to the corresponding increase in color thresholds that has also been shown to depend on retinal topography (Rauscher et al., 2013). Further work is needed to establish whether the severity of localized RG and YB color loss in glaucoma can be used to estimate directly the percentage of ganglion cells lost or the rate of progression in glaucoma.
Conclusions
Both RG and YB color thresholds decrease rapidly with increasing age during thefirst year of life with a more gradual decrease that con-tinues into adolescence. The smallest thresholds correspond to ~20 years of age and define the SN CAD units. Above this age, thresholds increase linearly at a rate of ~1% per year for RG and ~1.6% for YB over the remaining life span. The loss of myelinated RGC axons and cell bodies with increasing age follows a similar trend and may account, at least in part, for the observed loss of chromatic sensitivity. The establishment of reliable upper threshold limits for RG and YB color vision may have important clinical applica-tions by enabling the detection of the earliest signs of acquired loss of chromatic sensitivity and hence the presence of anatomical and phy-siological changes other than those attributable to normal aging. These limits also enable the devel-opment of optimized, rapid screening procedures for normal color vision.
Acknowledgements
We thank Ken Knoblauch, Galina Paramei, and Anya Hurlbert for their constructive criticism
and valuable pointers in relation to this chapter and earlier studies. We also wish to thank Arjan Keuken for collecting the data from Damme Optometrie Practice in the Netherlands and for his significant contribution to our aging studies. We acknowledge the Colt Foundation (UK) and the UK Civil Aviation Authority for supporting the color-vision studies at City University London.
References
Balazsi, A. G., Rootman, J., Drance, S. M., Schulzer, M., and Douglas, G. R. (1984). The
effect of age on the nervefiber population of the
human optic nerve.American Journal of
Ophthalmology,97, 760–6.
Barbur, J. L., Harlow, J. A., and Williams, C. (1997). Light scattered in the eye and its effect on the measurement of the colour constancy index. In
C. R. Cavonius (ed.),Colour Vision Deficiencies
XIII(pp. 439–48). Dordrecht: Kluwer Academic.
Barbur, J. L., Konstantakopoulou, E., Rodriguez-Carmona, M., Harlow, J. A. Robson, A. G., and Moreland, J. D. (2010). The Macular Assessment
Profile Test–a new VDU-based technique for
measuring the spatial distribution of the macular
pigment, lens density and rapidflicker
sensitivity.Ophthalmic and Physiological Optics,
30, 470–83.
Barbur, J. L., and Rodriguez-Carmona, M. (2012). Variability in normal and defective colour vision: consequences for occupational environments. In
J. Best (ed.),Colour Design(pp. 24–82).
Cambridge: Woodhead.
Barbur, J. L., Rodriguez-Carmona, M., and Harlow, J. A. (2006). Establishing the statistical
limits of“normal”chromatic sensitivity. Ottawa:
CIE Publication x030:2006.
Barbur, J. L., Rodriguez-Carmona, M., and
Morgan, M. J. (2002).“Double-blindsight”in
human vision.Investigative Ophthalmology and
Visual Science,43, E-abstract 3909.
Birch, J. (2008). Performance of colour-deficient
people on the Holmes–Wright lantern (type A):
standards in aviation.Ophthalmic and Physiological Optics,28, 253–8.
Birch, J., Barbur, J. L., and Harlow, J. A. (1992). New method based on random luminance masking for measuring isochromatic zones using high
resolution colour displays.Ophthalmic and
Physiological Optics,12, 133–6.
Bronson-Castain, K. W., Bearse, M. A., Jr., Neuville, J., et al. (2012). Early neural and vascular changes in the adolescent type 1 and type 2 diabetic retina. Retina,32, 92–102.
Calkins, D. J. (2013). Age-related changes in the visual
pathways: blame it on the axon.Investigative
Ophthalmology and Visual Science,54,
ORSF37–41.
Chaparro, A., Stromeyer, C. F., III, Huang, E. P., Kronauer, R. E., and Eskew, R. T. (1993). Colour
is what the eye sees best.Nature,361, 348–50.
Chylack, L. T., Jr., Wolfe, J. K., and Friend, J.,et al.
(1993). Quantitating cataract and nuclear brunescence, the Harvard and LOCS systems. Optometry and Vision Science,70, 886–95. Cranwell, M. B., Pearce, B., Loveridge, C., and
Hurlbert, A. (2013). Performance on the
Farnsworth–Munsell 100-hue test is significantly
related to non-verbal IQ. Poster presented at the 23rd Symposium of the International Colour
Vision Society, 14–17 July, Winchester, UK.
Curcio, C. A., and Drucker, D. N. (1993). Retinal
ganglion cells in Alzheimer’s disease and aging.
Annals of Neurology,33, 248–57. Curcio, C. A., Millican, C. L., Allen, K. A., and
Kalina, R. E. (1993). Aging of the human photoreceptor mosaic: evidence for selective vulnerability of rods in central retina. Investigative Ophthalmology and Visual Science,34, 3278–96.
Enoch, J. M., and Werner, J. S., Haegerstrom-Portnoy, G., Lakshminarayanan, V., Rynders, M. (1999). Forever young: visual functions not affected or
minimally affected by aging: a review.Journals of
Gerontology. Series A, Biological Sciences and Medical Sciences,54, B336–51.
Feitosa-Santana, C., Paramei, G. V., Nishi, M., Gualtieri, M., Costa, M. F., and Ventura, D. F. (2010). Color vision impairment in type 2 diabetes assessed by the D-15d test and the Cambridge
Colour Test.Ophthalmic and Physiological
Optics,30, 717–23.
Graven, S. N. (2004). Early neurosensory visual
development of the fetus and newborn.Clinics in
Perinatology,31, 199–216.
Haegerstrom-Portnoy, G., Schneck, M. E., and Brabyn, J. A. (1999). Seeing into old age: vision
function beyond acuity.Optometry and Vision
Science,76, 141–58.
Harrison, W. W., Chang, A., and Cardenas, M. G.,et al.
(2012). Blood pressure, vessel caliber, and retinal
thickness in diabetes.Optometry and Vision
Science,89, 1715–20.
Haug, H., Kuhl, S., Mecke, E., Sass, N. L., and
Wasner, K. (1984). The significance of
morphometric procedures in the investigation of age changes in cytoarchitectonic structures of human
brain.Journal für Hirnforschung,25, 353–74.
Hirata, Y., and Nishiwaki, H. (2006). The choroidal circulation assessed by laser-targeted angiography. Progress in Retinal and Eye Research,25, 129–47. Hofer, H., Carroll, J., Neitz, J., Neitz, M., and
Williams, D. R. (2005). Organization of the
human trichromatic cone mosaic.Journal of
Neuroscience,25, 9669–79.
Hurlbert, A., Loveridge, C., Ling, Y., Kourkoulou, A., and Leekam, S. (2011). Color discrimination and
preference in autism spectrum disorder.Journal of
Vision,11, 429.
Johnson, B. M., Miao, M., and Sadun, A. A. (1989). Age-related decline of human optic nerve axon
populations.Age,10, 5–9.
Jonas, J. B., Muller-Bergh, J. A., Schlotzer-Schrehardt, U. M., and Naumann, G. O. (1990).
Histomorphometry of the human optic nerve. Investigative Ophthalmology and Visual Science, 31, 736–44.
Jonas, J. B., Schmidt, A. M., Muller-Bergh, J. A., Schlotzer-Schrehardt, U. M., and Naumann, G. O.
(1992). Human optic nervefiber count and optic
disc size.Investigative Ophthalmology and Visual
Science,33, 2012–18.
Kinnear, P. R. (1970). Proposals for scoring and
assessing the 100-hue test.Vision Research,10,
423–33.
Kinnear, P. R., and Sahraie, A. (2002). New
normal observers for each year of age 5–22 and for
age decades 30–70.British Journal of
Ophthalmology,86, 1408–11.
Knoblauch, K., Barbur, J. L., and Vital-Durand, F. (1995). Development and aging of chromatic
sensitivity.Investigative Ophthalmology and
Visual Science,36(4), S910.
Knoblauch, K., Saunders, F., and Kusuda, M.,et al.
(1987). Age and illuminance effects in the
Farnsworth–Munsell 100-hue test.Applied
Optics,26, 1441–8.
Knoblauch, K., Vital-Durand, F., and Barbur, J. L. (2001). Variation of chromatic sensitivity across
the life span.Vision Research,41, 23–36.
Koenker, R. (1981). A note on studentizing a test for
heteroscedasticity.Journal of Econometrics,
17(1), 107–12.
Marvasti, A. H., Tatham, A. J., and Zangwill, L. M., et al. (2013). The relationship between visualfield index and estimated number of retinal ganglion
cells in glaucoma.PLoS ONE,8, e76590.
Neitz, J., and Neitz, M. (2011). The genetics of normal
and defective color vision.Vision Research,51,
633–51.
Neitz, M., Carroll, J., Renner, A., Knau, H., Werner, J. S., and Neitz, J. (2004). Variety of genotypes in males diagnosed as dichromatic on a
conventional clinical anomaloscope.Vision
Neuroscience,21, 205–16.
Neufeld, A. H., and Gachie, E. N. (2003). The inherent, age-dependent loss of retinal ganglion cells is
related to the lifespan of the species.Neurobiology
of Aging,24, 167–72.
Owsley, C. (2011). Aging and vision.Vision Research,
51, 1610–22.
Panda-Jonas, S., Jonas, J. B., and Jakobczyk-Zmija, M. (1996). Retinal pigment epithelial cell count, distribution, and correlations in normal human eyes. American Journal of Ophthalmology,121, 181–9. Paramei, G. V., and Oakley, B. (2014). Variation of
color discrimination across the life span.Journal
of the Optical Society of America. A, Optics, Image Science, and Vision,31, A37584. Peters, A., Moss, M. B., and Sethares, C. (2000).
Effects of aging on myelinated nervefibers in
monkey primary visual cortex.Journal of
Comparative Neurolology,419, 364–76.
(2001). The effects of aging on layer 1 of primary
visual cortex in the rhesus monkey.Cerebral
Cortex,11, 93–103.
Peters, A., Sethares, C., and Moss, M. B. (2010). How
the primate fornix is affected by age.Journal of
Comparative Neurolology,518, 3962–80. Rauscher, F. G., Chisholm, C. M., Edgar, D. F., and
Barbur, J. L. (2013). Assessment of novel binocular colour, motion and contrast tests in
glaucoma.Cell and Tissue Research,353,
297–310.
Regan, B. C., Reffin, J. P., and Mollon, J. D. (1994).
Luminance noise and the rapid determination of
discrimination ellipses in colour deficiency.Vision
Research,34, 1279–99.
Repka, M. X., and Quigley, H. A. (1989). The effect of
age on normal human optic nervefiber number
and diameter.Ophthalmology,96, 26–32.
Rodriguez-Carmona, M., Harlow, J. A., Walker, G., and Barbur, J. L. (2005). The variability of normal trichromatic vision and the establishment of the
“normal”range.Proceedings of 10th Congress of
the International Colour AssociationGranada),
pp. 979–82.
Rodriguez-Carmona, M., Kvansakul, J., Harlow, J. A., Kopcke, W., Schalch, W., and Barbur, J. L. (2006). The effects of supplementation with lutein and/or zeaxanthin on human macular pigment density
and colour vision.Ophthalmic and Physiological
Optics,26, 137–47.
Rodriguez-Carmona, M., O’Neill-Biba, M., and
Barbur, J. L. (2012). Assessing the severity of color vision loss with implications for aviation and
other occupational environments.Aviation, Space
and Environmental Medicine,83, 19–29. Roorda, A., and Williams, D. R. (1999). The
arrangement of the three cone classes in the living
human eye.Nature,397, 520–2.
Squire, T. J., Rodriguez-Carmona, M., Evans, A. D., and Barbur, J. L. (2005). Color vision tests for aviation: comparison of the anomaloscope and
three lantern types.Aviation, Space and
Environmental Medicine,76, 421–9.
Tam, J., Dhamdhere, K. P., Tiruveedhula, P.,et al.
(2012). Subclinical capillary changes in
non-proliferative diabetic retinopathy.Optometry
Tatham, A. J., Meira-Freitas, D., Weinreb, R. N., Marvasti, A. H., Zangwill, L. M., and Medeiros, F. A. (2014). Estimation of retinal ganglion cell loss in glaucomatous eyes with a
relative afferent pupillary defect.Investigative
Ophthalmology and Visual Science,55, 513–22. Tucker, T. R., and Fitzpatrick, D. (2004). Contributions
of vertical and horizontal circuits to the response properties of neurons in primary visual cortex. In
L. M. Chalupa and A. H. Wertheim (eds.),The
Visual Neurosciences(pp. 733–46). Cambridge, MA: MIT Press.
Verriest, G. (1963). Further studies on acquired
deficiency of color discrimination.Journal of the
Optical Society of America,53, 185–95. Vincent, S. L., Peters, A., and Tigges, J. (1989). Effects
of aging on the neurons within area 17 of rhesus
monkey cerebral cortex.Anatomical Record,223,
329–41.
Vital-Durand, F. (1996). An acuity cards cookbook. Strabismus,4, 89–97.
Werner, J. S., Delahunt, P. B., and Hardy, J. L. (2004).
Chromatic-spatial vision of the aging eye.Optical
Review,11, 226–34.
Werner, J. S., Peterzell, D. H., and Scheetz, A. J.
(1990). Light, vision, and aging.Optometry and
Vision Science,67, 214–29.
Werner, J. S., and Steele, V. G. (1988). Sensitivity of human foveal color mechanisms throughout the
life span.Journal of the Optical Society of
America. A,Optics, Image Science, and Vision,5,
2122–30.
Wong, R., Khan, J., Adewoyin, T., Sivaprasad, S., Arden, G. B., and Chong, V. (2008). The ChromaTest, a digital color contrast sensitivity analyzer, for diabetic
maculopathy: a pilot study.BMC