City, University of London Institutional Repository
Citation:
Fassnidge, C. (2018). The Visually-Evoked Auditory Response. (Unpublished Doctoral thesis, City, Universtiy of London)This is the accepted version of the paper.
This version of the publication may differ from the final published
version.
Permanent repository link:
http://openaccess.city.ac.uk/19689/Link to published version:
Copyright and reuse: City Research Online aims to make research
outputs of City, University of London available to a wider audience.
Copyright and Moral Rights remain with the author(s) and/or copyright
holders. URLs from City Research Online may be freely distributed and
linked to.
The Visually-Evoked
Auditory Response
Christopher James Fassnidge
A THESIS SUBMITTED TO THE
DEPARTMENT OF PSYCHOLOGY
CITY, UNIVERSITY OF LONDON
FOR THE DEGREE OF
DOCTOR OF PHILOSOPHY
2
Table of Contents
TABLE OF CONTENTS ... 2
LIST OF FIGURES ... 6
LIST OF TABLES ... 11
ACKNOWLEDGEMENTS ... 12
DECLARATION ... 13
ABSTRACT ... 14
ABBREVIATIONS ... 15
INTRODUCTION ... 16
CHAPTER 1: ... 16
1.1 INTRODUCTION AND THESIS RATIONALE ... 16
1.2 WHAT IS SYNAESTHESIA? ... 18
1.3 TYPES OF SYNAESTHESIA ... 20
1.3.1 Audiovisual Synaesthesias ... 21
1.3.2 Hearing-Motion Synaesthesia ... 23
1.4 DEBATES SURROUNDING SYNAESTHESIA ... 25
1.4.1 Rethinking Synaesthesia ... 25
1.4.2 Is Synaesthesia Dichotomous or Continuous? ... 34
1.4.3 Relationship with Normal Multisensory Integration ... 37
1.4.4 Are Synaesthetic Pairings Environmentally Influenced?... 45
1.5 SUMMARY AND THESIS OUTLINE ... 48
EXPERIMENT 1: THE PREVALENCE, ADVANTAGES, AND PERCEPTUAL REALITY OF VISUALLY-EVOKED SOUNDS. ... 52
3
2.1 INTRODUCTION ... 52
2.1.1 Prevalence of vEAR ... 54
2.1.2 Objective Measures of Visually-Evoked Sounds ... 57
2.1.3 Controlling for bias/sensory dominance ... 58
2.2 HYPOTHESES ... 60
2.3 METHODS ... 62
2.3.1 Participants ... 62
2.3.2 Apparatus and stimuli ... 62
2.3.3 Design ... 64
2.3.4 Procedure... 65
2.4 RESULTS ... 72
2.4.1 Questionnaire results ... 72
2.4.2 Psychophysical Data ... 75
2.5 DISCUSSION ... 85
2.6 SUMMARY ... 92
EXPERIMENT 2: USING TRANSCRANIAL ALTERNATING CURRENT STIMULATION TO EXPLORE THE NEUROPHYSIOLOGICAL BASIS OF VEAR ... 94
CHAPTER 3: ... 94
3.1 INTRODUCTION ... 94
3.1.1 Cross-activation versus Disinhibition as a Mechanistic Underpinning of vEAR ... 96
3.1.2 Transcranial Electric Stimulation ... 101
3.2 METHODS ... 108
3.2.1 Participants ... 108
3.2.2 Apparatus and stimuli ... 109
3.2.3 Design ... 112
3.2.4 Procedure... 113
3.3 RESULTS ... 115
4
3.5 SUMMARY ... 129
EXPERIMENT 3. WHO HEARS VISUAL MOTION, AND WHAT LOOKS LOUDEST? A LARGE-SCALE ONLINE SURVEY ... 132
CHAPTER 4: ... 132
4.1 INTRODUCTION ... 133
4.2 HYPOTHESES ... 136
4.3 METHODS ... 138
4.3.1 Materials and Stimuli ... 138
4.3.2 Participants ... 140
4.3.3 Procedure... 145
4.4 RESULTS ... 152
4.4.1 Demographics ... 152
4.4.2 Crosstabulations ... 155
4.4.3 Visual Stimulus Ratings ... 158
4.4.4 Supplementary Questions ... 167
4.4.5 Stimulus Properties ... 176
4.5 DISCUSSION ... 183
4.6 SUMMARY ... 187
GENERAL DISCUSSION ... 189
CHAPTER 5: ... 189
5.1 OVERVIEW ... 189
5.1.1 Chapter 2 Summary ... 189
5.1.2 Chapter 3 Summary ... 190
5.1.3 Chapter 4 Summary ... 191
5.2 RETURNING TO THE DEBATES FROM CHAPTER 1 ... 192
5.2.1 Neurophysiological Diagnostic Criteria ... 192
5.2.2 Consistency of Inducer-Concurrent Pairings ... 195
5.2.3 Is Synaesthesia Dichotomous or Continuous? ... 196
5
5.2.5 Learning to Attend to vEAR ... 204
5.3 AMODEL TO EXPLAIN VEAR ... 205
5.4 IS VEAR A TYPE OF SYNAESTHESIA?... 208
5.5 DIRECTIONS FOR FUTURE RESEARCH ... 210
5.6 CONCLUSION ... 213
REFERENCES ... 215
APPENDICES ... 237
APPENDIX 1: ... 237
6
List of Figures
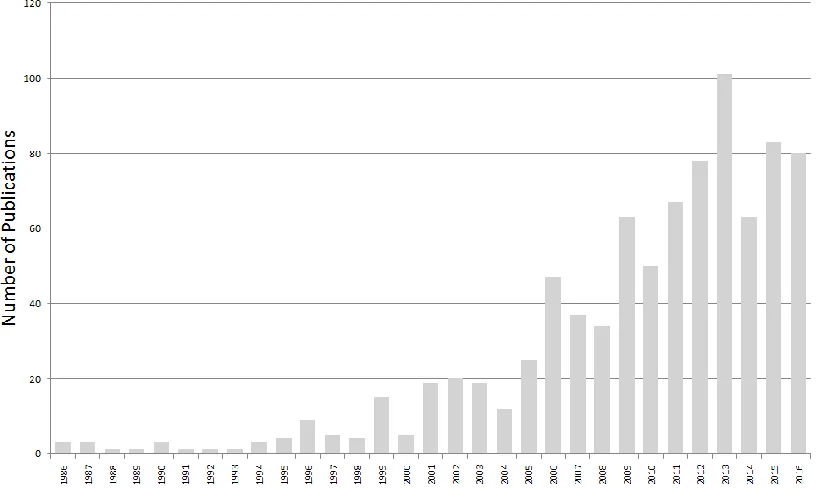
Figure 1-0-1: Published synaesthesia research per year 1996-2016. ... 20
Figure 1-0-2: Acoustically induced synesthetic photisms of three individual synaesthetes. ... 22
Figure 1-0-3: Model of relationship between synaesthesia and cross-modal correspondences. . 42
Figure 2-1: Visual vs. Auditory Sequence discrimination Accuracy replotted from Saenz & Koch (2008). ... 56
Figure 2-2: An example of a same vs. a different trial on the sequence discrimination. ... 66
Figure 2-3: An example of an audiovisual (above) vs. an auditory (below) trial on the Auditory Detection Task. ... 69
Figure 2-4: Trial types on the Colavita Visual Dominance Task. An example of a Visual, Auditory and Bimodal trial, plus the classic Colavita effect of missed Auditory responses on Bimodal trials. ... 71
Figure 2-5: Mean d’ sensitivity for Visual vs. Auditory sequence discrimination. Grouped by responses to the question ‘Did you hear faint sounds when you saw flashes?’ ... 76
Figure 2-6: Distribution of auditory advantage (relative to visual performance) on the Sequence Discrimination Task. Scores are computed by subtracting visual sequence discrimination d’ score from auditory equivalent d’ score. ... 78
Figure 2-7: Mean criterion scores for visual and auditory sequence discrimination, by whether participant heard flashes. ... 79
Figure 2-8: Results of sequence discrimination, Auditory Detection Tasks, with correlation. ... 82
Figure 3-1: The Cross-activation Model. This suggests that vEAR is the result of an excess of cortical connections between visual and auditory areas. ... 96
Figure 3-2: The Disinhibition Model. This suggests that vEAR is the result of greater levels of disinhibition (thickness of line) in otherwise normal connections between visual and auditory areas. ... 97
7
Figure 3-4: Different stimulation paradigms. ... 103
Figure 3-5: Physiological mechanisms of TACS. ... 104
Figure 3-6: Modulation of the Double Flash illusion with TACS reported by Cecere, Rees, & Romei (2015), reproduced from Kerlin & Shapiro (2015). ... 107
Figure 3-7: TACS Stimulation Sites. ... 111
Figure 3-8: Stacked bar charts illustrating relative proportions of participants in different groups. ... 116
Figure 3-9: Effects of tACS on d’ sensitivity (relative to sham stimulation) to differences in visual (V) or auditory (A) sequences, relative to sham, or two occipital versus temporal electrode montages (dark and light grey respectively). Positive values indicate an improvement due to tACS. Error bars show standard error; asterisks and horizontal brackets show significant differences (p<.05, Tukey comparisons). Left graph represents participants who did not report visually-evoked auditory sensations (N=21) evoked by the flashes in the visual sequence discrimination condition. Right graph is for participants (mostly musicians) who did report visually-evoked auditory sensations (N=15). ... 119
Figure 3-10: Scatterplot of effects of tACS electrode montage on d’ sensitivity (relative to sham stimulation). Separate colours for Visual (dark blue) and Auditory (light yellow) sequence discrimination tasks. Separate graphs for participants who did not report hearing flashes (left) and who did (right). Pearson correlation statistics shown in legend. ... 120
Figure 3-11: The effect of TACS in participants who did not experience vEAR ... 123
Figure 3-12: Mutual inhibition of the visual and auditory cortices carried by alpha Oscillations in participants who do not experience vEAR. ... 125
Figure 3-13: Alpha-band TACS (black line) applied to one cortex biases these inhibition in favour of the unstimulated region of cortex in participants who do not experience vEAR. ... 125
Figure 3-14: Less inhibition between cortices in participants who experience vEAR. ... 126
Figure 3-15: Alpha-band TACS applied to one cortex has little effect as there is less intercortical inhibition in those who experience vEAR. ... 126
Figure 4-1: Hammer swings, strikes TV Screen, Screen smashes and spins right with the impact. ... 138
8
Figure 4-3: Ballet dancer performs pirouette (leg is elevated, dancer spins, arm is lifted) ... 139
Figure 4-4: Blue lights flicker and move in a ripple formation ... 139
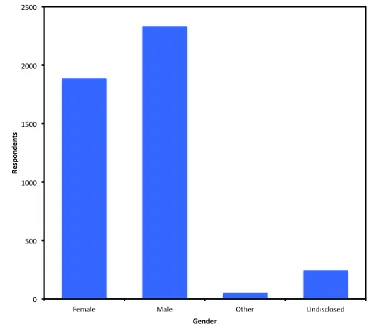
Figure 4-5: Bar chart depicting gender breakdown of respondents. ... 143
Figure 4-6: Geographical location of questionnaire respondents who completed all items. ... 144
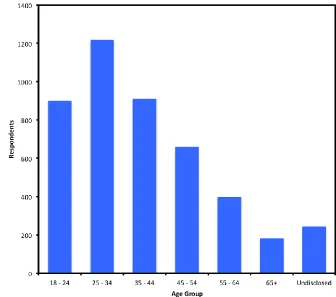
Figure 4-7: Bar graph age breakdown of respondents. ... 144
Figure 4-8: Stimulus rating screen with presentation window and Likert scale ... 147
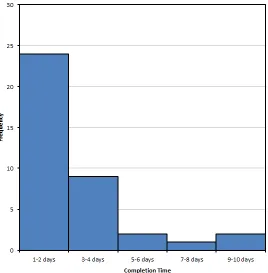
Figure 4-9: Breakdown of Questionnaire Completion Times in Minutes ... 150
Figure 4-10: Breakdown of Questionnaire Completion Times in Hours ... 151
Figure 4-11: Breakdown of Questionnaire Completion Times in Days ... 151
Figure 4-12: Percentages of respondents who identified as synaesthetes. ... 154
Figure 4-13: Percentages of respondents who were previously aware of hearing visual events. ... 154
Figure 4-14: Proportions of respondents who report previous awareness of vEAR split by regularity of musical imagery experience. ... 156
Figure 4-15: Proportions of respondents who report previous awareness of vEAR split by prior experience of hypnagogic phosphenes. ... 156
Figure 4-16: Proportions of respondents who report previous awareness of vEAR split by experience of tinnitus. ... 157
Figure 4-17: Proportions of respondents who report previous awareness of vEAR split by experience of synaesthetic associations ... 157
Figure 4-18: Bar chart depicting the mean scores of all participants ranked from lowest to highest rating ... 161
Figure 4-19: Mean rating (out of a possible 0-5) for each video stimulus broken down by previous awareness of hearing visual events, sorted from low to high vEAR rating. ... 162
9
Figure 4-21: Mean video rating by identification as a synaesthete. ... 165
Figure 4-22: Participants rated the videos as evoking more vEAR in proportion to the certainty with which they reported previous awareness of experiencing vEAR. Those who responded ‘yes’ rated the videos higher, meaning greater vEAR, compared to those who responded ‘no’ experiencing the least. ... 166
Figure 4-23: Mean ratings declined with age irrespective of whether participants were previously aware of hearing visual events, but the between group differences persisted across age groups. ... 167
Figure 4-24: Mean item ratings broken down by participants’ report of hearing visual events in daily life. Ratings increase significantly in proportion to their certainty of experiencing daily vEAR-like sensations. ... 169
Figure 4-25: Mean item ratings broken down by participants’ experience of sensory pairings typical of synaesthesia. Ratings increase significantly in proportion to participants’ experience of cross-modal sensory pairings. ... 171
Figure 4-26: Mean video ratings by experience of hypnagogic auditory-induced phosphenes. 172 Figure 4-27: Mean video rating by experience of tinnitus ... 174
Figure 4-28: Mean video rating by frequency of musical imagery experience ... 175
Figure 4-29: Pareto plot depicting results of PCA. Bars displays a scree plot indicating two major PCs. Line indicate proportion of the data explained by each PC. The scree flattens out after third PC. ... 177
Figure 4-30: Each video plotted by coefficient of PCs 1 and 2. ... 178
Figure 4-31: Questionnaire items ranked by coefficient for Principle Component 1. ... 179
Figure 4-32: Questionnaire items ranked by coefficient for Principle Component 2. ... 179
Figure 4-33: Mean video ratings split by high/low ME and previous awareness of vEAR (yes/no) ... 181
Figure 4-34: Averaged ratings for each video reconstructed from PC2: Only strong correlation is with those who report previous awareness of hearing visual events. ... 182
10
5-1: A model of vEAR. In this model dynamic visual stimuli are processed both via the normal higher-level route. Dashed line represents common sensory cross-talk that is largely ubiquitous, while solid line may be unique to those who experience vEAR. ... 208
11
List of Tables
Table 2-1: Results of the debrief questionnaire. ... 73
Table 3-1: Mean sequence discrimination sensitivity (d’) for visual and auditory task broken down by stimulation site and type (active vs. sham), with standard error. ... 117
Table 4-1: Age and gender breakdown of questionnaire respondents ... 142
Table 4-2: Percentages of respondents who identify as syneasthetes and/or were previously aware of experiencing vEAR. ... 153
Table 4-3: Mean rating (out of a possible 0-5) and standard deviation for each questionnaire item ... 160
12
Acknowledgements
I would like to thank all of the people who supported me throughout my research. First my family,
for all the love and support and especially to Harrison and Olivia for making me laugh like no one
else. Thank you to my friends, and all the fellow PhD students here at City, especially Ali, Iro, and
Maciej who gave me endless moral, practical and emotional support. I would also like to thank
Kielan for his many sage words over the years. I must also acknowledge the hard work of the
various students and volunteers who aided me in data collection, Adam, Andreana, Anthony,
Claudia, Danny, Sylwia, Synøve, and Zainab. Thank you also to Kinga and to Cara for keeping me
sane in these final months of write-up. Finally, my supervisor Dr Elliot Freeman for all his patience,
13
Declaration
I grant powers of discretion to the University Librarian to copy this thesis in part or in whole
without further reference to me. This covers only single copies for study purposes. The contents
of this thesis are subject to normal conditions of acknowledgement. The content of this thesis is
14
Abstract
In synaesthesia a sensation in one modality triggers a consciously perceived sensation in another
sensory modality or cognitive domain. In this thesis we investigate auditory sensation that are
induced by dynamic visual stimuli, akin to hearing-motion synaesthesia (Saenz and Koch, 2008).
We term this the Visually-Evoked Auditory Response (vEAR). We first establish the prevalence of
vEAR in a random sample, with questionnaire responses indicating a higher prevalence (as many
as 1 in 5) than canonical synaesthesias. We report that those who experience vEAR showed better
performance compared to controls when discriminating between ‘Morse-code’ style rhythmic
sequences in the visual domain, as did Saenz and Koch (2008). We also demonstrate that vEAR is
perceptually real enough to interfere with hearing real world sounds. We then demonstrate that
in control subjects Transcranial Alternating Current Stimulation (TACS), when applied over the
temporal versus the occipital lobes, impairs auditory versus visual sequence discrimination
respectively. However, temporal TACS improved visual and occipital TACS improved auditory
sequence discrimination performance. This suggests the presence of normally-occurring mutual
alpha-mediated competitive inhibition of the two cortices. This TACS effect was not seen in
individuals with vEAR, indicating that their auditory and visual cortices are able to cooperate to
perform the task despite disruption from TACS. Finally, we investigate the types of visual stimuli
that best evoke vEAR, and the types of people who tend to experience it. We conducted a large
online survey in which respondents rated the amount of vEAR evoked by a series of silent videos
depicting types of motion. The predictiveness of a real-world sound was identified as a major
contributor to ratings in all respondents, while motion energy (raw changes in light over space
and time) specifically influenced ratings in those who experience vEAR. We also report
demographic and trait questions relating to auditory perception that predict higher ratings,
including the frequency one experiences music imagery in their head, or whether they have
tinnitus or types of synaesthesia. We conclude that vEAR results from both high and low-level
connectivity between the visual and auditory cortices and an atypical inhibition of these
15
Abbreviations
A: Auditory
AV: Audiovisual
SD: Standard Deviation
SPL: Sound Pressure Level
TACS: Transcranial Alternation Current Stimulation
V: Visual
16
Introduction
Chapter 1:
This chapter presents a brief outline of what synaesthesia is and outlines some of its
variations. We present some contemporary debates in the literature including the role
of learning in the specific sensory pairings experienced by synaesthetes, and the extent
to which synaesthesia is expressed as a spectrum throughout the population as
opposed to as a discrete continuous phenomenon. We highlight a relatively unknown
form of synaesthesia in which flashes of light or moving visual objects are perceived
with a concurrent sound and provide a plausible explanation for why this
phenomenon, which we term the visually-evoked auditory response (vEAR), may be
more prevalent in the population than other types of synaesthesia. Finally, we outline
the aims of this thesis, which include i) establishing an estimate of the prevalence of
vEAR, ii) exploring how perceptually real the visually-evoked sounds are to the
individual, iii) investigating the neurophysiological mechanisms that may underlie the
experience of vEAR and iv) examining what properties of a visual stimulus best evoke
vEAR.
1.1
Introduction and Thesis Rationale
This thesis explores a little-known phenomenon that may potentially be type of synaesthesia, in
which individuals perceive illusory auditory sensations when viewing dynamic visual stimuli such
as moving objects or flashing lights. Prior to our research there was has been only one empirical
report of this phenomenon in the literature (Saenz & Koch, 2008), and an incidental reference to
it in another (Guttman, Gilroy & Blake, 2005). Despite this scarcity of research, anecdotal reports
of this phenomenon can be found in the online and offline community of synaesthetes. Having
17
they tend to describe these visually-evoked auditory sensations as sounding like white noise or
‘whooshing’ sounds that accompany various types of visual motion, but some also report hearing
spoken words accompanying lip movements when viewing muted televisions, or the footsteps of
an individual walking in the distance out of earshot. Here we first use a combination of objective
psychophysical tasks and subjective questioning in order to estimate how common this
phenomenon is, as there has been no reported population prevalence of this particular variation
of the condition to date. We then explore how perceptually real these visually-evoked auditory
sensations are relative to externally originating sounds, and whether the two sets of auditory
signals can interfere with one another. Next, we explore individual differences between those
who experience these visually-evoked auditory sensations relative to those who do not, using
transcranial electric stimulation to infer neurophysiological differences between the two groups,
that could plausibly provide a cortical aetiology for the illusory auditory sensations. Finally, we
explore the types of stimuli that best evoke these auditory sensations, with reference to both the
physical and learned associative properties of the stimulus. We conclude by outlining what we
believe is a plausible model to explain this unusual phenomenon, encompassing all our
experimental findings with support from existing literature. The implications of our findings are
discussed in the context of several contemporary discussions in the synaesthesia literature and
questions for future research are addressed, as well as whether the visually-evoked auditory
sensations described here strictly meet the criteria to be classified as a sub-type of synaesthesia,
or whether they are likely to be a related yet distinct phenomenon.
In the following chapter we shall introduce the phenomenon of synaesthesia and briefly outline
sub-18
type in which dynamic visual stimuli induce auditory sensations in the perceiver. We shall then
introduce some contentious debates that exist in the field of synaesthesia research with reference
to how our research can contribute to these on-going debates. Finally, we shall introduce some
of the specific questions that this thesis will set out to address.
1.2
What is Synaesthesia?
Synaesthesia, from the Greek syn, (meaning together, a joining or union) and aesthesis (of or from
the senses), is a perceptual anomaly whereby stimulation in one sensory modality, typically
referred to as the inducer, leads to consistent and involuntary sensations in another sensory
modality (or a separate property of the inducer modality), known as the concurrent
(Grossenbacher, 1997). Although the defining criteria for synaesthesia vary somewhat in the
literature (see Simner, 2012) there is a core set of components that are typically used to define
the phenomenon. For example, the experience occurs automatically (Ward and Mattingley,
2007), requiring no conscious effort to perceive the concurrent and lacking an ability to ‘turn it
off’. The associations between inducer and concurrent are highly specific and consistent overtime
(Baron-Cohen, Wyke, & Binnie, 1987). Those who experience synaesthesia generally report that
the percepts they experience are perceived in addition to, rather than in place of, their veridical
perception of the world (Simner, 2012; Ward and Simner, 2003), meaning for example a visual
concurrent would not blind them to the true visual scene but would be perceived as an overlay.
Despite this, synaesthetes do not tend to confuse their synaesthetic percepts with real world
objects or sensations (Rich & Mattingley, 2002). Synaesthesia is generally developmental in
19
injury (e.g. Rao et al., 2007), training (Bor et al., 2014), or transiently following ingestion of certain
psychoactive drugs such as psilocybin, LSD and mescaline (Brogard, 2013).
There are scientific reports of synaesthesia dating back more than two centuries (e.g. Galton,
1880, Calkins, 1895 who coined the term, and previously Sachs, 1812), although later advances in
technology and experimental methodologies meant that the latter half of the twentieth century
saw a surge of research activity in this area (see for example Baron-Cohen et al., 1987; Cytowic
and Wood, 1982; Marks, 1975). Today synaesthesia continues to attract a considerable amount
of research interest, not only because it provides a fascinating insight into a group of individuals
who perceive the world in a manner apparently quite alien to the general population, but it also
provides a valuable contribution to our understanding of how the brain integrates information
from the different senses in typical perception. The field of contemporary synaesthesia research
is somewhat diverse, in part due to the remarkable heterogeneity of the condition which gives
rise to a diverse range of inducer-concurrent pairings and substantial variability in the perceptual
vividness of the concurrent sensation (for a review see Ward, 2013). As a result synaesthesia
20
Figure 1-0-1: Published synaesthesia research per year 1996-2016.
(Articles containing the keyword “synaesthesia OR synaesthesia ”). Source: Web of Science
1.3
Types of Synaesthesia
There are many different sub-types of synaesthesia that have been reported, with at least 60 (Day,
2005, 2013) and possibly as many as 150 manifestations of the condition (Cytowic & Eagleman,
2009), and these tend to be named following the convention of combining the inducer and the
concurrent separated by a hyphen (although this convention is not always followed, as in
hearing-motion). For example, one of the more commonly reported variants of the condition is
grapheme-colour synaesthesia (Rich, Bradshaw & Mattingley, 2005; Simner et al., 2005), in which individuals
21
(for example the letter C might always be seen as red, or the number 9 as blue) no matter the true
physical colour of the text. Other variants of the condition include tone-colour synaesthesia,
(Ward, Huckstep & Tsakanikos, 2006) in which sounds, and in particular the frequency of musical
tones, can trigger the sensation of colour, and lexical-gustatory synaesthesia (Ward & Simner,
2003), in which the synaesthete will experience a sensation of taste upon hearing a particular
word. In the latter two examples the inducer-concurrent pairing cross from one sensory modality
into another, while in grapheme-colour synaesthesia they cross different facets of visual
perception, therefore it is not always the case that synaesthesia is strictly a multisensory
phenomenon. In other forms of synaesthesia the inducer-concurrent pairing may blend more
abstract concepts, such as days of the week, with sensory percepts such as colours (Shanon, 1982;
Rich, Bradshaw, & Mattingley, 2005; Simner et al., 2006) or with numbers (Sagiv, Heer, &
Robertson, 2006; Ward & Sagiv, 2007). Others still attribute non-sensory ‘personalities’ to the
inducer, for example letters or numbers that are friendly, angry, or lazy (Day, 2005; Cytowic, 2002;
Simner & Holenstein, 2007; Smilek et al., 2007). Whether these cases are considered as canonical
synaesthesias depends on the definition of synaesthesia that one employs, and no universal
standard has yet been agreed (although some contemporary debates in this area are outlined in
section 1.4).
1.3.1 Audiovisual Synaesthesias
Of the many and varied types of synaesthesia reported to date several feature sensory crossover
from auditory inducers to visual concurrents. The most prominent example of these is
characterised by musical tones inducing visual percepts such as colours or coloured shapes (e.g.
22
Ward, Huckstep, & Tsakanikos, 2006), tone-colour synaesthesia (e.g. Hänggi et al., 2008) or
[image:23.595.105.503.244.525.2]chromesthesia (e.g. Block, 1983).
Figure 1-0-2: Acoustically induced synesthetic photisms of three individual synaesthetes.
23
Those who experience this phenomenon tend to report perceiving a colour in some form, whether
it is explicitly 'seen' in external space before their eyes (See Figure 1-0-2) or a more abstract
'feeling' of a colour, that is consistently triggered by a specific aspect of a sound, usually the
frequency (pitch) but in other cases it can be influenced by factors such as the timbre, the type of
instrument on which the sound is played, etc. In other examples the inducer is a non-musical
sound, such as the human voice (Fernay, Reby, & Ward, 2012; Moos et al., 2013).
1.3.2 Hearing-Motion Synaesthesia
While such sound-to-vision synaesthesias have been widely reported there are very few reported
examples of visual-to-sound synaesthesias to our knowledge, bar a few rare reports of individuals
who hear distinct musical sounds associated with visual colours (Baron-Cohen, Burt,
Smith-Laittan, Harrison, & Bolton, 1996; Goller, Otten, & Ward, 2009). Saenz & Koch (2008) described a
previously unknown 'hearing-motion' synaesthesia in which visual events, such as flashing lights
or dots moving on a screen, induce corollary auditory perceptions (following Guttman, Gilroy, &
Blake, 2006 who had previously noted that individuals may be able to hear the rhythm of visual
flashes). People with this condition report being able to consistently and involuntarily hear these
visual stimuli, thus meeting one of the classical defining features of synaesthesia. In order to
objectively test the veracity of these claimed hearing-motion abilities the authors devised a simple
behavioural task on which performance would be enhanced if an individual possessed such
abilities. This diagnostic test required the perceptual discrimination of paired 'Morse code' like
sequences, presented either as sounds or as flashes. Participants were presented with two
successive rhythmic sequence made up of eight stimuli of differing durations, either short (50 ms)
24
different. On each trial sequences were either both auditory or both visual. Performance with
auditory stimuli was generally high in both synaesthetes and in controls, benefitting from the
greater temporal acuity of the auditory system (Glenberg et al., 1989; Guttman, Gilroy & Blake,
2005). By comparison performance in the visual condition was significantly poorer in the control
group, however individuals who identified themselves as hearing-motion synaesthetes showed
no significant difference in task performance between the two modalities, and significantly better
visual sequence discrimination compared to controls. It was proposed that their visual sequencing
performance benefits from the additional temporal information provided by their concurrent
auditory sensation (Glenberg, et al., 1989; Guttman, Gilroy, & Blake, 2006).
Unlike in some forms of synaesthesia, the mapping of visual events to auditory concurrents could
be considered to be somewhat generic, with participants’ in Saenz and Koch’s (2008) cohort
describing their concurrents as whirring, tapping or beeping sensations, which are markedly less
specific than, for example, instances in which particular graphemes or musical tones induce
specific coloured percepts of a particular hue. Other anecdotal reports from our own lab describe
the auditory sensations as being like a generic ‘white noise’ sound. It is then a matter of debate
as to whether these people truly have synaesthesia in the canonical sense, or are instead
experiencing a closely-related phenomenon. For these reasons we will instead be using the more
agnostic description of the Visually-Evoked Auditory Response (vEAR) rather than the
hearing-motion synaesthesia favoured by Saenz and Koch (2008). In this thesis we will explore whether
this is in fact a normal (or at least a relatively common) sensory phenomenon, establishing the
25
neurophysiological mechanisms that might explain individual differences in the experience of the
condition, as well as the types of visual stimuli that best evoke these auditory sensations.
1.4
Debates Surrounding Synaesthesia
The heterogeneity of synaesthesia raises a number of questions. Here we shall focus on a number
of contemporary debates surrounding synaesthesia and the framework in which we understand
the condition. These include the population prevalence of synaesthesia, what determines the
specific pairings experienced by any given synaesthete, and the extent to which we all experience
synaesthetic percepts in some sense, i.e. whether the condition is a dichotomous phenomenon
that occurs only in a few individuals or whether it is continuous on some level throughout the
population. Does synaesthesia globally share a common mechanistic aetiology, or does the
architecture underlying each case differ somewhat? There is evidence to suggest that individuals
with one form of synaesthesia have a higher probability of also experiencing a second form than
would be the case in the general population (Day, 2005; Rogowska 2011), suggesting that there
may be some common features across different synaesthetic sub-types. Other contemporary
debates are more fundamental in nature, and might force us to re-examine the boundaries that
define precisely what is, and what is not, a type of synaesthesia.
1.4.1 Rethinking Synaesthesia
In a discourse between several researchers, led by Simner (2012), there was an examination of
re-26
evaluated in the light of recent findings, as they were now potentially excessively conservative.
As a result, Simner suggests that characteristics of a subset of synaesthetes have been erroneously
attributed to all synaesthetes and thus interpreted as defining features of synaesthesia. Simner’s
key arguments were:
1. That referring to synaesthesia as a ‘merging of the senses’ is not strictly accurate, as some
involve cognitive or conceptual triggers and/or concurrents.
2. Second that insisting on the long-term consistency of inducer-concurrent pairings over
time as a defining feature of synaesthesia is unnecessary, as it neglects the possibility that
some individuals may experience a less consistent phenomenon that is nevertheless still
perceptually real.
3. Third, Simner argues that the requirement that the induced concurrent qualia necessarily
have a fixed position in external local space is also overly restrictive as many synaesthetes
report, for example, a strong internal ‘feeling’ of a colour associated with a particular
triggering inducer.
4. Finally she argues that a definition that is rooted solely in behavioural criteria is
inadequate, and we should also be using some kind of physiological definition of
synaesthesia, one that outlines one or more biological signatures of synaesthesia, such as
hyper-connectivity between cortices or disinhibition of neural connections.
For each of these four arguments Simner provides supporting evidence from a range of empirical
27
Cohen Kadosh and Terhune (2012), who were broadly supportive of her argument and each of
whom also provided valuable additions to each component of Simner’s argument. We shall now
review the consensus reached in this commentary including the arguments in favour of
reconceptualising synaesthesia as a spectrum rather than a dichotomy. We believe that our work
with vEAR may potentially be pertinent to many of these arguments.
1.4.1.1 Neurophysiological Diagnostic Criteria
Simner suggests that some form of biological criteria should feature in our definition of
synaesthesia, to supplement the behavioural measures currently used. These biological factors
may encompass factors such as atypical levels of connectivity between neighbouring sensory
cortices (Bargary & Mitchell, 2008), or alternatively the overall levels of connectivity may not
underlie the condition but instead atypical levels of disinhibition of this connectivity maybe
observed in synaesthetes (Grossenbacher, 2001; Neufeld et al., 2012). As Eagleman then notes,
connectivity is necessarily spectral rather than all-or-none, meaning that diagnostic criteria along
these lines may be ultimately impractical as it would involve the setting of arbitrary levels of
connectivity beyond which one is considered a synaesthete. Eagleman suggests that there might
be several diverse causes of different sub-types of synaesthesia, analogous to the multiple causes
of deafness, such as inner ear damage, or cranial nerve lesions. Eagleman points to his recent
family-linkage analysis of coloured-sequence synaesthesia (CSS), in which they found a candidate
gene that may underlie CSS. However, this gene was not present in all families in which CSS
appears to run, which suggests that there may be multiple biological pathways to developing CSS.
This would imply that even within a single sub-type of synaesthesia there may be differing
28
as a condition once thought to be homogenous that we now recognise as comprising of different
sub-types and origins. They do however strike a note of caution when it comes to a setting out a
biological definition of synaesthesia, asking for example what then would be the dependent
variable used to diagnose the condition, and how would it/they be operationalised? The fact that
synaesthesia appears to manifest so rarely in the population might be indicative of this being a
dichotomous, all-or-none phenomenon rather than one that can be seen along a spectrum
throughout the population. If this is indeed the case then it is likely that the brains of synaesthetes
are indeed special in some sense, whether in terms of the connectivity between regions or the
excitability of regions pertinent to the qualia experienced by the synaesthete. For example, fMRI
studies have shown that in grapheme-colour synaesthetes, brain areas such as the left lateral
occipital cortex and in postcentral gyrus show a reduced BOLD signal when synaesthetic
experiences are perceived (O’Hanlon, Newell, & Mitchell, 2013), whereas Hubbard et al., (2005)
found an increase in V4 activation when synaesthetes viewed greyscale graphemes that evoke
synaesthetic colour. It is therefore hypothetically possible that given a greater understanding of
these neural idiosyncrasies we could one day identify the brains of a synaesthete based on
physiological markers alone. However it is hard to conceive of a reason, if the dichotomous
account of synaesthesia is valid, that this would be particularly advantageous compared to simply
asking the individual to describe their experiences. As such, any such biological test would serve
to do little more than corroborate the veracity of such claims. If on the other hand we reject this
dichotomy, and accept that synaesthesia may manifest along a spectrum throughout the
population, then it may well make more logical sense to include such physiological descriptions in
defining in strictly mechanistic terms how these phenomena arise. Under this account too it is
difficult to foresee how these physiological markers could be practically used to diagnose
synaesthesia, however, as we are then presented with the uncertainties that fuzzy boundaries
29
potential physiological mechanisms that may explain the experience of vEAR, such as the
disinhibition and cross-activation hypotheses from the synaesthesia literature, in an effort to
explain the phenomenon, but these will not be used in any sense to try and form a diagnostic tool.
In particular, in chapters 3 and 4 we present physiological hypotheses to explain the aetiology of
vEAR that go beyond the diagnostic, and may lead to new discoveries about the
neurophysiological bases of a wide variety of unusual and anomalous forms of perception.
What are the physiological candidates for mechanisms that may underlie vEAR? Previous studies
have identified groups of neurons in the auditory cortex that respond to various types of visual
stimulation from higher areas or from subcortical regions via interconnections found in normal
anatomy (Ghazanfar & Schroeder, 2006; Schroeder & Foxe, 2005). These connections may serve
to aid spatial localisation of sound or alternatively to amplify the auditory response to visually
identifiable sources (Schroeder & Foxe, 2005). Given this normal connectivity, the additional
emergence of a conscious visually-evoked auditory concurrent might thus be readily explained by
individual physiological variations in this connectivity. This variability may include whether these
connections, or their interactions with higher areas, are inhibited or unmasked (Cohen Kadosh et
al., 2009; Cohen Kadosh & Walsh, 2006; Grossenbacher & Lovelace, 2001; Neufeld et al., 2012),
30
1.4.1.2 Non-sensory components of Synaesthesia
As noted in section 1.3, some types of synaesthesia feature an inducer that is a cultural construct,
such as a day of the week, or a cognitive component such as a numerical value, rather than a
strictly sensory stimulus. Delineating between sensory and cognitive inducers becomes more
complicated in sub-types such as grapheme-colour synaesthesia as both the physical form of the
text and the semantic understanding of what the written shapes signify can both potentially be
what triggers the synaesthetic concurrent. Simner (2012) notes that in most cases of
grapheme-colour synaesthesia it is the cognitive element, rather than simply the physical shape of the
grapheme, that triggers the association. For example, altering the typeface of the text does not
typically alter the concurrent colour that is perceived by the synaesthete (Grossenbacher &
Lovelace, 2001), and an ambiguous stimulus (e.g. “I”) may have a different associated colour
whether it is presented in a string of numbers or of letters (e.g. I2345 vs. Imnop), although the
characters are physically identical (Dixon et al., 2006, Myles et al., 2003). This suggests that it is
not a purely sensory phenomenon, as the synaesthetic association is not being driven purely by
what the eye sees, but also by a top-down interpretation of the stimulus. However, as Simner
notes, although this is true of the majority of grapheme-colour synaesthetes it is not accurate in
all cases, as in other cases the colour of the concurrent will vary with changes in the physical form
of the grapheme (such as typeface, stylisation etc.), leading to the distinction between lower
synaesthetes (triggered primarily by the physical form of the inducer) and higher synaesthetes
(triggered by top-down interpretation of the inducer). This distinction may be pertinent to the
experience of vEAR, as we might wish to examine whether the phenomenon is primarily driven
by objective physical features of the visual stimulus (e.g. brightness, motion velocity, smooth vs.
jerky motion etc.) and/or by a learned association between the stimulus and the expectation of a
31
1.4.1.3 Consistency of Inducer-Concurrent Pairings
Simner next points out that an overemphasis on the necessity for stable inducer-concurrent
pairings may be neglecting the possibility that some synaesthetes experience transitory or
variable synaesthetic experiences. She points out that some individuals claim to experience
synaesthesia but routinely fail consistency tests. Either the claims of these people are untrue or
our current conceptualisation of synaesthesia is inadequate for encompassing these individuals’
experiences. On measures of consistency synaesthetes tend to score 80-100% consistent in their
reported pairings, while non-synaesthetes score around 20%, but as Simner notes many people
score in between this range. On this point Eagleman (2012) points to the extremely large dataset
generated though his own online synaesthesia battery (synesthete.org; Eagleman et al., 2007),
which includes objective tests of stimulus-colour pairing consistency, and notes that they do not
find a bimodal distribution of scores, as one would expect if synaesthesia were an all-or-none
phenomenon, but instead reports some highly consistent scores and a long tail representing less
consistent scores (Eagleman, 2012), consistent with the conceptualisation of synaesthesia as a
spectrum or a collection of related yet distinct phenomena. The issue of consistency too has
implications for the study of vEAR, as informal reports from those who experience the
phenomenon that we have spoken to often describe the concurrent sensation as a generic ‘white
noise’ type of sound, making it harder to test participants for consistency, or some participants
report that the concurrent is being influenced by the context of presentation. For example, after
speaking to participants in our experiment outlined in chapter 2, some reported that the
visually-evoked sounds took on the characteristics of the auditory beeps used in the auditory condition of
32
participants. This lack of specificity does not necessarily make these sensory phenomena any less
perceptually real to the individual rather their inducer can evoke a range of different concurrents
depending on context. One way to test this consistency is presented in chapter 4, where we
present the results of a survey in which respondents were asked to rate a range of different visual
stimuli (silent video clips) for the intensity of vEAR that each evokes. We then analyse the
consistency of these specific subtypes of inducers in evoking sounds, based upon properties of
the stimulus such as whether the content of the video is naturally associated with an
accompanying sound, or the amount of motion energy contained within the scene. This latter
property is a low-level physical characteristic of the visual stimulus and refers to the net amount
of movement within a visual scene, which is obtained by quantifying changes in light in both space
and time. Only those who report experiencing vEAR are sensitive to motion energy. In this sense
we demonstrate consistency between particular types of visual stimulus and the vEAR it evokes
in our respondents.
1.4.1.4 Spatially-Mapped Concurrents
Simner also criticizes the perceived diagnostic requirement for synaesthetic concurrents to have
a perceived spatial location external to the synaesthete. Eagleman concurs with this point and
highlights reports in the literature (e.g. Dixon, Smilek & Merikle, 2004) that some
grapheme-colour synaesthetes reporting their associated concurrent grapheme-colours as being located in external
space, as if the text itself were printed in coloured ink, while others experienced a more abstract
mental association with the colour ‘in the mind’s eye’. They term these ‘projectors’ and
‘associators’ respectively, with the latter forming a significant majority of grapheme-colour
33
surface-projectors, who will see the inducing stimulus itself, generally written text, as if it were
printed in the associated colours, and space-projectors, who will perceive a coloured glow in the
external space surrounding the inducer. This suggests that there are individual differences in how
explicitly the association between inducer and concurrent is perceived by synaesthetes. The
projector/associator distinction has since been applied to other forms of the condition, including
sound-colour synaesthesia (Simner, 2012), and would seem to suggest that some form of graded
synaesthetic spectrum does indeed exist, at least between individuals with synaesthesia.
Eagleman points out that Rouw and Scholte (2007) attempted to clearly behaviourally
differentiate between projector and associator synaesthetes, but did not find bimodal
distribution, instead results were a smooth continuum. This might suggest that these are related
phenomena that represent either end of a spectrum, rather than two distinct categories.
Eagleman then proposes a useful analogy, that of obesity and anorexia as opposite ends of a body
weight continuum. There are clear medical reasons why in medicine it makes logical sense to
study either end of this continuum in isolation, but we would not attempt to tenuously assign the
average weight people in the centre into either category. Likewise with synaesthesia it may be
that there is a spectrum of synaesthetic abilities that has simply been neglected by dogmatic
sampling criteria that then feed a circular definition of synaesthesia. When we asked our
participants ‘where’ the sounds characteristic of their vEAR were perceived to occur, our
participants tended to report that they were inside their head, that they were mental sounds, or
just the feeling of a sound. None reported perceiving them as occurring in external space, such as
mistakenly attributing the spatial source of the flashes to the computer monitor, or from the
34
experimenter in an attempt to deceive them. We can therefore assert that these visually-evoked
sounds are not mapped to any point in external space to meet these diagnostic criteria for
canonical synaesthesia. However, if we are able to demonstrate that these vEAR sounds are able
to interfere with the detection of real-world sounds, as in chapter 2, then we may at least be able
to support our assertion that these sounds are genuinely being ‘heard’ rather than imagined
through some form of auditory imagery.
1.4.2 Is Synaesthesia Dichotomous or Continuous?
Taken as a whole the arguments by the authors involved in this debate appear sympathetic to the
prospect of synaesthesia (or at the very least some of its sub-types) manifesting as a continuum.
This is contrary to the traditional depiction of synaesthesia as a rare and unusual phenomenon
that only affects a small percentage of the population, with estimates of the prevalence of the
condition typically ranging between 2-4% of the population for the more common variants such
as grapheme-colour synaesthesia (Simner at al., 2006; Ward, 2013). However, in estimating the
prevalence of synaesthesia, the assumption being made is that there are synaesthetes and
non-synaesthetes, and that we all fall into either the former or, predominantly, the latter camp.
Proponents of the dichotomous view of synaesthesia might argue that it is likely to be the result
of a genetic variants that are not frequently observed in the population (Asher, 2009; Brang &
Ramachandran, 2011; Tomson et al., 2011). Under this theory the anatomy of synaesthetes is
inherently different to the rest of the population and their perceptual world is unique, meaning
there can be no meaningful middle ground between the presence and absence of synaesthesia.
35
synaesthesia (Smilek et al., 2002; Smilek, Dixon, & Merikle, 2005) which suggests that other
factors than genetics influence the development of the condition.
The alternative ‘spectrum’ account of synaesthesia is not necessarily incompatible with the
evidence for a genetic component of synaesthesia, as any associated gene may be ‘boosting’ one’s
latent synaesthetic abilities, rather than creating them outright. The continuum account is
supported by individual differences in the perceptual vividness of synesthetic abilities even
between synaesthetes, as with the distinction between projector and associator synaesthetes. As
Eagleman notes, the Diagnostic and Statistical Manual (5th Edition) of the American Psychiatric
Association is moving to toward spectral definition of many conditions (e.g. autism) so it might be
time to start considering synaesthesia along these criteria. Yet the lack of a bimodal distribution
of scores on Eagleman’s synaesthesia battery and in Rouw and Scholte (2007) work, in particular
suggest that those who appear in the midrange of scores display some synaesthetic tendencies
and are currently under-researched. The manner in which synaesthetes are typically identified for
research purposes tends to implicitly presupposes that the dichotomous account of synaesthesia
is correct. Synaesthetes are almost exclusively identified through self-selection, and likewise
control subjects are also identified through similarly subjective methods by simply excluding them
from the other category.
A thought experiment in which we assume the validity of the continuum hypothesis exposes why
this sampling bias may occur. If synaesthesia is a common condition in which the intensity, the
36
for some the concurrent sensory percepts are considerably more subtle than in the standard
account of synaesthesia, with many of these pairings at, around, or below their perceptual
threshold. Consider too that this has been their sensory reality since birth, and is utterly
unremarkable to the individual. It follows that for many of these people they would be completely
unaware that they were in any way ‘synaesthetic’ and when questioned about sensory crossovers
using subjective measures they would more than likely respond in the negative. This would then
lead to a sampling bias in which only the extreme ends of the spectrum are captured and thought
to be unrelated samples rather than opposing poles. This suggests that we might observe a very
different pattern of results using subjective measures of synaesthesia experience to those gained
through objective measures alone (such as consistency testing, or the “pop-out” test of
grapheme-colour synaesthesia used by Rich & Karstoft, 2013). This highlights the importance of
the mixed methodology approach employed in this thesis, such as combining our psychophysical
data in chapter 2 with a subjective questionnaire about the individual experience of each
participant while they performed our tasks, or the online vEAR survey that we report in chapter
4.
At this point we wish to note that we refer in this thesis at several points to people who do versus
do not experience vEAR. In doing so we are referring to those who report that they are consciously
aware of the experience, and this is not intended to suggest that we favour a dichotomous
‘all-or-none’ explanation of vEAR. We acknowledge that there may be individuals who are experiencing
subtle sensory crosstalk of which they are not consciously aware but that may be experienced
37
experiencing vEAR without realising it until their attention is drawn to the phenomenon under
laboratory conditions.
1.4.3 Relationship with Normal Multisensory Integration
Cohen in a 2017 essay argues that synaesthesia is continuous with ordinary multisensory
integration or, as the title somewhat provocatively suggests, that “we’re all synaesthetes now”.
His argument is based upon the following premises; 1) that the defining features of synaesthesia
are present to the point of ubiquity in the typical population, 2) that there are both similarities
and differences between synaesthetic and non-synaesthetic cross-modal associations, and 3) that
synaesthetes demonstrate enhanced performance on a number of integrative perceptual tasks
relative to controls. These three arguments seemingly support the idea of the synaesthete as a
‘super-integrator’. Synaesthetes are not unique in integrating information from multiple senses;
it is a normal human ability that we all do all the time. We are constantly surrounded by sights,
sounds, smells, flavours and textures, and every object we come across may harbour a multitude
of sensory properties. On encountering a tree, for example, we may see the colour and shape of
fruit, smell the sweet scent of blossom, feel the coarse texture of bark or hear the sound of leaves
rustling in the wind. Yet we perceive the structure as a single unified object in space, rather than
as several disconnected streams of incoming stimuli. We must therefore have evolved a
mechanism in the brain for binding those sensory qualia that arise from a common origin in the
outside world. Our understanding of how we integrate information from the different senses has
undergone considerable refinement in recent decades. In earlier orthodoxies, information from
each sensory modality was thought initially to be processed independently in early unisensory
38
(Felleman & Van Essen, 1991; Murray et al., 2016; Treisman & Gelade, 1980). In this framework it
made sense to compartmentalise early cortices as auditory, visual, or somatosensory. However,
as our understanding of sensory processing in the brain has advanced, focus has shifted away
from this strictly modular and unisensory view to an understanding that places a greater emphasis
on multisensory interactions. Indeed, we now know that multisensory integration does in fact
occur in lower-level cortical regions, previously thought to be strictly unisensory, and even as early
as the primary cortical level (for reviews see Kayser & Logothetis, 2007; Schroeder & Foxe, 2005).
Ghazanafar & Schroeder (2006) examined the accumulating evidence for early multisensory
integration and suggesting that the neocortex is “essentially multisensory” in nature. This idea
has since gained widespread support (van Atteveldt et al., 2014; de Meo et al., 2015; ten Oever
et al., 2015), with Murray et al. (2016) recently proposing that “the convergence and integration
of information from different senses within low-level cortices is a rule rather than an exception”
(p.161). Similarly Fulkerson (2014) advocated a model of ‘sensory pluralism’ with an emphasis on
the multiple interactions that occur in sensory cortices. In addition, anatomical connections have
been found between early visual areas such as V1 and early auditory cortices in a number of
species, including several species of rodent (Henshke et al., 2015; Laramée et al. 2013; Vaudano
et al., 1991), cats (Clemo et al., 2008) and in nonhuman primates (Cappe & Barone, 2005; Falchier
et al., 2009), and in individuals who are born blind the primary visual cortex has been shown to
respond to nonvisual inputs such as tactile stimuli in the form of Braille (Cohen et al., 1997, 1999;
Likova, 2012; Sadato et al., 2002) and sounds (Bedny, Richardson, & Saxe, 2015), demonstrating
that under the right circumstances, cortical rewiring can occur outside the realm of synaesthesia
39
We know then that multisensory interactions occur all the time in the normal population, and
that cortical projections exist between primary cortices of each sensory modality, suggesting that
the potential cortical architecture to support synaesthetic-like traits in the normal population are
in place. Furthermore, even in the general population there is a propensity to experience what
have been called cross-modal correspondences, defined as “a tendency for a sensory feature, or
attribute, in one modality, either physically present or merely imagined, to be matched (or
associated) with a sensory feature in another sensory modality ” (Spence & Parise, 2012, p. 410).
These are distinct from synaesthesia (according to commonly used diagnostic criteria) as the
associations are not explicitly perceived as sensations (as in synaesthesia), rather they are
intuitively associated when asked to make seemingly arbitrary pairings between stimuli. The key
distinction between cross-modal correspondences and synaesthesia therefore is that in the latter
an input in one sensory or cognitive pathway triggers sensory or cognitive experiences in another
domain that are explicitly perceived in a manner in which the concurrent is perceptually real to
the synaesthete. In cross-modal correspondences, however, there is no concurrent percept,
rather there is a general sense of two different sensory pairings feeling appropriate on a
conceptual or aesthetic level. Might cross-modal correspondences and synaesthesia share a
common origin in the brain? Certainly, there appear to be a correlation between the reported
sensory pairings of some synaesthetes and the cross-modal correspondences experienced by the
wider population (Cohen Kadosh et al., 2007; Cohen Kadosh & Henik, 2007; Eagleman, 2009;
Simner et al., 2005; Ward, Huckstep, & Tsakanikos, 2006). For example, in music–colour
synaesthesia synaesthetes and non-synaesthetes alike have a tendency to associate high
frequency sounds with lighter colours and low frequency tones with darker colours, and although
40
nevertheless will intuitively match them when prompted (Ward, Huckstep, & Tsakanikos, 2006).
Similar associations between grapheme-colour mappings have been demonstrated between
synaesthetes and non-synaesthetes (Simner et al., 2005).
Cross-modal effects like these can influence performance on a number of tasks. One example of
these would be a selective attention task, in which the perceiver is asked to attend to a stimulus
in one sensory modality and ignore information in another. Previous research has demonstrated
a congruence effect (e.g. Melara & O'Brien, 1987), whereby task performance in enhanced when
the stimuli in both the attended and unattended modality match on some criteria, such as
auditory pitch and lightness of colour, where participants are quicker to classify high pitched
sounds when paired with (unattended) white visual stimuli and vice versa for low sounds with
black visual stimuli (See Martino and Marks, 2000, for a review and other examples). Martino &
Marks (2000) demonstrated that this congruence effect is also present when using low vs. high
frequency vibrotactile stimuli paired with either a black or white visual stimulus (where congruent
pairings were Black with low frequency and white with high frequency tactile stimulation).
Analysis of response times demonstrated that this was due to a facilitation effect of matching
pairs, where responses were quicker than with unisensory reaction times at baseline whereas
reaction times to incongruent pairs were the same as when presented alone at baseline. These
results demonstrate that cross-modal interactions may depend on synaesthesia-like associations
41
Such examples of cross-modal associations presumably follow normal rules of multisensory
perception, in which information from more than one modality are perceptually 'bound' if they
occur in sufficient temporal and/or spatial coincidence (Meredith & Stein, 1986; Meredith, Nemitz
& Stein, 1987). Bien and colleagues (2012) examined what occurs when the bottom-up
characteristics such as these are ambiguous, and whether the cross-modal associations described
above play a role in addressing this ambiguity. To test their pitch-size hypothesis, which suggests
that small objects will be grouped with high pitch sounds and larger objects with lower pitched
sounds, they used an auditory spatial localisation task, known as the ventriloquist paradigm
(Driver, 1996), in which spatial correspondence is manipulated to explore the boundaries of the
binding process. Bien et al. (2012) results showed that despite the violations of spatial
coincidence, congruent pairings are more often integrated than incongruent pairings. This
ventriloquism effect was then disrupted using Transcranial Magnetic Stimulation (TMS) that was
applied to the right intraparietal sulcus, a region known to play a role in multisensory integration.
This provides further evidence that low level synaesthetic-like mappings are a normal feature of
multisensory integration in the brain, and that this in turn supports the reconceptualisation of
synaesthesia as operating along a spectrum.
However, others have argued in favour of the separatist view that synaesthesia is indeed a rare
phenomenon, distinct from other cross-modal phenomena, that manifest only in a select group
of individuals, and counter any claims of a middle ground between synaesthesia and typical
perception. For example, Deroy and Spence (2013b) critique claims that experiences such as
cross-modal correspondences represent a form of ‘weak’ synaesthesia and point to the defining
42
correspondences. This argument could be seen as somewhat circular, as it limits discussion of
synaesthesia to definitions that have been set on the basis of previous research, and ignores the
possibility that borderline cases of synaesthesia involve percepts that perhaps the individual has
habituated to and thus learned to ignore, but could nevertheless be explored using bespoke
psychophysical and neuroimaging methodologies.
Figure 1-0-3: Model of relationship between synaesthesia and cross-modal correspondences.
Note that the model could represent either a spectrum of cases or discrete categories. (Based on Rader & Tellegen, reproduced from Deroy and Spence 2013b, p. 652).
Deroy and Spence (2013b) also note that while there are certainly similarities between certain
43
differences. One such discrepancy they suggest is the ordered nature of the pairings in
cross-modal correspondences. While the sensory pairings in synaesthesia are often, but not always,
arbitrary and tend to be diverse in their variety between synaesthetes, there is often a plausible
explanation for the mappings of cross-modal correspondences, such as frequency of exposure in
the natural world (reviewed in Spence, 2011). To take the object size/sound frequency
correspondence discussed above (Bien, et al., 2012), one could easily imagine that large objects
are associated with lower frequencies and smaller objects with higher frequencies as this is
commonly the case with the human voice, or a dog’s bark, for example, in both cases we likely
have learnt that larger body size often correlates with a deeper, booming voice. However as noted
above, in other types of synaesthesia such as music-colour, the sensory correspondences reported
in the general population appear to correlate with those of the synaesthete population (Ward,
Huckstep, & Tsakanikos, 2006). In cases such as these the argument for crossmodal
correspondences as ‘weak’ form of synaesthesia is strongest, although given the heterogeneous
nature of the condition it is likely that this is not a universal property of either synaesthesia or of
crossmodal correspondences.
Despite these learned correspondences being common throughout the population, it is possible
that synaesthetes are the ‘super-integrators’ at the top of the spectrum (see Figure 1-0-1), and
while most of us only integrate at the level of a vague sense of two sensory components ‘feeling
right’ together, those at the far end of the scale display a propensity to integrate even more
unusual cross-modal phenomena that are explicitly perceived on a sensory level. Claims that
synaesthesia is an enhancement of normal multisensory processing gains some support from a