0022-538X/93/010249-09$02.00/0
Copyright X 1993, AmericanSocietyfor Microbiology
A
Micromolar Pool of Antigenically Distinct
Precursors Is
Required
To
Initiate Cooperative
Assembly
of
Hepatitis
B
Virus
Capsids in
Xenopus
Oocytes
MARIASEIFER,1 SILIANGZHOU,1ANDDAVID N. STANDRING12*
HormoneResearch
Institute'
and Departmentof Biochemistry andBiophysics,2 University ofCaliforniaatSan
Francisco,
SanFrancisco,
California
94143-0534Received17July1992/Accepted 14October1992
Assembly
of hepatitis B virus capsid-like (core) particles occursefficiently
in avariety
of heterologous systemsvia aggregation of -180 molecules of a single 21.5-kDa core protein(p21.5),resulting in anicosahedral capsid structurewith T=3symmetry. Recent studies on the assemblyof hepatitis B virus core particles in Xenopus oocytes suggested that dimers of p21.5 represent the major building blockfrom which capsids are generated. Here we determined the concentration dependence of this
assembly
process. Byinjecting
serially diluted synthetic p21.5 mRNA into Xenopus oocytes, we expressed different levels ofintracellular p21.5 and monitored the productionof p21.5 dimers and capsids by radiolabeling and immunoprecipitation, by radioimmunoassay, orby quantitative enzyme-linked immunosorbent assayanalysis.
The data revealed that (i) p21.5 dimers and capsids areantigenicaily
distinct, (ii) capsidassembly
is ahighly
cooperative and concentration-dependent process, and(iii) p21.5 must accumulate to a signature concentration of -0.7 to 0.8 ,uM before capsidassembly
initiates. This
assembly
process isstrikinglysimilar to theassembly
of RNA bacteriophage R17 asdefined by invitro studies.Human hepatitis B virus (HBV)and related animal hep-adnaviruses are small enveloped, hepatotropic DNA vi-ruses. The 28-nm-diameter spherical T=3 HBV nucleocap-sid(core particle)provides the structural environment of the viral replication machinery (for recent reviews, see refer-ences8 and25). The icosahedral capsid shell contains -180 subunits ofasingle viral capsid or core protein of -21.5 kDa (p21.5).Inseveral heterologous systems, recombinant p21.5 spontaneouslyassemblesintosimplecapsidscontainingcore protein and RNA (5-7, 14, 15, 23, 32), a property that facilitatesthe study of HBV capsid assembly.
The 183- or 185-residue (depending on the HBV subtype) p21.5 polypeptide bears at least two major classes of epitopes,thecore(HBc) (2)ande(HBe) (19)epitopes. Intact core particles expressonlyHBcepitopes, which appear to be highly sensitive todenaturationand/or limited proteoly-sis. Dissociation of capsids results in loss of HBc and concomitant appearance of HBeepitopes (18, 21, 30),which are normally latent in capsids.
Although the molecular biology ofp21.5 has been well studied(fora recentreview,seereference27),little is known aboutthe assembly of HBV capsids. We recently reconsti-tuted this assembly process in Xenopus oocytes pro-grammed with synthetic p21.5 mRNA and showed that oocytes produce two core protein species, nonparticulate (free)p21.5 and assembled capsids, with distinctive chemical and physical properties (36, 38). Nonparticulate p21.5 was found to comprise mainly p21.5 dimers (37), which were demonstratedby pulse-chase experimentstobe the precur-sorsforcapsid formation (38).Inthis report,wepresentan
analysisof thecapsid assembly process, includinga charac-terization of the antigenic identity of p21.5 dimers versus
capsids and determination of the p21.5 concentration
re-quirementsfor HBVcapsid assembly in oocytes.
*Correspondingauthor.
MATERIALS AND METHODS
Expression of nonparticulate and particulate p21.5 in oocytes. The synthetic p21.5 mRNA used in this
work,
microinjection and cultivation of Xenopus oocytes, and fractionation of unassembled p21.5 and coreparticles have all been described earlier (35-38). Briefly, capped p21.5 mRNAwastranscribed in vitro fromplasmid pSP64T-C
(36).
This RNA contains the minimal sequence information for p21.5, flanked by noncoding sequences of the Xenopus
3-globin
gene toimprove
translationefficiency.
Concen-trated p21.5 RNA was prepared by treating transcription reactions(29)with DNaseI(RNasefree;Boehringer Mann-heim), followed by extraction with phenol-chloroform and precipitation. ThepurifiedRNAwasdissolvedatthe desired concentration (typically, Sx to 6x) in nuclease-free
H20
(Promega) containing5 mM dithiothreitol and RNasinat400
U/ml
(Boehringer Mannheim)
and then storedat -70°C.ForRNAdilutionexperiments,two-stepserialdilutionsof the stock RNA were prepared directly prior to
injection.
Batches of 10 to 20 oocytes were cultured 1 to 3 days postinjection at 17°C in modified Barth's solution supple-mented withantibioticsasdescribed earlier(28, 29, 36, 38). For synthesisof radiolabeled p21.5 proteins, oocyteswere incubated for -44 h in0.5 to2mCi of[35S]methionine and
[35S]cysteine
(Expresslabel; NEN) per ml of modifiedBarth's solution and lysed in -20
A.l
of homogenization buffer(50
mMTris-HCl [pH7.5],
1% NonidetP-40, 10 mM EDTA)per oocyte.Fordetermination ofp21.5by enzyme-linked immunosorbent assay(ELISA) (see below), oocytes were lysedin PBS (1.5 mMKH2PO4, 8mMNa2HPO4, 2.7 mMKCl, 137mMNaCl). Thelysateswereclarified (micro-centrifuge; 2 x 5 min, 15,000 x g, 4°C)prior
to further analysis.Separation of nonparticulate p21.5 and
capsids
wasachievedbysubjectingthe clarifiedlysate
(2.5
to12oocytes)
tosucrosegradientcentrifugationasdescribedby
Zhou and Standring(36).
The 14gradientfractions(-100
p,leach)
were249
on November 9, 2019 by guest
http://jvi.asm.org/
analyzed by radioimmunoprecipitation as described previ-ously (28, 38), by radioimmunoassay (RIA), or by ELISA.
Determination of HBc antigen and HBe antigen activities by RIA. Aliquots (10 Pd) of the gradient fractions were diluted to 200 pIwith PBS and assayed with acommercial HBe/anti-HBe diagnostic kit (HBe/anti-HBe [rDNA]; Abbott Laboratories) as recommended by the manufacturer. The RIA data are given as
103
counts per minute corrected for the background.p21.5 ELISAs. For HBe- and HBc-specific ELISAs, im-munoplates (Nunc) were coated overnight at 4°C with either mouse monoclonal anti-e(MAEI; 200 ng per well) or anti-c
(18C
E11B12;
500 ng per well) immunoglobulin G in 50 mMsodium carbonate buffer (pH 9.6). Both antibodies were a gift of E. Korec (Institute of Molecular Genetics, Prague, Czechoslovakia). For simultaneous measurement of HBe and HBc (HBe/c ELISA), plates were coated with 1 ,g of polyclonal sheep anti-HBe/c immunoglobulin G (generated by R. Thomssen and W. H. Gerlich, University of Gottin-gen, Gottingen, Germany) per well. After threewashes with PBS-0.1%(vol/vol)Tween20, plates were blocked with 10% (vol/vol) newborn calf serum (GIBCO) in TNE (50 mM Tris-HCl [pH 7.5], 100 mM NaCl, 1 mM EDTA) for 1 h at room temperature, washed as described above, and then incubated for 2 h at 37°C with one of the following samples: (i) 20-pul portions of gradient fractions, (ii) two-step serial dilutions of pooled intermediate orcapsid fractions, or (iii) two-step serial dilutions of clarified total-oocyte lysates. All sample volumes were adjusted to 100 pl with 1% (wt/vol) bovine serum albumin in PBS. After six washes with PBS-0.1% (vol/vol) Tween 20 and addition of 100 pI of diluted rabbit anti-c/e serum (1/2,000 in 10% newborn calf serum-TNE; DakoCorp.), the plates were incubated for a further 1 h at37°C. After being washed, the plates wereincubated for 1 h at37°C with a1/5,000 dilution of horseradish peroxidase-coupled anti-rabbitimmunoglobulin G(Cappel) in10% new-borncalf serum-TNE and washed sixtimes withPBS-0.1% (vol/vol) Tween 20. Color development was initiated by adding 1 mg of o-phenylenediamine (Zymed) per ml and 0.0125% H202 in 22 mM citric acid-50 mM sodium phos-phate(pH 5.1). A490 was measured with a microplate reader (Thermomax; Molecular Devices Corporation).
Preparation of p21.5 concentration standards and quantita-tionof p21.5 species. PurerecombinantHBc-bearing capsids fromEscherichia colicontaining 0.5 mg of core proteins per ml (a gift from M.-A. Selby and P. Valenzuela of Chiron Corporation, Emeryville, Calif.) provided a concentration standard for the quantitation of native p21.5 capsids (native standard). Two-step serial dilutions of this core particle stock covering a concentration range of 50 to 0.39 ng/ml wereprepared in sample diluent (1% bovine serum albumin-PBS) and run in the HBc- andHBe/c-specific ELISAs. The lower limit of detection with these ELISAs was -50 pg of capsids.
AnHBe-positive p21.5 concentration standard(denatured standard) was generated by chemically disrupting capsids (17). Portions of theE. coli capsid stock (diluted to 50 ,g/ml in PBS) were boiled for 10min with 6% (vol/vol) 2-mercap-toethanol and 2% (wt/vol) sodium dodecyl sulfate (SDS). The standard was stored at -20°C in small aliquots. Two-step serial dilutions ranging from 25 to 0.2 ng/ml were empirically found to give the best linear absorbance values over 3 to 5 concentration steps in both the HBe/c- and HBe-specific ELISAs.
For quantitative estimation of the p21.5 species synthe-sized in oocytes, serially diluted samples of total oocyte extracts or of individual or pooled gradient fractions were
assayedby ELISA asdescribed above, alongwith dilution series of the native and denatured standards.
Typically,
3to 5 sample dilutions gave absorbancereadings
in the range appropriate for reliable quantitation, and the final concen-tration estimates representmeansderived from these values. Analysis of standard curves and testsamples, background
correction(given bythemeanvalues of about
eight
negative
controls), conversion of absorbances into actual
protein
concentrations(innanograms per
oocyte),
and calculation of the mean concentration valueswereperformed
with Soft-maxELISAsoftware(MolecularDevicesCorp.).
The reproducibility of these ELISAs was checked
by
assaying samples in
duplicate;
thep21.5 concentration esti-matesfrom duplicatesroutinely agreed
towithin 3 to 6%. Fractionated gradients were often frozen after the initial ELISA analysis and later reassayed; moreover, thep21.5
contentofimportant sampleswas rechecked insome cases byrepeatingthe entire fractionation and ELISAprocedure
with a frozen sample of the
original
oocytelysate.
These reanalysesyielded p21.5 concentrationestimates thatwere within 3 to 10% of theoriginal
estimates forcapsids
and within20% forunassembled p21.5species.RESULTS
Strategyforanalyzingthecapsid
assembly
process.Expres-sion ofp21.5inXenopus oocytes generatesboth
nonpartic-ulate(free)and
particulate
p21.5
species
(36, 38)
thatcanbe resolved on 10 to 60% sucrosegradients
(see
below).
The free p21.5 was found tocomprise
mainly (or
even exclu-sively) p21.5 dimers(37).
Pulse-chaseanalysis
(38)
estab-lished that essentially the entire dimerpopulation
can be chasedintocapsids.Thus,p21.5
dimersare trueprecursors or building blocks forcapsid
assembly
(rather
than an assembly byproductor aproduct
ofmisfolding
or disassem-bly).Todetermine thedependenceof HBV
capsid
assembly
on the concentration of precursors, we elected to vary the intracellular concentrationofp21.5 and monitorthe resultant productionof freep21.5andcapsids.
Thiswasaccomplished
byRNAdilution seriesexperiments;
oocyteswereinjected
withseriallydilutedpreparations
ofp21.5
RNA,
resulting
in commensurate reductions inp21.5
synthesis
(see
below).
Lysates from
p21.5-expressing
oocytes weresubsequently
clarified and fractionatedthrough
minigradients
of 10to60%(wt/vol)
sucrose to yield characteristicp21.5
profiles,
inwhich free p21.5 dimers in the first 4
(of
14) gradient
fractionswere separatedfroma
peak
ofcapsids
infractions 7 through 11. Controlexperiments
(data
notshown)
estab-lished thatclarification of the oocytelysates
didnotresultinsignificant
losses ofp21.5,
and datagiven
later inthisreportestablished that loss of either p21.5
species
was minimal during gradientfractionation.Depending
ontheexperiment,
p21.5 was detected by radiolabeling and
immunoprecipita-tion orby RIAorquantitated byELISA.
Qualitativeanalysisof thecapsid
assembly
process. Ininitial experiments(Fig.1),
oocyteswereinjected
with dilutions of either a lx standard(panels
AtoC)
or alOx-concentrated (panelsD toF)p21.5
mRNApreparation
and labeledmeta-bolically
with[3
S]Met
and[3"S]Cys.
The 35S-labeledp21.5
specieswere resolvedongradients
(see
above),
immunopre-cipitated from the fractions with rabbit anti-core
antibody,
and subjected to
SDS-polyacrylamide
gel
electrophoresis
(PAGE).
The autoradiograms revealed that
increasing
amounts of input RNA elicitedstrikingly
different accumulationon November 9, 2019 by guest
http://jvi.asm.org/
A
D
p21.5
B
E
C
I..
- 43
- 29
- 18.4
- 14.3
1 2 3 4 5 6 7 8 9 1011121314 1 2 3 4 5 6 7
8 9 1011121314
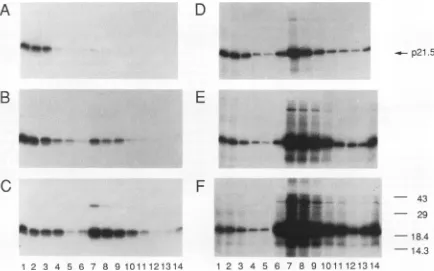
FIG. 1. Analysis of nonparticulate35S-labeledp21.5 andcapsids on sucrose gradients. Lysates were prepared from35S-labeledoocytes injected with thefollowing concentrationsofp21.5 mRNAs: 0.25x (A), 0.5x (B),lx (C),lx(D),5x (E), and 10x (F). These mRNAs were preparedby serial dilution oflx (AtoC)and 10x (DtoF) transcription mixtures, respectively. Lysates werefractionated on gradients of 10to60%sucrose(for further details,seeMaterialsandMethods). Nonparticulate and capsidformsofp21.5 wereimmunoprecipitated from thefractions with rabbitanti-p21.5 serumandanalyzed by SDS-PAGE.Theautoradiogramsshowgradient fractionsarrangedfrom thetop (lane1)tothebottom(lane14);only 13fractionswerecollected in panel D. For clarity, thepositions of prestainedmolecular massmarkers (sizesareinkilodaltons)areindicated onlyatthe right ofpanel F and theposition of p21.5 isindicatedattheright ofpanel D.
sponses for free p21.5 dimers (lanes 1 to4)versus capsids (lanes7to12).The 0.25x (A), 0.5x (B),and 1x (C)RNAs and the lx (D), 5x (E), and lOx (F)RNAsyielded appar-ently similar amounts of free 35S-labeled p21.5 dimers (as judged from the signalintensities). In contrast, capsid pro-duction was minimal for the 0.25x RNA (A) and rose
dramaticallywith eachincrease ininput RNA.
A third dilution experiment (Fig. 2)-in which oocytes wereinjectedwith lx (-),0.5x (0),0.25x
(U),
0.12x (A),or0.06x (O) p21.5mRNAtranscriptionreaction
mixtures-wasanalyzed by an RIA that detects both the HBe and HBc epitopescarriedbythep21.5polypeptide(see below). Only the lx and 0.5x mRNAs generated detectable levels of capsids(fractions7to9),and thecapsidsignalwasstrikingly lower for the 0.5x RNA. These twoRNAsyielded similar
amounts ofp21.5 dimer activity (fractions 1 to3), but this diminished rapidlyfor the subsequent dilutions.
The above-described experiments indicate that capsid assembly proceeds intwo distinctphases. The initialphase is accumulation of free p21.5, presumably in the form of p21.5 dimers. In the second phase, the free p21.5 levels begin to saturate and capsid formation initiates, with most further free p21.5 synthesis being channeled into capsid production. The experimental results in Fig. 2 depict both phases of the assembly process, whereas the data in Fig. 1 focusmainlyon the secondphase.
Antigenic identityofp21.5 species and evaluation of stan-dards for their quantitation. The above-described ap-proaches are notwell suited todetermining the
concentra-tion ofp21.5 dimers required to establishcapsid assembly. Detection of dimerswas notveryreproducible byRIA (data not shown). Quantitation bymetaboliclabeling is problem-atic, since we do notknow (i) the relativeefficiencies with which dimers and capsids can be immunoprecipitated, (ii) the specific activity ofthe label in these species (oocytes have large endogenous pools of amino acids), and (iii) the relative kinetics of uptake of labeled amino acids versus dimer synthesis and capsid assembly. (During the 48-h labeling period a substantial amount of unlabeled dimer synthesisoccurs before the35S label has had timeto equil-ibrate throughout the oocyte, and the rate of label uptake must decrease before the end of the experiment; thus, for kinetic reasons, the specific activities of the dimer precur-sorsandcapsidproducts arelikelytodiffer.)
For more reliable quantitation, we turned to ELISAs employing antibodies directed against two classes of epitopes (core and e) carried by the p21.5 polypeptide. Capsids characteristically express core epitopes (HBc), whileeepitopes(HBe)arelatent incapsids butarereleased upontheirdisruption. However, the antigeniccharacter of the unassembled p21.5 dimers is not known and this
com-plicates the ELISA analysis. We therefore used ELISAs monospecificfor HBe and HBctocomparethe antigenicity ofp21.5 dimers andcapsids
(Fig.
3).p21.5-expressingoocyteswerefractionatedon astandard sucrosegradient. Aliquotsof the fractionswerediluted and assayed in parallel by
using
thefollowing
antibodies to capture p21.5: (i)anti-e/c
polyclonalantibody
(HBe/con November 9, 2019 by guest
http://jvi.asm.org/
[image:3.612.94.528.79.350.2]E
60-0
G
.~50-
40-o
30-20
0
2
4
6
8
10 12 14
Fractions
FIG. 2. Qualitative analysisofp21.5 species byRIA. Oocytes wereinjected with thefollowing dilutions ofp21.5mRNA:lx
(@),
0.5x (0), 0.25x (O), 0.12x (A), and 0.06x (0). After standard gradientfractionation, HBeand HBcactivitiesweredetermined in 10-p.laliquotsof each fractionby usingacommercial HBe RIA kit whichrecognizes HBe and HBc determinants. See Materials and Methods for further details. Fraction 1 represents the topof the gradient. Activitiesaregiven as103countsper minute (kcpm) and werecorrected for thebackground bysubtraction of themeanofaseriesofnegative controls.
ELISA), (ii) anti-e monoclonal antibody (HBe ELISA), or (iii)anti-cmonoclonalantibody(HBcELISA).Apolyclonal rabbitanti-p21.5serumthat recognizesmultiple epitopeson p21.5(datanotshown)wasthen usedtodetectthecaptured antigens. The HBe/c assay (Fig. 3A) yielded the typical profilewithbothp21.5dimers andcapsids.The HBeELISA (Fig. 3B) detected p21.5 dimers
(fractions
1to6)
but failedto recognize capsids. Conversely, the HBc ELISA(Fig. 3C)
detectedcapsids (fractions 8to10)but not dimers.Thus,the two p21.5 species are antigenically
distinct;
unassembleddimers
express HBebutnotHBc,whilecapsids display
HBcbutnotHBe.
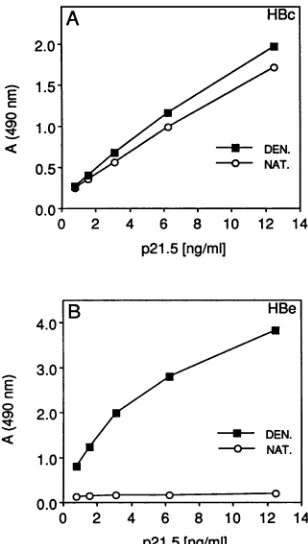
Inlightofthese results, quantitation ofp21.5 dimers and capsids demands different types of p21.5 concentration standards. Forquantitation ofcapsids,avery pure prepara-tion of recombinant capsids (ofknownconcentration)from E. coli provided a suitable standard (the native standard), which yielded an almost linear standard curve for 0.78 to 12.5 ng of p21.5 per ml in the HBc ELISA(Fig. 4A)orthe HBe/c ELISA (data not shown). Core particles from Sac-charomyces cerevisiae (14) gave an
essentially
identical curve (data not shown) andprovided independent verifica-tionof the concentration of the E. colicapsids.Asexpected,thenativestandarddisplayedverylittleHBe activity
(Fig.
4B).AnHBe-positivestandard(the
denatured standard)wasgenerated by boiling the E. colicapsidswith 6%2-mercaptoethanoland2% SDS,aprocedure reportedto release HBeimmunoreactivity
withconcomitant loss of HBc (17, 20).Successfuldisruptionofcapsids and release ofHBe activitywasconfirmed by the HBe ELISA(Fig. 4B) and by nonreducing SDS-PAGE (data not shown), in which the denatured standard ran mainly asdissociatedp21.5
mono-mers.However, surprisingly, the HBc ELISA indicated thatthis denaturation
didnotdestroyor evensignificantlydimin-ish HBcimmunoreactivity (Fig. 4A).Infurther experiments
(data
not shown), dilute solutions of E. coli capsids (50Fg/ml)
were denatured withawide range of concentrations of2-mercaptoethanol (0.3 to6%[vol/vol])
and SDS (0.1 to5%
[wt/vol])
andassayed byELISA. All of thepreparationsdisplayed virtually identical antigenic phenotypes; even the harshestdenaturation failed to diminish HBcactivity,but all treatmentsreleased maximal HBe activity. Thus, our data suggest that HBc can beunexpectedlyresistant to denatur-ation.
Although the denatured standard is not ideal for quantita-tion ofp21.5 dimers, it provides the best reagent currently available and yields a standard curve that was almost linear in the range of 0.39 to 6.25 ng of p21.5 per ml (Fig. 4B). Quantitationwiththe denatured standard is straightforward for the HBeELISA, but in the HBe/c ELISA the denatured standard exhibits both HBe and HBc activities, whereas p21.5 dimers have only HBe activity. To correct for this discrepancy, wegenerated a corrected denatured standard curve by assayingserial dilutions of denatured and native standardsinparallelandsubtracted the latter(HBc)values from the former (HBe plusHBc) values. With the HBe/c ELISA and the corrected denatured standard, the estimates obtained for the p21.5 dimerswereclosetotheHBeELISA values (datanotshown).
HBe/HBc A
2.0
1.5 1.0 2
0.5-0.c
0 2 4 6 8 10 12 14
r
2.0
E
0) 'Ic
1.5' 1.0' 0.5'
2.0
1.5
1.0
0.5
2 4 6 8 10 12 14
[image:4.612.89.273.75.229.2]Fractions
FIG. 3. Antigeniccharacterizationofp21.5assembly
intermedi-atesandcapsids. Oocyteswereinjectedwith 6x p21.5mRNA and
fractionated into free p21.5 and capsids on a standard sucrose
gradient. The 14 fractions(fraction 1is the topgradient fraction)
wereanalyzedinparallel by usingELISAsagainstthe determinants HBeand HBc(A),HBe(B),and HBc(C).The dataarepresentedas
A490values. FurtherexperimentaldetailsareprovidedinMaterials
and Methods.
HBe B
0 2
0 2 4 6 8 10 12 14
HBc
C
v.v
on November 9, 2019 by guest
http://jvi.asm.org/
[image:4.612.368.509.310.650.2]2.'
0
c_
1.1 1.1
0.l
0.1
A HBc
0- 5-
0-U-DEN. 5- -0-- NAT.
0
0 2 4 6 8 10 12 14 p21.5 [ng/ml]
-4.0
0) Nt
3.0 2.0
1.0
0.0- ,
0 2 4 6 8 10 12 14
p21.5[ng/ml]
FIG. 4. HBe and HBcimmunoreactivities of native and dena-turedp21.5 standards. HBc (A)- and HBe (B)-specific ELISAswere
usedtocomparenative(NAT.) and SDS-2-mercaptoethanol-dena-tured(DEN.) standards derived from thesamepreparation of E.coli
capsids (see Materials and Methods). Serial dilutions of both
stan-dards(0.78to12.5ngofp21.5perml)wereassayed inparallel. The dataare rawA490values.
Capsid formation initiates as the free p21.5 approaches
micromolar concentrations. We next conducted a detailed
quantitative analysisof the production of p21.5 dimers and capsidsinasingleRNA dilutionseriesexperiment (no. 289). OocytesweremicroinjectedwithsevenRNAdilutions
cov-ering a 64-fold concentration range (6x to 0.09x) and homogenizedin PBS, and the p21.5 species were
fraction-atedon sucrosegradients. Thegradient profiles determined
by HBe/c ELISA (Fig. 5) are similar to the earlier RIA profiles (Fig. 2) and furtherconfirm that capsid production (fractions7to12) requires prioraccumulation ofp21.5dimer intermediates (fractions1 to5).
Toquantitate thedimers andcapsids moreaccurately,we
pooledtherespective gradientfractions and estimated their p21.5 contents (in nanograms per oocyte) with the HBe/c
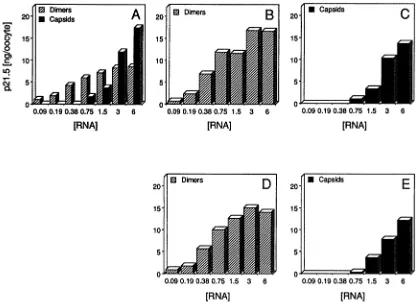
(Fig. 6A), HBe (Fig. 6B), and HBc (Fig. 6C) ELISAs in conjunctionwith the appropriate standards (see above and thelegendtoFig. 6).The data reveal that the overall shape of theaccumulationprofilefordimersappearstobe sigmoi-dal;the dimerlevels(hatched)increasedrapidlyforthe four most dilute RNAs and then more slowlyfor the remaining
RNAs,andtheyfinallyreachedaplateauataround9(HBe/c ELISA) or 16 (HBe ELISA) ng ofp21.5 per oocyte. The
reasonfor thevariance between these estimates isunclear;
the HBe and HBe/c ELISAs usually yielded much closer estimates of thep21.5 dimerconcentrations (seebelow and Table 1).
Theaccumulation profileofcapsidswas strikingly
differ-ent. Capsids were not detected for the three lowest RNA
1 ., ri1- IV
o8
0
0
0
2
4
6
8 10 12 14
Fractions
FIG. 5. Analysis of p21.5 assembly intermediates and capsids by ELISA. Oocytes were injected with a dilution series of 6x (e), 3x (0), 1.5x ([1), 0.75x (-), 0.38x (A\), 0.19x (K>), and 0.09x (-) p21.5 mRNA. Lysates were fractionated on standard sucrose gra-dients. The p21.5 present in each fraction was estimated with the HBe/c ELISA by using the native standard for the capsid fractions and the corrected denatured standard for the nonparticulate p21.5 fractions. The data are given as nanograms per oocyte. Further details are provided in Materials and Methods.
concentrations and first appeared (Fig. 6A and C) at 0.75 x RNA. Thereafter, capsid production rose rapidly with in-creasingRNA concentrations with nosignof saturation. For capsids, the HB3e/c (Fig. 6A) and HBc (Fig. 6C) ELISAs gave comparableconcentration estimates.
We were concerned that significant losses of either p21.5 species might have occurred during gradient fractionation. To address this issue, and to testwhetherthe p21.5 species could be measured directly in crude lysates, we analyzed unfractionated total oocyte lysates with the dimer-specific He (Fig. 6D) and the capsid-specific HBc (Fig. 6E) ELISAs. The resulting data are essentially identical to the data from the pooled gradient fraction (Fig. 6B and C), suggesting that (i)p21.5dimers and capsids can beestimated directly in crude oocyte lysates and (ii) fractionation of oocyte extracts results in remarkably low losses of either species.
Comparison of capsid assembly indifferentexperiments. In the above-described experiment (no. 289), detectable pro-duction of capsidswasfirst seen in response to 0.75 x RNA when unassembledp21.5 had accumulated to between 6 and 12 ng per oocyte (depending on the exact quantitation procedure used). We next askedwhetherthe concentration dependence of capsid assembly varies from experiment to experiment orwhethera specific concentration of unassem-bled p21.5 dimers is a characteristic of capsid assembly. Both the HBe/c and HBe ELISAs were used to quantitate the unassembled p21.5 dimers present in total lysates origi-nating from experiment 289 (see above) and three other independent RNA dilution series experiments which were conducted over a 1-year period and involved different batches of oocytes and synthetic p21.5 RNA (Table 1). Capsid production was analyzed by subjecting either gradi-ent-fractionated particle pools or crude oocyte lysates to RIAor ELISA (Table 1).
It is apparent from the data that different experiments exhibited significant variations in p21.5 expression and
cap-HBe
B
DEN.
-0- NAT.
on November 9, 2019 by guest
http://jvi.asm.org/
[image:5.612.102.256.73.345.2] [image:5.612.330.543.73.248.2]E2 Dimers * Capsids
15- 10-5.
0.09 0.19 0.38 0.75 1.5 3
[RNA]
0
E Dimers
B
20
15- 10-5.
6 0.09 0.19 0.38 0.75 1.5 3 6
[RNA]
* Capsids
0 0
0.09 0.19 0.380.75 1.5 3 6
[RNA]
I0
DimersD
20
15-
10-5.
0.09 0.190.38 0.75 1.5 3 6
* Capsids
.L==i
0.09 0.19 0.380.75 1.5 3 6
[image:6.612.101.519.72.374.2][RNA] [RNA]
FIG. 6. Quantitationofp21.5 assemblyintermediates andcapsids.The RNA dilutionseriesexperiment (6xto0.09xRNA)shown inFig.
5providedthe material for this ELISAanalysis.Thep21.5 (innanograms peroocyte)presentinthe form of dimers(hatched)orcapsids (filled) wasquantitatedineitherpooled gradientfractions(AtoC)orunfractionatedoocytelysates (DandE). Seriallydilutedsampleswereanalyzed
inparallel withHBe/c (A), HBe (Band D), and HBc(C andE)ELISAs (see text). Thefollowingstandardswere used for calibration: denatured (B andD), native (C, E, andcapsid poolsin A) and corrected denatured(dimer pools inA). Further detailscanbe found in
Materials and Methods and elsewhere in thetext.Thegradientfractionpoolswerepreparedbycombiningfractions 1to5 forp21.5dimers and 7to 12 forcapsids.
sidassembly.Aplateauof dimerproductionwasreached in
responsetothemoreconcentrated RNAs inexperiments177 and 289, but not in the remaining experiments. In one
experiment (no. 284),even5xconcentrated mRNA failedto solicit capsid production. This experiment, however, was
atypical; in our experience, standard (1x-concentrated) p21.5 mRNAgenerally drove significant capsid production (datanotshown).
Despitethe variations inp21.5 expression levels,the data from all fourexperimentsareconsistent with thepictureof capsid assembly derived in the preceding sections and supportthe idea thatasignaturethreshold concentration of p21.5 dimers is required to initiate capsid assembly. The estimates of p21.5 dimer concentration obtained from the HBe andHBe/cELISAsweregenerallyingood agreement throughout the range of p21.5 concentrations (e.g., see
experiment 177); onlyinexperiment289 did thetwoassays
differ significantly. The average of the HBe and HBe/c
ELISA estimates for the concentration ofp21.5 intermedi-ates atwhich capsid productionwas first detected in each
experimentwere -8.1 0.1 (no. 177),7.1 0.9(no. 193), and7.6 2.4(no. 289)nanograms peroocyte. Thus, capsid assemblyappearstoinitiateonce anoocytehas accumulated apoolof-7to8ngofp21.5.
Several precautions were taken to reduce errors in our
ELISA concentrationmeasurements.Weanalyzed
indepen-dentexperimentswith both intermediate andcapsid-specific ELISAs,checkedp21.5concentrations with both bacterium-andyeast-derived capsid standards, performed quantitation
assays induplicate, reassayedcriticalsamples, and quanti-tated p21.5 species in total extracts, as wellas ingradient
fractions(gradient fractionation resultedinnegligible loss of eitherp21.5 species). All of these approaches gave results which were consistent and generally agreed remarkably
well,thusincreasing ourconfidence in the estimates.
DISCUSSION
Recent studieswithXenopusoocyteshave offered the first view of how simple HBV capsids are assembled. This
process appearstoproceedvia aggregationofp21.5 dimers without extensiveaccumulation of detectable intermediates (36-38).Thisreportdescribesamoredetailedanalysisof this
assemblyprocess and contains three newelements: (i) the demonstration that dimers and capsids are antigenically
distinct, (ii) qualitative studies indicating thatcore particle
assemblyisahighly concentration-dependent and
coopera-tive process, and (iii) an estimate of the concentration of p21.5 required to initiate capsid formation. These data strengthentheanalogybetween theassembly pathwaysseen
for HBV capsids in oocytes and for simple RNAviruses,
fT
0 0) LO
N-a.
20 15 10 S. 0l
C
20 15 10 5
E
t
I
I
I
-
-.
Al
20
on November 9, 2019 by guest
http://jvi.asm.org/
TABLE 1. Quantitativecomparison of p21.5dimer assembly intermediateand capsid concentrations among individual
experiments
Concn(ng/oocyte) of:
Expt [RNA] Intermediates Capsids
no. (x) (anti-e/cor
Anti-e/c Anti-e anti-c)
177 1.00 9.99 9.00 ++a
0.50 8.02 8.13 +
0.25 3.56 3.87 NDW
0.12 1.57 1.59 ND
0.06 1.13 1.01 ND
193 1.00 7.95 6.38 1.76c
0.50 3.07 2.64 ND
0.25 2.75 2.20 ND
0.12 1.17 0.58 ND
0.06 0.56 0.10 ND
284 5.00 4.46 6.44 NDc
2.50 1.44 2.04 ND
1.25 0.31 0.31 ND
1.00 0.56 0.57 ND
289 6.00 11.02 13.98 12.41d
3.00 8.25 15.04 7.80
1.50 6.20 12.62 3.64
0.75 5.20 9.98 0.34
0.38 3.23 5.67 ND
0.19 1.45 1.78 ND
0.09 0.55 0.86 ND
a Assessed from gradient-fractionated p21.5 by RIA and expressed in arbitrary units (+, low;++,medium).
b ND,notdetected.
cAssessed fromgradient-fractionated p21.5 by HBe/c-ELISA.
dAssessed from crudelysatesby HBc-ELISA.
suchasE. coli bacteriophage R17, which have been
deter-mined from invitro reconstitution studies.
Antigeniccharacterization of capsidassemblyand disassem-bly.A byproduct ofourELISA studiesonthe concentration
dependence ofcoreparticle assemblywasthe demonstration
that p21.5dimers expressHBe butnotHBc epitopes, while capsids have the reciprocal antigenicity. It was not previ-ously realized that dimers and capsids are antigenically
distinct and that capsid assembly is accompanied bymasking of HBe andelaboration of HBc. Thisfindingwasconfirmed
by using several differentHBe- andHBc-specificantibodies (datanotshown). Mechanistically, loss of HBe activitymay
be asimple consequence of HBe epitopes becoming buried as dimers aggregate into capsids. We envision the HBc epitope as discontinuous, probably involving residues
con-tributed by adjacent p21.5 subunits which are brought to-gether only as dimers aggregate. An alternative, although perhapslesspersuasive, explanation for theseepitope inter-conversions is that they are caused by conformational changes in the p21.5 polypeptide that accompany capsid
assembly.
Althoughwefailedtodetectp21.5multimers intermediate in size between dimers and capsids in arecentbiochemical characterization of the precursorsforcapsid assembly(37),
it could be argued that the low-resolution methods used in this study permitted a significant fraction of higher p21.5
multimers to escape detection. The HBc-specific ELISA offers a potentially powerful method for detecting such species, since aggregated p21.5 dimers, in particular, might
beexpectedtocarryHBcepitopes (see above). Ourfailure to detect HBc activity in the population of unassembled p21.5species isthereforeafurtherindicationthat thereare
few,if any,highermultimers ofp21.5hidden within the free p21.5 dimerpool.
Toobtainquantitationstandards suitable forestimationof HBe-expressing dimers, we dissociated HBc-positive cap-sids. It is generally thoughtthat chemically induced disas-sembly of capsids is accompanied by destruction of HBc epitopesand the emergence ofcrypticHBeepitopes (18, 21, 26,30)-essentiallytheconverseofcapsid assembly. Thus,
we weresurprisedtofind thatpreparationsof E. coli-derived capsidsthat had beendisruptedwith2-mercaptoethanoland SDS retained almost full HBc
activity despite being highly
HBe immunoreactive. Even the severestdenaturation con-ditions tested failed eithertorelease additional HBe
activity
from our preparations or to strip them of HBc epitopes. Sporadic claims from other groups support the idea that disrupted capsids canretain HBc
activity (5,
17,31).
How theresistance of the HBcepitopetodenaturationisaccom-plishedin molecular terms is an intriguing issue that war-rantsfurtherinvestigation.
Qualitative analysisof the process ofHBVcapsid
assembly.
Earlier work (38) established the utility of oocytes for studyingthe concentrationdependence of
capsid assembly
by showing (i) that both p21.5 capsids and dimers can be simultaneouslyobserved and
(ii)
thatcapsid assembly
canbe prevented by lowering the intracellular concentration of p21.5(by dilutingtheinjectedRNA).Herewecreatedawide range of p21.5 concentrations by injecting oocytes with stepwiseserial dilutions ofp21.5mRNA. Theeffectiveness of this strategyformanipulatingthecapsid assemblyprocess wasreadily apparentthroughoutthis work(e.g.,
Fig. 1 and Table 1). Inpractice,weobservedcapsid assemblyinmost of the experiments involving concentrated or 1x prepara-tions ofp21.5 mRNA, whereas diluted RNApreparations
yielded mostly unassembled p21.5
(Table
1 and data not shown). Thus, the oocyte system appears to have the valuable,iffortuitous, propertyofexpressing p21.5 at con-centrations particularly suited for studying HBV capsid assembly.All of the RNAdilution seriesexperimentsgavethesame
qualitative picture of capsid
assembly, regardless
of the method of analysis. HBV capsid assembly is a biphasic process. The initial phase involves accumulation of stable p21.5 dimers (37)with little or no detectable productionof capsids. Dimer accumulation continues until thepool
of dimers begins to saturate.Shortly
before theplateau
of dimerproductionisreached,there isasharp
transitiontothe second phase, inwhich capsidassembly
initiates.Beyond
this transitionpoint,there islittlefurtherincrease in the size of the dimer pool and most additional p21.5
synthesis
becomes channeled into
capsid
production.
The highly cooperative and concentration-dependent na-ture of the HBV capsid assembly process hasmechanistic implications.Forinstance,ourdataseem
incompatible
with any model that invokes highly localized(and
therefore concentration-independent) interactions between p21.5 dimers and the mRNA which directed theirsynthesis.
Nor do they appear to favor modelsrequiring
formation of a discrete series ofprogressively
morecomplex
subcapsid
intermediates. On the otherhand, they
do seem consistent with a model in which a distinct initiation event directs afreelydiffusiblepopulationofp21.5dimerstoaggregateonce
aspecificconcentration is reached
(cf.
R17phage
assembly
[see
below]).
on November 9, 2019 by guest
http://jvi.asm.org/
Quantitative aspects of p21.5 synthesis and
assembly.
Quan-titation of p21.5 by ELISA was undertaken for three rea-sons. First, wesimply wantedto know how much p21.5 is synthesizedin oocytes.Inexperiment289, for example, the extentof p21.5production varied from -0.55 to -23.43 ng per oocyte, dependingon theinput RNA concentration. In this case, a 64-fold range of input RNAelicited a 43-fold range of p21.5 expression, revealing an almost linear rela-tionship between p21.5 synthesis and the input RNA con-centration (whether the product is exclusivelydimers or a mixture of dimers andcapsids)andconfirmingthe effective-ness of the RNA dilution series strategy. The quantitation data also reveal that the extents of p21.5 synthesis and capsid assembly varied between experiments (Table 1), presumablybecauseofqualityfluctuations among batches of RNAand also oocytes.Oursecond goal was to estimate the size of the pool of p21.5 dimers required for initiation of capsid assembly. Estimates from several different experiments suggest that this value corresponds to -7 to 8 ng ofp21.5 per oocyte. Given that most (>90%) of the p21.5 dimers and the bulk (-95%) of capsid assembly localize to the oocyte cytosol (36)withaneffective volume of -500 nl(9),ourdata suggest that thesignature concentrationofp21.5 required toinitiate capsid assemblyis -14 to16
p,g/ml
(0.7to 0.8p,M).
The accuracyof this estimate iscompromised bythe lack of chemically pure dimers with which to calibrate the ELISA. Thesubstitute calibrationstandard(denatured cap-sids) mayhave a different HBe activityperp21.5 polypep-tide chaincomparedwithp21.5 dimers.Thus, it is formally possiblethat dimer estimates differ from the real values by
an unknown, but presumably constant, factor. Unfortu-nately, estimation of dimersbythemetaboliclabelingorRIA approach is no more reliable (see Results) and estimates fromimmunoblotting (datanotshown) arecompromised by the large amount of endogenous proteins and the small amountofp21.5 dimers in the oocyte(althoughthis method has verified the expected levels of p21.5
expression
for oocytes engaged in efficient capsidproduction).
However,noneof these alternative approaches contradict the ELISA data. Indeed, our analyses of a given experiment by the qualitative metabolic labeling or quantitative ELISA ap-proach always suggested comparable extents of capsid
as-sembly and comparable dimer/capsid ratios (data not
shown).
Thus,wefeel that theerrorintroduced into thepoolsize estimatesbyuseof denaturedcapsidstandards isunlikelyto be major. Other possible sources of inaccuracy, such as
slightfluctuations in the localcytoplasmic p21.5 concentra-tion dueto unevendiffusion(eitherofp21.5orof theinjected mRNA)and the fact thatcapsidassemblytakesplaceat17°C in oocytesversus37°Cinculturedanimalcells,areprobably relatively minor. While the pool size ofp21.5 required for capsid assemblymaybe offby,say,two- toperhapsfourfold fromour0.7to 0.8 ,uM estimate, we are confident that the dimerpool size is closeto1 ,uM, rather than1 nM or 1mM. A more precise quantitation of the concentration depen-dence ofHBVcapsid assembly will likely havetoawaitthe availabilityof purep21.5 dimers and aninvitro reconstitu-tionstudy.
The final reason forour interest in quantitation is that it paves the way fordissection of the contribution ofspecific interactions to the assembly process. The 0.7 to 0.8 ,uM value reported in this study reflects the pool of p21.5 required to assemble simple HBV capsids containing not
only p21.5dimers but alsoRNA,asjudged bytheirdensity
on cesium chloride gradients (data not shown). Capsids containing little or no RNA are assembled from p21.5 molecules from whichtheprotamine-like nucleic acid-bind-ing region has been deleted (5, 12). The relative size of the dimerpool requiredtoassemble suchRNA-deficientcapsids may give clues as to whether RNA plays a direct role in capsidassembly. Similarly, it will be interesting to determine whether coexpression of the viral polymerase and prege-nome RNAcauses analteration indimer pool size; such an effect may shed lightonthe way these components become drawn into the assembly process. The oocyte system ap-pears ideal for addressing these issues. Moreover, relative rather than absolute estimates of dimer pool size will be sufficient.
Comparisonwith theassembly of bacteriophage R17. High-resolution electron micrographs (22, 34) suggest that the HBV capsid is a structure with T=3 symmetry that is constructed from 180 p21.5 capsid protein subunits. Many smallpositive-strand RNAplantand insectviruses, aswell as bacteriophages and animal picornaviruses, share this simple capsid architecture (1, 10, 11, 13, 16, 24). The nucleocapsidsofvertebratepicornaviruses,suchas poliovi-rus, mengovirus, and foot-and-mouth disease virus, are assembled from protomerscontainingonesubunit of each of distinct VPO, VP1, and VP3capsid proteins. Five ofthese protomers subsequently aggregate into stable pentameric intermediates from which thecapsidisultimatelyassembled. Thus, picornavirus assembly proceeds viaanordered path-wayinvolvinga discrete series of intermediates (24).
On the other hand, T=3 plant viruses, such as tomato
bushystuntvirus(10), orRNAcoliphages, suchasR17(3, 4), are assembled from 90 chemically identical dimers. In vitro reconstitution studies have recently defined the R17 bacteriophage assembly processin detail (3, 4). R17capsid formation appears to be a highly concentration-dependent andcooperative coassemblyprocessinvolvingdimers of the -25-kDa coatprotein and RNA (33). Phage assemblyfirst occurs asdimer concentrations reach 1 ,uMandproceeds by cooperative polymerizationof 90 dimers around the -3.6-kb R17 RNA genomewithnoobvious accumulation of interme-diates. Interactions between the dimers and RNA appearto
initiateR17 assembly.
Denovo assemblyofsimple HBVcapsids, as defined in ouroocytestudies, appearstobequite different from picor-navirus assembly but is strikingly similar to phage R17 assemblyinregardto(i)theuseofdimerbuilding blocks, (ii) the concentrationrequirements for assembly, (iii) coopera-tivity, and (iv) lack of accumulation of readily detectable intermediates(37).Thisanalogybetween the R17 and HBV assembly processes may furnish valuable clues to HBV
capsid assembly.
ACKNOWLEDGMENTS
Wethank M.-A. Selby and P.Valenzuela (Chiron Corporation, Emeryville, Calif.) and P. Kniskern(Merck)forgiftsof pure core particle preparations from E. coli and Saccharomycescerevisiae, respectively;W. H.Gerlich(Universityof Giessen, Giessen, Ger-many),R. Thomssen(UniversityofGottingen, Gottingen, Germa-ny),E. Korec(Instituteof MolecularGenetics,Prague, Czechoslo-vakia), and D. Milich (Scripps Institute, La Jolla, Calif.) for supplying antibodies; and M. C. B. Calayag and V. Lingappafor providing Xenopus ovarian tissue. We acknowledge I. Caras and J.C. Cross forhelpfulcomments onthemanuscript.
Thisworkwas supported by grantA125056 from the National Institutes of Health and afellowship (to M.S.)from the Deutsche Forschungsgemeinschaft.
on November 9, 2019 by guest
http://jvi.asm.org/
REFERENCES
1. Abad-Zapatero, C., S. S. Abdel-Meguid,J. E. Johnson, A. G. W. Leslie,I. Rayment, M. G. Rossmann, D.Suck, and T. Tsukihara. 1980. Structure ofsouthern bean mosaicvirus at2.8 A resolu-tion. Nature (London)286:33-39.
2. Almeida, J. D., D. Rubenstein, and E. J. Stott. 1971. New antigen-antibody system inAustralia-antigen-positive hepatitis. Lancetii:1225-1227.
3. Beckett, D., and 0. C. Uhlenbeck. 1988. Ribonucleoprotein complexes of R17 coat protein and a translational operator analog. J.Mol. Biol. 204:927-938.
4. Beckett, D., H.-N. Wu, and 0. C. Uhlenbeck 1988. Roles of operator and non-operator RNA sequences in bacteriophage R17capsid assembly. J. Mol. Biol. 204:939-947.
5. Birnbaum, F., and M. Nassal. 1990. Hepatitis B virus nucleo-capsid assembly: primary structure requirements in the core protein.J.Virol. 64:3319-3330.
6. Edman, J. C., R. A.Hallewell, P.Valenzuela, H. M. Goodman, andW. J. Rutter. 1981. Synthesis of hepatitis B virus surface and core antigensin E. coli. Nature (London)291:503-506. 7. Gallina, A., F. Bonelli, L.Zentilin, G. Rindi, M. Muttini, and G.
Milanesi. 1989. Arecombinant hepatitis B core antigen polypep-tide with theprotamine-like domain deleted self-assemblesinto capsidparticles but fails to bind nucleic acids. J. Virol. 63:4645-4652.
8. Ganem, D. 1991. Assembly of hepadnaviral virions and subviral particles, p. 61-83. In W. S. Mason and C. Seeger (ed.), Hepadnaviruses.Molecular biology and pathogenesis. Springer-VerlagKG,Berlin.
9. Gurdon, J. B., and M. P. Wickens. 1983. The use of Xenopus oocytes forthe expression of cloned genes. Methods Enzymol. 101:370-386.
10. Harrison, S. C.1991. Principles of virus structure, p.37-61.In B. N. Fields and D. M. Knipe (ed.), Fundamental virology. Raven Press, New York.
11. Harrison, S. C., A. Olson, C. E. Schutt, F. K. Winkler, and G. Bricogne. 1978. Tomato bushy stunt virus at 2.9 A resolution. Nature (London) 276:368-373.
12. Hatton, T., S. Zhou, and D. N. Standring. 1992. RNA- and DNA-binding activities in hepatitis B virus capsid protein: a model for their roles in viralreplication. J. Virol. 66:5232-5241. 13. Hogle, J. M., M. Chow, and D. J. Filman. 1985. Three-dimen-sional structure of poliovirus at 2.9 A resolution. Science 229:1358-1365.
14. Kniskern, P. J., A. Hagopian, D. L. Montgomery, P. Burke, N. R.Dunn, K. J.Hofmann,W. J.Miller, and R. W. Ellis. 1986. Unusually high-level expression of a foreign gene (hepatitis B viruscoreantigen) inSaccharomyces cerevisiae. Gene 46:135-141.
15. Lanford, R. E., and L. Notvall. 1990. Expression of hepatitis B viruscoreand precore antigens in insect cells and characterisa-tion of acore-associated kinase activity. Virology 176:222-233. 16. Luo, M., G. Vriend, G. Kamer, I. Minor, E. Arnold, M. G. Rossmann, U. Boege, D. G. Scraba, G. M. Duke, and A. C. Palmenberg.1987.The atomic structure of Mengo virus at 3.0 A resolution. Science235:182-191.
17. Machida, A., H. Ohnuma, E. Takai, F. Tsuda, T. Tanaka, M. Naito, E. Munekata, Y. Miyakawa, and M. Mayumi. 1989. Antigenicsites on the arginine-richcarboxyl-terminaldomain of thecapsid proteinof hepatitis B virus distinct fromhepatitis B coreore antigen.Mol. Immunol.26:413-421.
18. MacKay, P., J. Lees, and K. Murray. 1981. The conversion of hepatitisBcoreantigensynthesized in E. coliinto eantigen. J. Med. Virol. 8:237-243.
19. Magnius, L. O., and J. A. Espmark. 1972. Newspecificities in Australia antigen positive sera distinct from LeBouvier deter-minants. J.Immunol. 109:1017-1021.
20. Ohori,H., N.Shimizu, E.Yamada, S. Onodera, and N. Ishida. 1984. Immunological and morphological properties of HBeAg subtypes (HBeAg/1 and HBe/Ag/2) in hepatitis B virus core
particles. J. Gen. Virol. 65:405-414.
21. Ohori, H., M.Yamaki,S. Onodera, E. Yamada, and N. Ishida. 1980. Antigenic conversion from HBcAg to HBeAg by degra-dation of hepatitis B core particles. Intervirology 13:74-82. 22. Onodera, S., H. Ohori, M. Yamaki, and N. Ishida. 1982.
Electron microscopy of human hepatitis B virus cores by negative staining-carbon film technique. J. Med.Virol. 10:147-155.
23. Ou, J.-H.,0.Laub, and W. J. Rutter. 1986. Hepatitis B virus gene function: the precore region targets the core antigen to cellular membranes and causes the secretion of the e antigen. Proc. Natl. Acad. Sci. USA 83:1578-1582.
24. Rossmann, M. G., and J. E. Johnson. 1989. Icosahedral RNA virus structure. Annu. Rev. Biochem. 58:533-537.
25. Schlicht, H. J., R.Bartenschlager, and H. Schaller. 1991. Bio-synthesis and enzymatic properties of the hepadnaviral reverse transcriptase, p. 145-169. In A. McLachlan (ed.), Molecular biology of the hepatitis B virus. CRC Press, Boca Raton, Fla. 26. Stahl, S., and K. Murray. 1989. Immunogenicity of peptide
fusions to hepatitis B virus core antigen. Proc. Natl. Acad. Sci. USA 86:6283-6287.
27. Standring, D. N. 1991. The molecular biology of the hepatitis B virus core protein, p. 145-169. In A. McLachlan (ed.), Molec-ular biology of the hepatitis B virus. CRC Press, Boca Raton, Fla.
28. Standring, D. N., J.-H. Ou, F. R.Masiarz, and W. J. Rutter. 1988. A signal peptide encoded within the precore region of hepatitis B virus directs the secretion of a heterogeneous population of e antigens in Xenopus oocytes. Proc. Natl. Acad. Sci. USA 85:8405-8409.
29. Standring,D. N., J.-H.Ou, and W. J. Rutter. 1986. Assembly of viral particles in Xenopus oocytes: pre-surface antigens regulate secretion of the hepatitis B viral surface envelope particle. Proc. Natl. Acad. Sci. USA 83:9338-9342.
30. Takahashi, K., M. Imai, T. Gotanda, T. Sano, A. Oinuma, S. Mishiro, Y. Miyakawa, and M. Mayumi. 1980. Hepatitis B e antigen polypeptides isolated from the sera of individuals in-fected with hepatitis B virus: comparison with HBeAg polypep-tide derived from Dane particles. J. Gen. Virol. 50:49-57. 31. Takahashi, K., A. Machida, G. Funatsu, M. Nomura, S. Usuda,
S. Aoyagi, K. Tachibana,Y.Miyakawa,and M. Mayumi. 1983. Immunochemical structure of hepatitis B antigen in the serum. J. Immunol. 130:2903-2907.
32. Uy, A., V. Bruss, W. H. Gerlich, H. G. Kochel, and R. Thomssen. 1986. Precore sequence of hepatitis B virus inducing e antigen and membrane association of the viral core protein. Virology 155:89-96.
33. Witherell, G. W., J. M. Gott, and 0. C. Uhlenbeck. 1991. Specific interaction between RNA phage coat proteins and RNA. Prog. Nucleic Acid Res. Mol. Biol. 40:185-220. 34. Yamaguchi, M., T. Hirano, H. Hirokawa, K. Sugahara, H.
Mizokami, and K. Matsubara. 1988. Cryo-electronmicroscopy of hepatitis B virus core particles produced by transformed yeast: comparison with negative staining and ultrathin section-ing. J. Electron Microsc. 37:337-341.
35. Yang, S. Q., M. Walter, and D. N. Standring. 1992. Hepatitis B virus p25 precore protein accumulates in Xenopus oocytes as an untranslated phosphoprotein with an uncleaved signal peptide. J. Virol. 66:37-45.
36. Zhou, S.,andD.N.Standring. 1991. Production of hepatitis B virus nucleocapsidlike core particles in Xenopus oocytes: as-sembly occurs mainly in the cytoplasm and does not require the nucleus. J. Virol. 65:5457-5464.
37. Zhou, S., and D. N. Standring. 1992. Hepatitis B virus capsids are assembled from core protein dimers. Proc. Natl. Acad. Sci. USA89:10046-10050.
38. Zhou, S., S. Q. Yang, and D. N.Standiing.1992. Characteriza-tion of hepatitis B virus capsid particle assembly in Xenopus oocytes. J. Virol.66:3086-3092.