1
A study on factors affecting the safety zone in ship-to-ship LNG
bunkering
Sayyoon Park
a,b,cand Byongug Jeong
b, Joon Young Yoon
cand Jeom Kee
Paik
a,d,e,*
aDepartment of Naval Architecture and Ocean Engineering, Pusan National University, Busan 46241, Republic of Korea
bDepartment of Naval Architecture, Ocean and Marine Engineering, University of Strathclyde, Glasgow G4 0LZ, UK
cGas & Safety R&D Department, Daewoo Ship Building & Marine Engineering (DSME), Geo-je 53302, Republic of Korea
dDepartment of Mechanical Engineering, University College London, London WC1E 7JE, UK
eThe Korea Ship and Offshore Research Institute (The Lloyd’s Register Foundation Research Centre of Excellence), Pusan National University, Busan 46241, Republic of Korea
*Corresponding author. Tel.: +82 51 510 2429; fax: +82 51 518 7687. E-mail address:
Abstract
The objective of this paper is to examine the characteristics of leaked-gas dispersion in ship to ship LNG bunkering, thereby providing an insight towards determining the appropriate level of safety zones in which the potential hazards pertinent to LNG bunkering are required to be minimized. For this purpose, parametric studies are undertaken in various operational and environmental conditions, with varying geometry of the bunkering ship, gas leak rate, wind speed and wind direction. The study applies computational fluid dynamics (CFD) simulations for case-specific scenarios where a hypothetical LNG bunkering ship with a capacity of 5,100 m3 in tank space is considered
2
and a 319,000 DWT very large crude oil carrier. Research findings reveal that the gas leak rate and leak duration would be the parameters with the most influence in determining the extent of safety zones. It is pointed out that other parameters such as ship geometry, wind speed, and wind direction are also influential parameters. Details of the computations and discussions are presented.
Keywords: LNG fuelled ship; LNG bunkering; Ship to ship LNG bunkering; Gas leaks; Safety zone
1. Introduction
LNG (liquefied natural gas) has been acknowledged as one of the most credible substitutes for conventional liquid marine fuel sources in response to stringent international/local regulations (Aymelek et al. 2015; IGU 2017; IMO 2014). Since the world’s first LNG fuelled ship (LFS) emerged in 2000, the market for LFS’s has steadily grown over the past two decades. As of 2017, more than two hundred LFS’s have been either contracted or operated (Ship & Bunker 2017). This trend brings about the optimistic anticipation that LFSs will account for 30 % of new global shipbuilding projects by 2025 (Lloyd’s Register 2012).
3
acquisition to build a bunkering infrastructure. These problems include not only social but also economic burdens. On the other hand, STS has emerged as the most practical way to ensure high bunkering volumes and good access without regional restrictions (Ship-technology 2017; Schuler 2017; Ship & Bunker 2016).
LNG, on the other hand, is a cryogenic liquid and typically stored in an adiabatic storage tank. Unwanted events related to LNG release from any part of the system may lead to several potential threats such as asphyxiation, cryogenic burns, structural damage, rapid phase transitions (RPT) and even fires and explosions when the leaked gas meets a source of ignition (ISO 2015; Crowl and Louvar 2001). Moreover, these initial incidents often lead to a larger chain of accidents (IMO 2015; Lasse 2015).
With the advent of LNG-fuelled ships since 2000, International Maritime Organization (IMO) has introduced an ‘International Code of Safety for Ships using Gases or other Low-flashpoint Fuels’ (IGF Code) in an effort to preserve the safety of these new types of commercial ships. Given that LNG bunkering is an inevitable process which may pose higher risk than the conventional bunkering for oil products, the IGF Code does not deal with specific guidelines for enhancing the safety of LNG bunkering (IMO 2017). As a result, safety insights into LNG bunkering have been divisive.
4
the development of quantified guidelines is an urgent and essential task for safer bunkering.
Meanwhile, there have been several studies investigating the risk of marine LNG systems. Davies and Fort (2014) in Lloyd’s Register group have examined the likelihood of LNG release. Elsayed et al. (2009) applied a multi-attribute risk assessment methodology to LNG carriers during loading/offloading at terminals. Arnet (2014) carried out a quantitative risk assessment of LNG bunkering operations, while DNVGL (2014) investigated the risk pertinent to probable leakage accidents with the aid of PHAST software. Sun et al. (2017) performed CFD simulations to estimate the consequential levels of LNG spillage during STS bunkering. Jeong et al. (2017a) investigated the risk of a high-pressure fuel gas supply system (HP-FGSS) fitted to a conceptual LNG fuelled ore carrier from the standpoint of structural safety against vapour cloud explosions. Using FLACS CFD tool, Pedersen and Midda (2012) conducted a series of simulations for vented gas explosions. Fan et al. (2016) have estimated the proper extent of the safety zone of an LNG bunkering vessel with the LNG storage capacity of 10,000 m3 which is transferred to an LNG fuelled 18,000 TEU container ship.
Despite the voluminous research, their focuses were too case-specific to obtain a general insight into major or minor elements that may contribute to influencing the safety of LNG bunkering, thereby determining the extent of the safety zone. Instead, research findings from those studies are more relevant to individual circumstances than general ones. As a result, in the course of investigating the risk of STS LNG bunkering and quantifying the extent of the safety zone, IMO member states have yet to develop their own regulations applicable to all LNG fuelled ships.
5
investigating characteristics of leaked-gas dispersion in STS LNG bunkering in order to identify the significant parameters influencing the extent of the safety zone for LNG bunkering. Case studies were carried out with two typical ocean-going cargo ships: a container ship with the capacity to carry 18,000 twenty-foot equivalent units (TEUs) and a very large crude-oil carrier (VLCC) with 319,000 dead weight tonnage (DWT). These ships were assumed to be subjected to STS bunkering through an LNG bunkering vessel with the capacity to store and carry 5,100 m3. The risk assessment followed a generic and
deterministic approach to estimate the level of safety zones for the case ships. By identifying the critical parameters influencing the enlargement of the safety zone, this work is aimed at providing the insights of ship-owners and flag authorities into the estimation of appropriate safety zones during LNG bunkering, playing a role as a preliminary study in the hopes of contributing to enhancing current international regulations.
2. Procedure of the Study
2.1. Parametric studies
During LNG bunkering, an unwanted LNG leakage may happen in the form of jet release which would form flammable gas disperses across surroundings (ISO 2015). Therefore, the personnel within an area where the level of gas concentration is high enough to be flammable are deemed to be at risk.
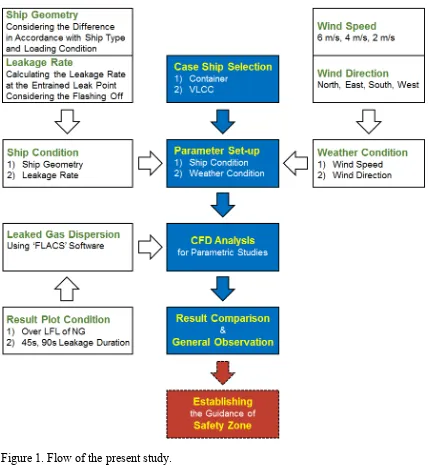
6 Figure 1. Flow of the present study.
7
namely North, East, South, and West are considered.
The impacts of gas dispersion in various individual leak scenarios are assessed using FLACS Ver. 10.5, a computational fluid dynamics (CFD) method (Gant and Hoyes 2010). Based on past studies and software guidelines (Gexcon AS 2016; Hjertager 1985; Patankar 1980; Launder & Spalding 1974), the Reynolds averaged Naiver-Stokes equations coupled with the k-ε model for turbulence equations are applied for the present simulations.
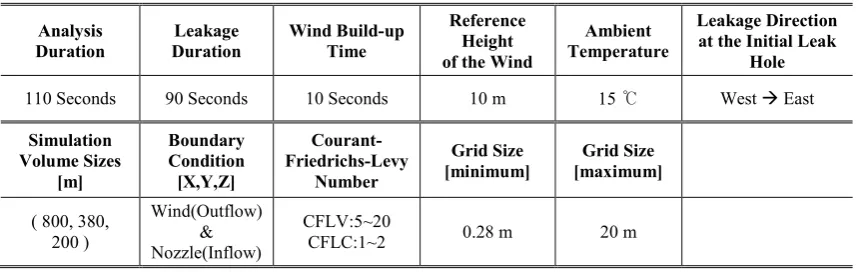
[image:7.595.84.518.587.724.2]The critical distance and area in relation to the flammable gas dispersion are defined where the gas concentration is higher than LFL (lower flammable limit) of natural gas. According to DNV guidelines (DNV 2012), the leak duration is assumed to be 90 seconds corresponding to the working time of the ESD valve (60 seconds for detection and activation, 30 seconds for quarantine). Since the effects of gas dispersion may vary depending on the passage of time, the critical distances and areas are investigated at two leak durations, i.e., with 45s and 90s. The annual average temperature is assumed to be 15 ℃ for the CFD modelling input values. In all cases, the direction of the initial leakage is considered to be towards the East. The details in simulation conditions are summarized in Table 1.
Table 1. General information of the CFD modelling condition. Analysis
Duration Duration Leakage Wind Build-up Time
Reference Height of the Wind
Ambient Temperature
Leakage Direction at the Initial Leak
Hole
110 Seconds 90 Seconds 10 Seconds 10 m 15 ℃ West East Simulation
Volume Sizes [m]
Boundary Condition [X,Y,Z]
Courant-Friedrichs-Levy
Number
Grid Size
[minimum] [maximum] Grid Size
( 800, 380, 200 )
Wind(Outflow) & Nozzle(Inflow)
CFLV:5~20
CFLC:1~2 0.28 m 20 m
8
The measured critical distances and areas are directly used to represent the extent of the safety zones. These results obtained from various scenarios are then collected and plotted in the diagram as a convenient format for comparison across the scenarios. This paper then investigates the parametric sensitivity in determining the extent of the safety zone.
2.2. Technical reference of CFD
2.2.1. Governing equation
Mathematical models for compressible fluid flow used in FLACS software are described as below.
Conservation of mass:
( v ) ( j j)
j
m u
t x V
(1)
where
j is the porosity, uj is the mean velocity [m/s], v is the volume porosity, m isthe mass rate [kg/s], is density [kg/m3] and V is the volume [m3].
Momentum equation:
, , 0
( v i) ( j i j) v ( j ij) o i w i v( ) i
j i j
p
u u u F F g
t x x x
(2)
where Fw i, is the flow resistance due to walls,
ij is the stress tensor, Fo i, is the flowresistance due to sub-grid obstructions, p is the absolute pressure [Pa], x is the concentration ratio of gas [mol/mol] and t is the time [s].
2.2.2. Turbulence model
9
model that solves two additional transport equations; one for turbulent kinetic energy and the other for dissipation of turbulent kinetic energy. Following Boussinesq eddy viscosity assumption, an eddy viscosity models the Reynolds stress tensor as follows:
2
( )
3
j i
i j eff ij
j i
u u
u u k
x x
(3)
where is the density [kg/m3], ,
i j
u u are the mean velocities [m/s],
eff is the effectiveviscosity [Pa·s], x xi, j are the concentration ratios of gas [mol/mol], kis the turbulent kinetic energy [m2/s2] and
ij
is the Kronecker delta function.A few constants are included in the equations mentioned above. In FLACS code, the set of constants indicated in Table 2 are used as discussed by Launder and Spalding (1974).
Table 2. A set of constants used for the turbulence model.
𝑐𝜇 𝑐1𝜀 𝑐2𝜀 𝑐3𝜀
0.09 1.44 1.92 0.8
2.2.3. Wall functions
10
2.2.4. Wind boundary
Wind boundary reproduces the properties of the atmospheric boundary layer close to Earth’s surface. Monin & Obukhov developed a theory to explain buoyancy effects on the atmospheric boundary layer and defined a characteristic length scale:
*3
a p a
s c T u L
gH
(4)
where, T is the turbulent,
is the Von Karman constant, *u is the friction velocity [m/s],
g is the gravitational acceleration [m/s2] and
s
H is the sensible heat flux from the surface. The Monin-Obukhov length is a measure of the stability of the atmospheric boundary layer.
3. Parametric Studies
3.1. Target ships
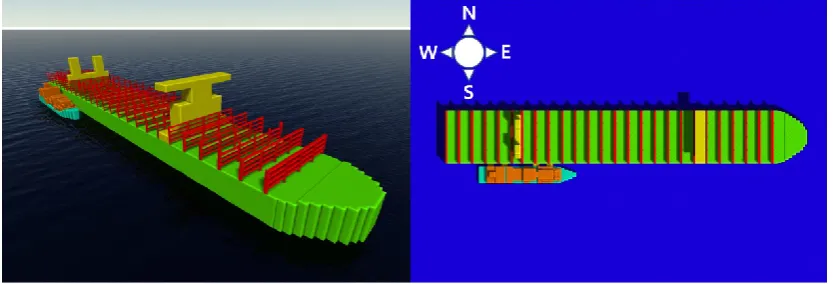
The specification of the target ships and the bunkering vessel are summarized in Table 3. The freeboard of the container ship is 17.2 m, while that of the VLCC is 9.7 m. In the full load condition, the depth of the container ship, including the height of the four layers of stacked container cargo, is estimated at 48.78 m.
According to the Ship to Ship Transfer Guide for Petroleum, Chemicals and Liquefied Gases (CDI et al. 2013), the fender size between the LFS and bunkering vessel can be calculated using Equation (5). As indicated in Table 4, the results of calculations reveal that the 4 pieces (3.3 m x 6.5 m) of fender should be arranged accordingly. Figures 2 to 4 show the geometry model of the case ships and the bunkering vessel.
2 ( ) ( )
( ) ( )
Displacement of the ship A Displacement of the ship B C
Displacement of the ship A Displacement of the ship B
11 Table 3. General information of the target ships
Principle Particulars Container Ship 18,000 TEU (Case Ship 1)
319,000 DWT VLCC (Case Ship 2)
5,100 m3
LNG Bunkering Vessel
L x B x D x d [m] 399 × 58.6 × 33.2 × 16.0 336 × 60 × 30.5 × 20.8 107.6 × 18.4 × 9 × 4.7 LNG Fuel Tank Volume
[m3] 6,000 (full) / 5,100 (Operating) 5,100
[image:11.595.87.511.231.334.2][Note] L=Length, B=Breadth, D=Depth and d=draft
Table 4. Results of Fender size calculations. Criteria:
[image:11.595.89.510.380.519.2] [image:11.595.90.507.578.720.2]Berthing Coefficient (C) [Tonnes]
Suggested Fenders [Quantity]
Typical HP Pneumatic Fender
(50kPa) [m]
Calculated (C): Case Ship 1 (Container Ship)
[Tonnes]
Calculated (C): Case Ship 2
(VLCC) [Tonnes]
10,000 3 or more 2.5 x 5.5
14,760 14,640 30,000 4 or more 3.3 x 6.5
Figure 2. Geometry of target ship 1 (container ship) in full load condition.
12
Figure 4. Geometry of target ship 2 (VLCC class tanker).
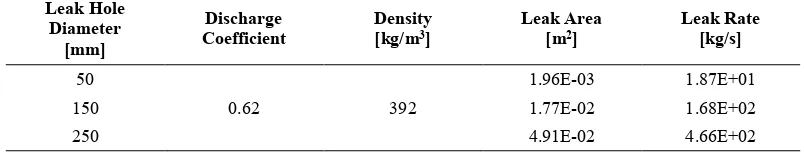
3.2. Effect of leak rate (leak amount)
The gauge pressure inside the LNG bunkering system is considered at 3 bar (g), and the boiling point of LNG at the pressure is about -141 ℃ (Jeong et al. 2017b; DNV 2012).
The density of LNG at the proposed pressure and temperature is assumed to be 392 kg/m3.
The discharge coefficient is taken as 0.62 for a sharp-edged leakage hole. Using Equation (6) below, the leakage rate at the initial leakage point can be calculated.
2 g
Q C A p (6)
where Q is the leak rate [kg/s], C is the discharge coefficient, A is the cross sectional area of the leak point [m2],
ρ
LNGis the density of LNG [kg/m3], and Pg is the guague pressure
inside the pipe [Pa].
Table 5. Leak rate depending on leak hole (size). Leak Hole
Diameter [mm]
Discharge
Coefficient Density [kg/m3] Leak Area [m2] Leak Rate [kg/s]
50
0.62 392
1.96E-03 1.87E+01
150 1.77E-02 1.68E+02
[image:12.595.96.498.650.727.2]13
Due to the high pressure in operation, an LNG leak is likely to be a jet. As a realistic phenomenon, part of the leaked liquid would immediately evaporate under the ambient condition, which can be described as the ‘flashing effect'. This effect is generally determined by the properties of the material and operating conditions such as storage temperature, the typical boiling point, the heat capacity of the gas and the latent heat of evaporation.
In this context, as described in Figure 5, the concept of flash utility is introduced to supplement the limitations of CFD where it is technically impossible to model and simulate the entire process ranging from the initial LNG leak, evaporation and gas dispersion at once. Meanwhile, the flash utility provides the most realistic and technically feasible alternative to calculate the leak area, flow rate, and equivalent rate (fuel concentration) at Xf where the initial LNG leak is completely vaporized. Then, the
simulations directly deal with the effect of gas dispersion with the flow of gas-air mixture estimated at Xf.
Calculation results are summarized in Table 6. It is noted that the leak rate at the initial hole represents the pure LNG leak rate, whereas the flow rate at Xf represents the flow of
the gas mixture added with air which is significantly higher than the initial flow of the leaked LNG.
On the other hand, the equivalence ratio represents the mixture ratio (concentration ratio) between the gas and air at Xf. It can be defined as the ratio of the mass of fuel to
the mass of oxygen, divided by the ratio of the mass of fuel to the mass of oxygen at the stoichiometric concentration as indicated in Equation (7). In this paper, the equivalence ratio value at Xf is calculated as 7.39.
( / )
( / )
fuel oxygen
fuel oxygen stoichiometric
mass mass
Equivalence Ratio
mass mass
14
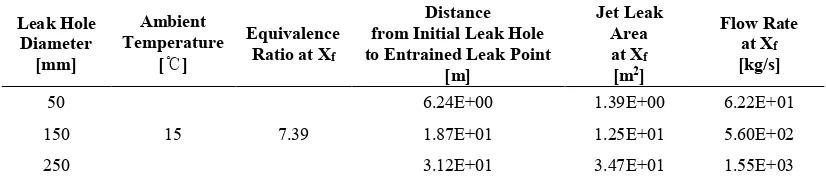
Figure 5. Flash description in a liquefied gas leakage accident (Gexcon 2017).
Table 6. Results of flow rate calculations at the entrained point using flash utility. Leak Hole
Diameter [mm]
Ambient Temperature
[℃]
Equivalence Ratio at Xf
Distance from Initial Leak Hole to Entrained Leak Point
[m]
Jet Leak Area at Xf
[m2]
Flow Rate at Xf
[kg/s]
50
15 7.39
6.24E+00 1.39E+00 6.22E+01
150 1.87E+01 1.25E+01 5.60E+02
250 3.12E+01 3.47E+01 1.55E+03
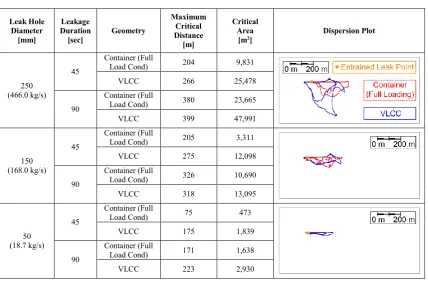
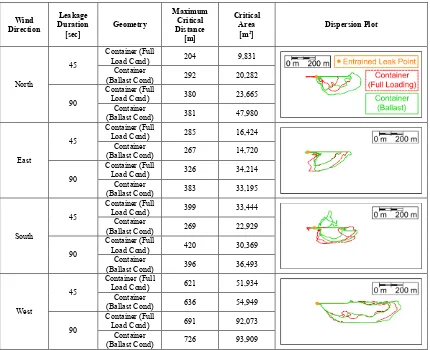
To investigate the effect of the leakage amount on determining the level of the safety zone, two parameters, namely leak rate, and its duration are varied while the wind speed and direction are fixed at 6 m/s and north. Table 7 indicates the relationship between the leakage amount and maximum critical distance (represented by the maximum length of gas reaching the flammable level) and the critical area (designated by the gas dispersion area within the flammable level). Given the lack of quantified guidelines safety zone is to be established in accordance with the level of the maximum critical distance and the area, the results of analysis reveal that both high leak rate and prolonged leak isolation would lead to extending the safety zone.
[image:14.595.91.504.304.394.2]15
[image:15.595.85.514.349.630.2]This means that the severity of flammable dispersion is higher in open spaces than in congested spaces; it can be perceived that the gas spreads out quickly and widely in open spaces while congested surroundings are more likely to capture the gas within the limited space than open surroundings. As a result, the maximum critical distance and area subject to the safety zone are more extensive for open spaces than congested spaces in general. It is also important to mention that the container ship in the full load condition is relatively more influenced by the leakage amount than the VLCC tanker. This points out that the congestion level is also a sensitive parameter to extend the safety zone.
Table 7. Maximum critical distance under various leak amounts for container ship-VLCC tanker Leak Hole Diameter [mm] Leakage Duration
[sec] Geometry
Maximum Critical Distance [m] Critical Area
[m2] Dispersion Plot
250 (466.0 kg/s)
45
Container (Full
Load Cond) 204 9,831
VLCC 266 25,478
90
Container (Full
Load Cond) 380 23,665
VLCC 399 47,991
150 (168.0 kg/s)
45
Container (Full
Load Cond) 205 3,311
VLCC 275 12,098
90
Container (Full
Load Cond) 326 10,690
VLCC 318 13,095
50 (18.7 kg/s)
45
Container (Full
Load Cond) 75 473
VLCC 175 1,839
90
Container (Full
Load Cond) 171 1,638
VLCC 223 2,930
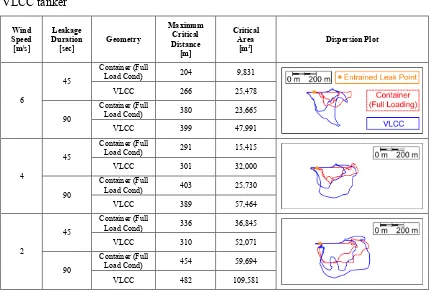
3.3. Effect of wind speed
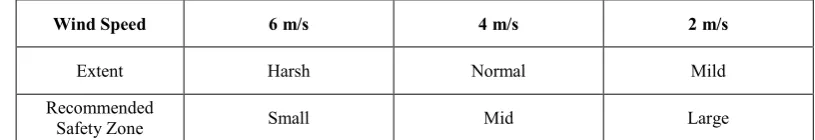
16
[image:16.595.83.513.231.526.2]maximum leak rate of 466.0 kg/s (250 mm leak hole dia.) and the Northerly wind direction with two leak durations, 45s, and 90s were considered to be the fixed parameters. Under this condition, three wind speeds - 6 m/s (harsh), 4 m/s (normal) and 2 m/s (mild) were applied as variables.
Table 8. Maximum critical distance under various wind speeds for container ship-VLCC tanker Wind Speed [m/s] Leakage Duration [sec] Geometry Maximum Critical Distance [m] Critical Area
[m2] Dispersion Plot
6
45
Container (Full
Load Cond) 204 9,831
VLCC 266 25,478
90
Container (Full
Load Cond) 380 23,665
VLCC 399 47,991
4
45
Container (Full
Load Cond) 291 15,415
VLCC 301 32,000
90
Container (Full
Load Cond) 403 25,730
VLCC 389 57,464
2
45
Container (Full
Load Cond) 336 36,845
VLCC 310 52,071
90
Container (Full
Load Cond) 454 59,694
VLCC 482 109,581
17
zone. Also, it may be worthwhile highlighting that the impact of the wind speed is also influenced to some extent by the surrounding conditions.
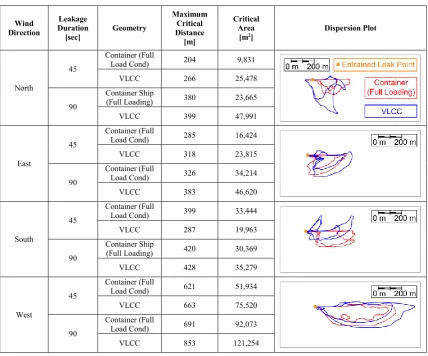
3.4. Effect of wind directions
Table 9 summarizes the results of the analysis to investigate the influence of wind directions on the fixed condition of the maximum leak rate (466.0 kg/s at 250 mm leak hole dia.) and the wind speed (6 m/s). In addition to the Northerly wind direction, as a reference case, three other representative wind directions are considered in East, South and West. As with other cases, the direction of the leak is considered to be from West to East.
In the Easterly wind, it is found from the analysis that the critical distances and the areas are relatively small. This is because the wind direction is opposite to the direction of the gas discharge from the leakage hole. In the Southerly wind, the maximum critical distance turned out to be more extensive, but the critical area was set up less than in most of the Easterly wind scenarios. However, such trend was entirely invalid for the container ship in full load condition (congested space) in which the pile of on-board cargo is proven to be an object to hinder the gas spreading freely above the deck.
18
Table 9. Maximum critical distance under various wind directions for container ship-VLCC tanker
Wind Direction
Leakage Duration
[sec] Geometry
Maximum Critical Distance [m] Critical Area
[m2] Dispersion Plot
North
45
Container (Full
Load Cond) 204 9,831
VLCC 266 25,478
90
Container Ship
(Full Loading) 380 23,665
VLCC 399 47,991
East
45
Container (Full
Load Cond) 285 16,424
VLCC 318 23,815
90
Container (Full
Load Cond) 326 34,214
VLCC 383 46,620
South
45
Container (Full
Load Cond) 399 33,444
VLCC 287 19,963
90
Container Ship
(Full Loading) 420 30,369
VLCC 428 35,279
West
45
Container (Full
Load Cond) 621 51,934
VLCC 663 75,520
90
Container (Full
Load Cond) 691 92,073
VLCC 853 121,254
3.5. Effect of geometric difference due to the loading condition
To investigate the effect of the surrounding circumstances, unload condition (ballast condition) of the container ship is considered in the analysis additionally. The results in the full load condition are compared with those in the ballast condition. Table 10 summarizes the results.
19
[image:19.595.84.514.217.567.2]show that the open surrounding condition would generally be more critical than the congested surrounding condition regarding the formation of flammable gas in the event of an accidental leakage.
Table 10. Maximum critical distance under various wind directions for container ship-containership Wind Direction Leakage Duration [sec] Geometry Maximum Critical Distance [m] Critical Area
[m2] Dispersion Plot
North
45
Container (Full
Load Cond) 204 9,831
Container
(Ballast Cond) 292 20,282
90
Container (Full
Load Cond) 380 23,665
Container
(Ballast Cond) 381 47,980
East
45
Container (Full
Load Cond) 285 16,424
Container
(Ballast Cond) 267 14,720
90
Container (Full
Load Cond) 326 34,214
Container
(Ballast Cond) 383 33,195
South
45
Container (Full
Load Cond) 399 33,444
Container
(Ballast Cond) 269 22,929
90
Container (Full
Load Cond) 420 30,369
Container
(Ballast Cond) 396 36,493
West
45
Container(Full
Load Cond) 621 51,934
Container
(Ballast Cond) 636 54,949
90
Container (Full
Load Cond) 691 92,073
Container
(Ballast Cond) 726 93,909
4. Discussion on Determining the Safety Zone
20
distance and area were estimated at 853 m and 121,254 m2 respectively. For the container
ship in full load condition, the safety zone could be as low as 75 m in distance and 473 m2 in the area when subjected to the 45s LNG leak with small leak (18.7 kg/s at 50 mm
leak hole diameter) condition with the Southerly wind at 6 m/s.
The results of the parametric studies show that the impact of the leakage amount would be significant in determining the safety zone as presenting both a high leakage rate and leakage duration result in more extensive critical distances and areas to be set in general. Results reveal that the wind speed also has a critical impact on extending the safety zone, but the tendency is inversely proportional; the higher wind speed led to smaller critical zones.
In short, this research recommends that if the LNG bunkering conditions are likely to face a high level of leakage rate and duration, extensive safety zones may be required; it implies that large-scale LNG bunkering may need more extensive safety zones. The reverse is also true. Table 11 and 12 summarize the research findings.
Table 11. Comparison of the case ships regarding the safety zone level under the various leak rates.
Leak Hole Dia. 250 mm 150 mm 50 mm
Leak Rate Large Normal Small
Recommended
[image:20.595.90.498.688.758.2]Safety Zone Large Mid Small
Table 12. Comparison of the case ships regarding the safety zone level under the various wind speeds.
Wind Speed 6 m/s 4 m/s 2 m/s
Extent Harsh Normal Mild
Recommended
21
Table 13. Comparison of the case ships regarding the safety zone level under the various wind directions.
Wind Direction Wind in Opposite Direct. to Gas Ejection Wind in Perpendicular Direct. to Gas Ejection Wind in Same Direct. to Gas Ejection
Dispersion Effect Small Normal Large
Recommended
Safety Zone Small Mid Large
The results of the case studies to investigate the effects of wind directions reveal that the safety zone may need to be set broadly when the wind direction is in the same direction with that of the gas discharge from the leak hole. The results associated with the analysis of the impact of wind direction show that the surrounding condition (congested or open) has a critical influence on determining the level of the safety zone. If a gas leak is more likely to occur in an open space, the impact of gas dispersion will be severe. In this context, the general recommendations for establishing safety zones can be derived concerning the congestion ratio of the subject area where the leaked gas would spread as indicated in Table 14. Hence, the VLCC tanker with the lowest congestion ratio (Case ship 2) needs to establish a larger safety zone than that for the container ship (Case ship 1). Since the congestion ratio of the container ships in ballast condition is lower than that of the container ship in full load condition, a wider safety zone for the container ship in ballast condition needs to be recommended.
Table 14. Comparison of the case ships regarding the safety zone level under the different congestion ratios.
Ship Geometry (Container- Full loading) Target ship 1 (Container-Ballast) Target ship 1 Target ship 2 (VLCC)
Congestion Ratio High Mid Low
Recommended
22 5. Concluding Remarks and Further Studies
The safety zone for enhancing the safety of LNG bunkering needs to be established along with the space between the LNG fuelled ship and the bunkering vessel. Given the lack of quantified guidelines for establishing the safety zone in industry practice, this paper delivers a remarkable research work providing ship designers, owners and rule-makers with an insight into the potential extent of flammable gas dispersion through the case studies with two representative ship types. The case studies dealt with the event of accidental LNG leaks in accordance with different bunkering conditions and accidental scenarios.
The main objective of the present study has been to examine the characteristics of leaked-gas dispersion in a ship to ship LNG bunkering and to determine a safety zone where the hazards can be minimized. In this context, research findings can be summarized that the geometry of the ships and the state of cargo shipment are important parameters in establishing the safety zone as gas congestion/ventilation are significantly affected by the surrounding conditions.
It is recommended to devise ways to reduce the leak rate and leak duration in the bunkering process so as to minimize the impact of accidental LNG release. It is also important to emphasize that the cargo loading should be carefully planned during the bunkering since the extent of gas spread may be affected by the ship’s draught and the surrounding conditions exposed to the leaked gas. Wind speed and wind direction also need to be cautiously considered when determining the safe zone for LNG bunkering so that the hazards associated with leak-gas dispersion can be minimized.
23
ship geometry are also essential elements when establishing the safety zone. It is believed that this suggestion will contribute to enhancing the safety of LNG bunkering by establishing the safety zone in a more realistic way to supplement the shortcomings of the current practice where there has been a tendency to disregard or under-estimate such conditions.
It is obvious that the parameters affecting the hazards are the subject variables as applied in this paper. Meanwhile, the present study was aiming at obtaining the general trends and relationships between LNG bunkering parameters. Considering that the industry practice is lacking in terms of determining the safety zone for the LNG bunkering, it is believed that the insights developed in the paper may provide useful information as a corner stone. Nevertheless, in order to quantify the extent of safety zones in a more realistic way, a probabilistic analysis needs to be undertaken with a set of credible scenarios that represent all of the possible events involving extensive variations of influential parameters.
Acknowledgements
24 References
Arnet NML. 2014. LNG bunkering operations: establish probabilistic safety distances for LNG bunkering operations [Master's thesis, Department of Energy and Process Engineering]. Trondheim, Norway: Norwegian University of Science and Technology.
Aymelek M, Boulougouris EK, Turan O, Konovessis D. 2014. Challenges and opportunities for LNG as a ship fuel source and an application to bunkering network optimisation. Proceedings of International Conference on Maritime Technology and Engineering, 15-17 Oct, Lisbon, Portugal.
Bosch, C. J. H. van den, Weterings, R. A. P. M. 1996. Methods for the calculation of physical effects. Report TNO CPR14E.
CDI, ICS, OCIMF, SIGTTO. 2013. Ship to Ship Transfer Guide for Petroleum, Chemicals and Liquefied Gases. East Horsley, UK: Chemical Distribution Institute.
Crowl DA, Louvar JF. 2001. Chemical process safety (fundamentals with applications), 3rd ed. Boston(MA), USA: Pearson Education.
Davies PA, Fort E. 2014. LNG as a marine fuel: likelihood of LNG releases. Journal of Marine Engineering and Technology. 12(3):3-10.
DNV. 2012. Failure frequency guidance: process equipment leak frequency data for use in QRA. Oslo, Norway: Det Norske Veritas.
DNVGL. 2014. Liquefied natural gas (LNG) bunkering study. Oslo, Norway: Det Norske Veritas Germanischer Lloyd.
DNVGL. 2015. In focus: LNG as ship fuel (latest developments and projects in the LNG industry). Oslo, Norway: Det Norske Veritas Germanischer Lloyd. Elsayed T, Leheta H. Shehadeh M. 2009. Multi-attribute risk assessment of LNG
carriers during loading/offloading at terminals. Ships and Offshore Structures. 4(2):127-131.
Fan H, Cheng K, Wu S. 2017. CFD-based simulation of LNG release during bunkering and cargo loading/unloading simultaneous operations of a containership. Journal of Shipping and Ocean Engineering 7:51-58.
Gant S, Hoyes J. 2010. Review of FLACS version 9.0: dispersion modelling capabilities, Buxton, UK: Health and Safety Executive HSE Books.
25
Hjertager BH. 1984. Computer simulation of turbulent reactive gas dynamics. Journal of Modeling, Identification and Control. 5(4):211-236.
IGU. 2017. World LNG report. Barcelona, Spain: International Gas Union.
IMO. 2002. MSC/Circ.1023 guidelines for formal safety assessment (FSA) for use in the IMO rule-making process. London, UK: International Maritime
Organization.
IMO. 2014. Third IMO greenhouse gas study-executive summary. London, UK: International Maritime Organization.
IMO. 2015. MSC 95/INF.17 information on incidents during bunkering of LNG. London, UK: International Maritime Organization.
IMO. 2017. International Code of Safety for Ships using Gases or other Low-flashpoint Fuels (IGF Code). London, UK: International Maritime Organization.
ISO. 2015. Guidelines for systems and installations for supply of LNG as fuel to ships. Geneva, Switzerland: International Organization for Standardization.
Jeong BW, Lee BS, Zhou P. 2017a. Quantitative risk assessment of fuel preparation room having high-pressure fuel gas supply system for LNG fuelled ship. Ocean Engineering. 137:450-468.
Jeong BW, Lee BS, Zhou P, Ha SM. 2017b. Evaluation of safety exclusion zone for LNG bunkering station on LNG-fuelled ships. Journal of Marine Engineering and Technology; p.1-24.
Lasse K. 2015. LNG (NG) fuelled shipping: experience and regulations. Haugesund, Norway: Norwegian Maritime Authority.
Launder BE, Spalding DB. 1974. The numerical computation of turbulent flows. Computer Methods in Applied Mechanics and Engineering. 3(2):269-289. Patankar S. 1980. Numerical heat transfer and fluid flow. London, UK: CRC press. Pedersen HH, Midda P. 2012. Modelling of vented gas explosions in the CFD tool
FLACS. Chemical Engineering Transactions. 26:357-362.
Schuler M. 2017. World’s first purpose: built LNG bunkering vessel delivered. Available from: http://gcaptain.com/worlds-first-dedicated-lng-bunkering-vessel-delivered-engie-zeebrugge/.
26
Ship & Bunker. 2017. LNG bunker barge construction leaves shipyard with $12.5million loss. Available from:
https://shipandbunker.com/news/world/909027-fleet-of-lng-fuelled-vessels-hits-200.