An investigative study on the influence of correlation
of PD statistical features on PD pattern recognition
Abdullahi Abubakar Mas’ud
Department of Electronic and Electrical Engineering Jubail Industrial College,
Jubail Industrial City, KSA
*
Email: [email protected]Brian G. Stewart
Department of Electronic and Electrical Engineering, University of Strathclyde, Royal College Building,
204 George Street, Glasgow G1 1XW. Email:[email protected]
Abstract— This paper investigates the influence of correlation coefficients of partial discharge (PD) statistical fingerprints on the classification performance of the ensemble neural network (ENN). PD measurements were carried out according to the IEC 60270 standard. Independent statistical parameters of skewness, kurtosis, correlation, discharge factor and modified cross-correlation were analyzed and utilized as inputs to the ENN. The ENN was applied to classify 2 PD datasets. One with PD statistical features and the other a combination of PD statistical features and their correlation coefficients. The results indicate that the ENN appears to show a statistically better performance using the statistical features mixed with their correlation coefficients as compared to the other dataset. This clearly shows that the correlation coefficients of statistical features can provide an improved classification and discrimination of PD patterns.
Keywords—partial discharge, ensemble neural network, correlation coefficients
I. INTRODUCTION
High voltage (HV) equipment such as transformers and underground cables play a vital role in the operation of a power system network. A sudden insulation failure of any HV apparatus results in a complete power system outage with serious financial consequences. For condition monitoring engineers, it is important to detect such faults at an early stage in order to arrive at the correct decision regarding the state of the insulation [1]. One major source of insulation failure is partial discharge (PD) [2]. PD refers to a confined electrical discharge that occurs within the insulation system subjected to HV stress [3]. Therefore, PD testing or classification is vital to determine the quality of the HV insulation system.
Recent studies show that an ensemble neural network (ENN) is an effective technique for classifying PD statistical fingerprints [2]. An ENN is a neural network (NN) model which trains several constituent neural network models and combines their output predictions. Therefore, this paper proposes an improved ENN model for classifying PD patterns comprising corona in air, void, surface discharge in air and surface discharge in oil. Independent statistical fingerprints obtained from the PD φ-q-n (phase-amplitude-number) patterns were analyzed and applied
as an input to the ENN. The φ-q-n patterns were obtained from artificially created PD models in the HV laboratory.
The overall aim of the work is to investigate whether the ENN can be able to recognize PD pattern statistical features and their correlation coefficient and to investigate whether including correlation coefficients improves further the ENN capability of recognition.
II. PD MEASUREMENT SYSTEM
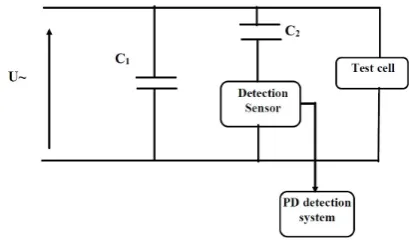
[image:1.595.331.536.487.609.2]In this paper, the PD measurements were conducted in accordance with the IEC 60270 standard as shown in Figure 1. The PD detection system produces φ-q-n patterns in real time, with a number of controls for varying the number of power cycle captures and phase or amplitude resolutions. It can measure specific parameters associated with the PD simultaneously, such as transient current, apparent charge, number of discharges and phase angle. To determine the apparent charge associated with the PD, calibration was carried out throughout the experimental process.
Fig. 1: PD measurement system. U is the high voltage source, C1 is the AC
measurement capacitor, C2 is the PD measurement capacitor
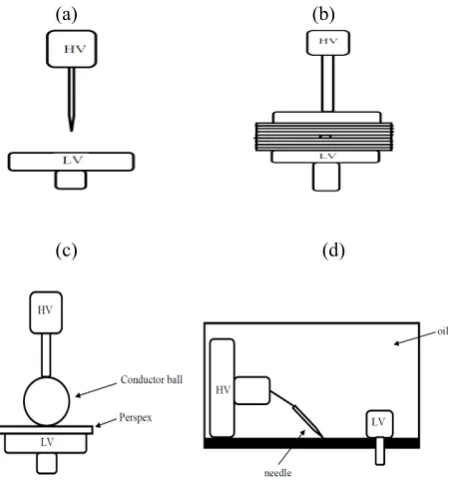
The corona PD model is a point-plane arrangement as shown in Figure 2a. The needle has a tip radius of 10µm and length of 3cm. Void measurements were performed with a void of 0.6mm at the center of 9 layers of polyethylene terephthalate (PET) as shown in Fig 2b. To investigate the surface discharge in air, a small brass ball of approximately 50mm in diameter was placed on Perspex insulation as shown in Figure 2c. Oil surface discharge was investigated by a needle-point placed on pressboard wholly immersed in Castrol insulating oil as shown in Fig 1d. The needle was placed at an angle of 10° onto the surface of pressboard and 25mm from an earth conductor.
(a) (b)
[image:2.595.310.550.125.365.2]
(c) (d)
Fig. 2: Artificially created PD faults a) corona in air b) voids c) surface discharge in air d) surface discharge in oil.
III. THE ENSEMBLE NEURAL NETWORK
An ENN is a learning technique that trains a number of component NNs and combines their output prediction [4]. It has been broadly investigated and established that the ENN can improve the generalization performance of the single NN by simply training diverse NN models and combining their output predictions [5]. Figure 3 shows the ENN model. There are 4 main types of ENN such as the simplest ENN, the naïve classifier, the generalized ENN and dynamically weighted ENN. Among them, the dynamically weighted ENN provides the optimum result at any given time the weight NN weights are evaluated. It was assumed that the component NN in the ensemble has output predictions as the probability of occurrence. For instance, if the b = f(a) is the prediction of the network and a is the input parameter. As b approaches a value of 1, it refers to a particular class. On the other hand, when b approaches a value of 0, it is optimistic that it does not refer to that specific class. The certainty of the NN is computed according to the literature [6]. Assuming the c represents the certainty of the NN.
The prediction of the ENN is computed as follows:
=
=
km i i
a
f
w
f
1
)
(
where the weights (wi ) are:
(
)
=
=
km i i i
a
f
c
a
f
c
w
1
))
(
(
[image:2.595.44.270.191.434.2])
(
Fig. 3: An ENN model
IV. THE STATISCAL FINGERPRINTS
3D φ-q-n patterns were obtained from the PD measurements. Then, PD statistical features comprising skewness, kurtosis, discharge factor, cross correlation and modified cross correlation were obtained from the distributions associated with pulse count Hn(φ), mean pulse
height Hqn((φ) and number-amplitude Hn(q) plots. These
distributions were represented in both the positive (+) and negative half power cycles (-). Similar to the literature [6], this paper applies 15 statistical fingerprints as inputs for training and testing the ENN. These comprises the skewness (sk) and Kurtosis (ku) of the Hqn(φ)+, Hqn(φ)-, Hn(q)+, Hn(q)-, Hn(φ)+
and Hn(φ)- distributions, the cross-correlation (cc), discharge
factor (Q) and modified cross-correlation (mcc). The mcc is the product of Q and cc.
The sk, ku, Q and cc are obtained as follows:
(
)
3 3
σ
μ
−
=
x
jP
jsk
(1)(
)
4 4
σ
μ
−
=
x
jP
j+ +
− −
=
S N S Q
S N S Q
Q (3)
−
−
− =
n y y
n x x
n y x y x cc
j j
j j
j j j j
2 2
2
2 ( ) ( )
(4)
where
µ: represent the mean value
σ: represent the standard deviation and
Pj is the probability of the discrete value xj and yj as the case
may be.
QS+ and QS-: represent the sum of discharge amplitudes in both
the +ve and negative half power cycles
NS+ and NS- : represent the number of discharges in both the
+ve and –ve half power cycle.
(a)
(b)
(c)
[image:3.595.303.556.60.420.2](d)
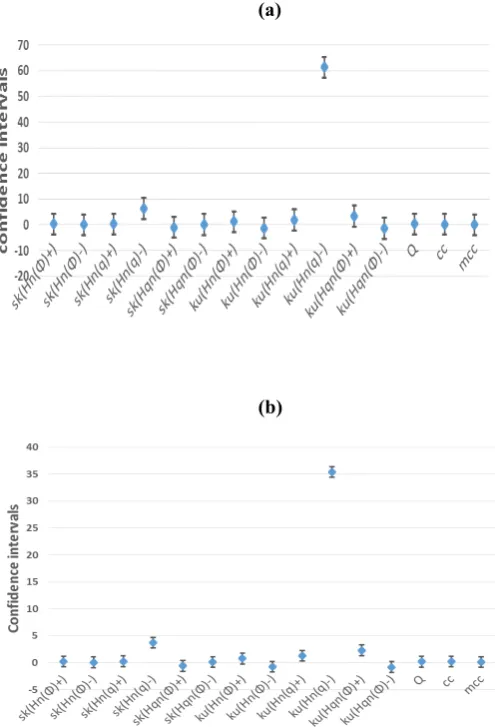
Fig 4: statistical confidence intervals for statistical fingerprints for a) corona in air b) corona in air and their correlation coefficients c) void d) void and their correlation coefficients.
Fig 4 shows the 95% confidence interval covering mean values of statistical fingerprints of corona and void discharges. For each of corona and void, two datasets are considered, one with the statistical features and the other with the same statistical features mixed with their correlation coefficients. Generally, error bars are wider for void as compared to corona due to the low repetition rate and higher amplitude associated with the positive corona [7] and this leads to the high peakedness of the Hn(q)- distribution. Generally, for both
corona and void, as expected the confidence intervals for statistical features mixed with their correlation coefficients are lower than the unmixed scenario. These results were found to be consistent with all the PD defects considered.
[image:3.595.40.288.320.684.2]V. PEARSON PRODUCT-MOMENT CORRELATION COEFFICIENT
The Pearson product-moment correlation coefficient, or widely known as the correlation coefficient (r), for a set of parameters refers to a technique of summarizing the degree of relationship between two parameters. The value of r usually summarizes the relationship between two variables having a linear relationship with each other. If the two variables have a linear relationship in the positive direction, then r is regarded as positive. If the linear relationship is in the negative direction, such that an increase in one variable leads to the decrease in the other, then r is regarded as negative. Thus the values of r fall between -1 to +1. Any value of r close to 0 signifies a weak relationship between the 2 variables.
The mathematical definition of r is as follows:
where:
X
andY
are the two variables to be analyzed.−
X
is the mean of X.−
Y
is the mean value of Y.VI. RESULTS AND DISCUSSION
In this section, attention will be drawn to the performance of the ENN in classifying and distinguishing PD fingerprints of 4 defects i.e. corona in air, internal PD in voids, surface PDs in air and oil with the inclusion of correlation coefficients measured over the duration of the tests. For each defect a series of PD measurements were conducted and statistical parameters computed. Two PD statistical dataset were created for each defect. One with only the statistical parameters obtained from the φ-q-n patterns as before and another comprising a combination of statistical parameters and their correlation coefficients. The overall aim is to be able to observe the robustness of the ENN in classifying the aforementioned dataset.
To evaluate and classify the PD patterns, two approaches are adopted. First, the ENN was trained with either of the 4 PD defects (corona in air, internal void, surface discharge in air and surface PDs in oil) and then testing carried out with the others. A similar strategy is then employed for the other 3 PD faults. For the PD dataset with only statistical parameters, 20 samples are randomly selected as input fingerprints for the ENN while remaining 8 automatically becomes the testing parameters. Furthermore, for the PD dataset comprising of both statistical parameters and their correlation coefficients,
30 samples are used as input to the ENN while the remaining 13 samples applied as the output parameters.
The input values for the ENN, are the sk and ku of the (Hn(φ)+, Hn(φ)-, Hqn(φ)+ and Hqn(φ)-), Q, cc and mcc, while
the output values are [0 0], [0 1], [1 0] and [1 1] for corona in air, internal void, surface discharge in oil and surface discharges in air respectively.
Owing to the instability associated with the constituent NNs in the ensemble, up to 100 iterations of the PD recognition rate were obtained for each PD defect, under different initial states of weights and biases. Initially, the input data is normalized in order to minimize the variance. 10 hidden layers with momentum rate of 0.6 and learning rate 0.05 are chosen for each constituent NN.
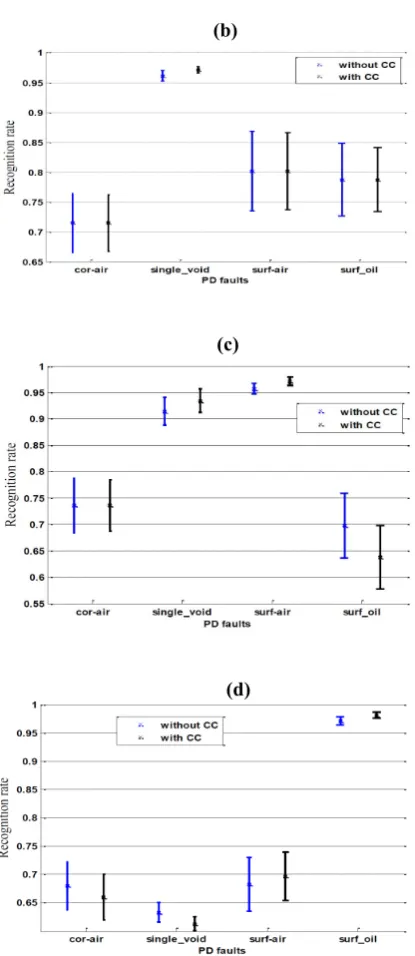
Figs 5a-d shows the average values, variances of the classification result of the ENN for the 4 PD fault scenarios considered, when the ENN is trained with any of the PD φ-q-n fingerprints and then consequently testing carried out with all the defects. The ENN performance was investigated and the results compared for the 2 categories of dataset i.e. one with only the PD φ-q-n statistical parameters and the other comprising the PD φ-q-n statistical parameters plus their correlation coefficients. It is interesting to note that when the ENN is trained and tested with the same PD defects, as expected, the mean recognition rates and their variances are as high as 97% for the 2 datasets. However, the PD statistical dataset combined with the correlation coefficients appears to show lower variance and higher recognition rate in most of the PD fault cases, showing an improved accuracy of the ENN result. As also expected, the variances are higher for the ENN result when trained with one PD defect and then tested with another different defect. These results appear to be consistent across all the various training and testing schemes. This indicates that correlation coefficients of statistical features are additional good measures for the evaluation of PD patterns within ENN applications.
(b)
(c)
[image:5.595.61.269.68.547.2]
(d)
Fig 5: The ENN recognition rates a) Training with corona in air and testing with all the PD defects b) Training with single void and testing with all the PD defects c) Training with surface discharge in air and testing with all the PD
defects d) Training with surface discharge in oil and testing with all the PD defects
VII. CONCLUSION
In this paper, the statistical features of PD defects were extracted and applied as input variables to an ENN. Firstly, the ENN was applied to classify PD fingerprints of 4 categories recorded as corona in air, internal void, surface discharge in air and surface PDs in oil. Secondly, the same ENN was again applied to classify another 4 categories of the aforementioned statistical features of the PD defects but with the inclusion of the correlation coefficients between the statistical parameters. The results clearly indicate that, in addition to the PD statistical parameters, inclusion of correlation coefficients improve the recognition rate of the ENN and can thus can be considered as additional good indicators for PD evaluation and classification.
ACKNOWLEDGMENT
This is to acknowledge the support of the High voltage lab of the Glasgow Caledonian University for providing the facilities to conduct this research.
REFERENCES
[1] H. C. Chen, "Fractal features-based pattern recognition of partial discharge in XLPE power cables using extension method, "IET Generation, Transmission & Distribution", Vol. 6, pp. 1096-1103, 2012.
[2] A. Abubakar Mas’ud, B. G. Stewart, and S. G. McMeekin, "Application of an ensemble neural network for classifying partial discharge patterns," Electric Power Systems Research, Vol. 110, pp. 154-162, 2014.
[3] E. Gulski and A. Krivda, "Neural networks as a tool for recognition of partial discharges", IEEE Trans. Electr. Insul., Vol. 28, pp. 984-1001, 1993. [4] H. Navone, P. Grannito, P. Verdes, H. Ceccato, "A learning algorithm for NN Ensembles", Artificial Intelligence, vol. 12, 70–74, 2001.
[5] D. Jiminez, "Dynamically weighted ensemble of neural network for classification", in: World Congress on Computational Intelligence, Anchorage, USA, 753–756, 1998.
[6] A. Abubakar Mas’ud, B. G. Stewart, and S. G. McMeekin."An investigative study into the sensitivity of different partial discharge φ-q-n pattern resolution sizes on statistical neural network pattern classification", Measurement, vol. 92, 497-507, 2016.