• No results found

Biochemical fingerprint of colorectal cancer cell lines using label-free live single-cell Raman spectroscopy

N/A
N/A
Protected

Academic year: 2019

Share "Biochemical fingerprint of colorectal cancer cell lines using label-free live single-cell Raman spectroscopy"

Copied!
11
0
0

Loading.... (view fulltext now)

Full text

Loading

Figure

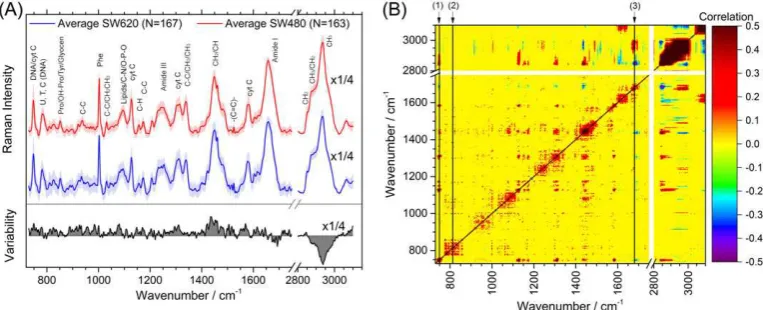
Figure 1a shows the SW620/SW480 averaged spectra,normalized to the Amide I peak, and variability for eachcell line
FIGURE 2PCA/LDA results. (a) Shape of the PCs 1 to 4 and of the LD (b) 2D plot of the scores for the first two PCs
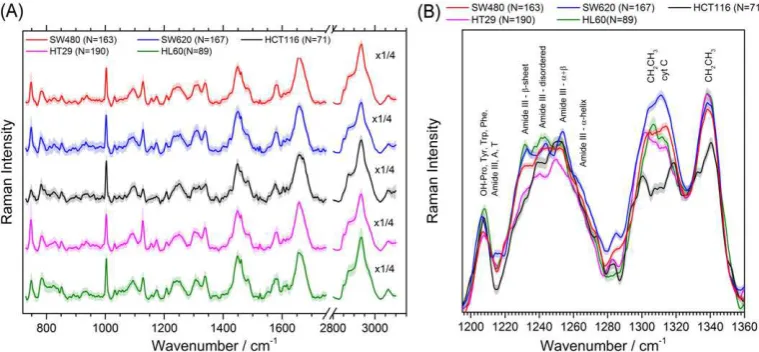
FIGURE 3(a) Average single cell spectra of the different cell lines used, where the error shows one standard deviation
FIGURE 4(a) Performance of the four classification methods when applied to the SW620 and SW480 datasets

References

Related documents

FIGURE 6 Direct comparison of the standard spectra for NHEK against the remaining established cell lines SiHa, CaSki and HaCaT.. Shaded bands refer to regions of