Continuing
vocational training
survey: CVTS 5
October 2017
2
Contents
Executive Summary 12
Introduction 12
Continuing Vocational Training provision 12
Participation in Continuing Vocational Training 13
Costs of Continuing Vocational Training Courses 14
Training policies and management processes 15
Quality assurance of Continuing Vocational Training 16
Barriers to provision of Continuing Vocational Training 16
Initial Vocational Training 16
Characteristics of enterprises in the survey 17
Overview 18
1 The CVTS Survey 20
Survey background 20
Objectives 20
Methodology 21
Sample completed 23
Non-response 24
Statistical significance 25
Note on rounding 26
Comparisons with previous surveys 26
Definitions 26
Definition of Continuing Vocational Training 26
Definition of Initial Vocational Training 27
2 Continuing Vocational Training Provision 28
Key points 28
Overview of provision of Continuing Vocational Training 29
Internal Continuing Vocational Training courses 32
External Continuing Vocational Training courses 33
Use of external Vocational Training providers 34
3
On-the-job training 37
Attendance at conferences, workshops, trade fairs and lectures 37
Self-directed learning 37
Job-rotation, exchanges, secondments or study visits 38
Learning and quality circles 38
Comparisons with CVTS4 39
3 Participation in Continuing Vocational Training 40
Key points 40
Overview of participation in Continuing Vocational Training 41 Proportion of the workforce participating in Continuing Vocational Training courses 41
Time spent on Continuing Vocational Training courses 43
Breakdown of time spent on internal and external Continuing Vocational Training
courses 48
Time spent on mandatory Vocational Training courses 50
Time spent on courses leading to a nationally-recognised qualification 52
Skills/competences developed 54
Participant numbers in ‘other’ Continuing Vocational Training 55
Comparisons with CVTS4 56
4 Costs of Continuing Vocational Training Courses 58
Key points 58
Total cost of Continuing Vocational Training courses in 2015 59
Cost breakdown 62
Comparisons with CVTS4 64
Funding of Vocational Training activities 64
Contribution to funds 64
Receipt of funds 66
5 Training Policies, Management Processes and Assessment of Continuing Vocational
Training Outcomes 70
Key points 70
Overview of strategies for the provision of Continuing Vocational Training 71 Skills/competences which are important to business development 72
Identification of skill and training needs 75
4
Training plans 81
Training budgets 83
Regulation of Vocational Training provision 85
Management processes 85
Comparisons with CVTS4 86
Assessment of Continuing Vocational Training Outcomes 87 6 Barriers to Provision of Continuing Vocational Training 91
Key points 91
Barriers for organisations that do not provide Continuing Vocational Training 91 Barriers for organisations that already provide Continuing Vocational Training 93
7 Initial Vocational Training 95
Key points 95
Employment of apprentices 95
Reasons for employing apprentices 97
Fees paid for apprentices 100
Plans for the future 101
Barriers to employing apprentices 104
8 Characteristics of enterprises 105
Key points 105
Sector 105
Size of enterprises 106
Size of enterprises in 2014 110
Hours worked 111
Labour costs 114
9 Overview 119
Key trends 119
Training in smaller and larger organisations 120
Sector variation in training 122
Barriers to training 124
Appendix 126
European Data 2010 126
5
Glossary and definition of terms 135
NACE Rev. 2 135
IDBR 135
ONS 135
UK SIC 2007 135
6
List of figures
Figure 1: C1-C10 Provision of Continuing Vocational Training (CVT) courses and other forms of CVT in 2015 by industry sector (all organisations) Unweighted sample bases in parentheses ... 30 Figure 2: C1a Provision of internal Continuing Vocational Training courses in 2015 by organisation size and industry sector (all organisations) Unweighted sample bases in parentheses ... 32 Figure 3: C1b Provision of external Continuing Vocational Training courses in 2015 by organisation size and industry sector (all organisations) Unweighted sample bases in parentheses ... 34 Figure 4: D1 Proportion of the total workforce that participated in Continuing Vocational Training courses in 2015 (all employees) Weighted sample bases in parentheses ... 42 Figure 5: D4 Average number of hours spent on CVT courses per employee, by
organisation size and industry sector (All organisations) Maximum unweighted sample bases in parentheses ... 45 Figure 6: D4 Average number of hours spent on CVT courses per participant, by
organisation size and industry sector (Organisations that provided CVT courses)
Maximum unweighted sample bases in parentheses ... 47 Figure 7: D5/D6 Proportion of training hours spent on internal and external training
courses in 2015 by organisation size and industry sector (Organisations that provided CVT courses) Weighted bases – total training hours - in parentheses ... 49 Figure 8: D9 Proportion of training hours spent on mandatory occupational health and safety courses by organisation size and industry sector (Organisations that provided CVT courses) Maximum unweighted sample bases in parentheses ... 51 Figure 9: D9 Proportion of training hours spent on courses leading towards a nationally- recognised qualification, by organisation size and industry sector (Organisations that provided CVT courses) Maximum unweighted sample bases in parentheses ... 53 Figure 10: D7 Skills/competences that were most important in relation to the number of all training hours spent on Vocational Training courses within paid working time in 2015 – prompted, multiple response up to three (Organisations that provided CVT courses)
Unweighted sample base = 2,340 *denotes less than 0.5% ... 54 Figure 11: Total average cost (£s) of providing CVT courses per organisation, by
organisation size and industry sector, 2015 (Organisations that provided CVT courses)
7
Figure 12: D14 2015 CVT course cost breakdown (Based on the total amount spent by organisations that provided CVT courses) Maximum unweighted sample base = 2,340; calculated based on weighted total costs base = £78,410,754 ... 63 Figure 13: C15 Average amount (£s) contributed to collective or other funds for
Vocational Training in 2015, by organisation size and industry sector (Organisations that contributed) Maximum unweighted sample bases in parentheses ... 66 Figure 14: C17 Average amount (£s) received in financial grants or subsidies for
Vocational Training in 2015, by organisation size and industry sector (Organisations in receipt of funding) Maximum unweighted sample bases in parentheses ... 68 Figure 15: C18 Which of the following does your organisation usually benefit from for providing Vocational Training (Organisations in receipt of funding) - prompted, multiple response Unweighted sample base = 417 ... 69 Figure 16: B9 Three skills/competences generally considered as important for the
development of the organisation in the next few years – prompted, multiple response up to three (all organisations) Unweighted sample base = 3,315 *denotes less than 0.5%
... 73 Figure 17: B9 Three skills/competences generally considered as important for the
development of the organisation in the next few years – prompted, multiple response up to three, by broad industry sector (all organisations) Unweighted sample bases in
parentheses *denotes less than 0.5% ... 74 Figure 18: B3 Proportion of organisations that regularly assess the skills and
competences they need (all organisations) Unweighted sample bases in parentheses .. 77 Figure 19: B2. Proportion that have a specific person or department within the
organisation that has responsibility for arranging Vocational Training, by organisation size and industry sector (All organisations) Maximum unweighted sample bases in
parentheses ... 80 Figure 20: B11 Proportion of organisations for whom the planning of Vocational Training within your organisation leads to a written training plan or programme, by organisation size and industry sector (all organisations) Unweighted sample bases in parentheses ... 82 Figure 21: B12 Proportion of organisations that have an annual training budget, which includes provision for Vocational Training, by organisation size and industry sector (all organisations) Unweighted sample bases in parentheses ... 84 Figure 22: B15 Aspects of the Vocational Training management process that staff
8
Figure 23: E2 Extent to which organisations usually assess the outcomes of Vocational Training courses, by organisation size and broad industry sector (where trained in 2015)
Unweighted sample bases in parentheses ... 88 Figure 24: F1 Reasons why organisations did not provide any Vocational Training
courses or any other forms of Vocational training for employees in 2015 – prompted, multiple response (where did not train in 2015) Unweighted sample base = 405 ... 92 Figure 25: E4 Reasons why organisations did not provide more vocational training
courses or other forms of vocational training in 2015 – prompted, multiple response (where trained in 2015) Unweighted sample base = 2,910 ... 94 Figure 26: A6 Proportion of organisations that employed anyone on a Government
recognised apprenticeship leading to a formal qualification in 2015, by organisation size and broad industry sector (all organisations) Unweighted sample bases in parentheses 96 Figure 27: G4 Reasons for offering apprenticeships (organisations that usually employ apprentices) – prompted, multiple response Unweighted sample base = 1,376 ... 98 Figure 28: G1b Proportion of organisations that paid fees to a training provider for the cost of the training for the apprentices employed by their organisaton in 2015, by
organisation size and broad industry sector (all organisations) Unweighted sample bases in parentheses ... 100 Figure 29: G1/G5 Proportion of organisations that ever employ apprentices and that plan to in the future, by organisation size, industry sector and training factors (all
organisations) Unweighted sample bases in parentheses ... 103 Figure 30: G2 Reasons why organisations did not employ anyone on a Government recognised apprenticeship in 2015 (organisations that did not offer apprenticeships in 2015) – unprompted, multiple response Unweighted sample base = 2,043 ... 104 Figure 31: A4/A5 How many of these people, employed at the end of the calendar year 2015 were male/female, by organisation size and broad industry sector (all organisations)
9
10
List of tables
Table 1: C1-C10 Provision of Continuing Vocational Training (CVT), including CVT courses and other forms of CVT, in 2015 overall and by organisation size and broad
industry sector (all organisations) 29
Table 2: C1 Whether organisations provided internal or external CVT courses in 2015, overall and by organisation size and broad industry sector (all organisations) 31 Table 3: D12 Most important training providers in terms of the number of hours of training with regard to external Vocational Training courses, by organisation size and broad industry sector (where employees participated in external CVT courses) -
prompted, multiple response up to 3 *denotes less than 0.5% 35 Table 4: C2-C10 Provision of other specified forms of Continuing Vocational Training in 2015, by organisation size and broad industry sector (all organisations) 36 Table 5: C3-C11 Proportion of trainees participating in other specified forms of
Continuing Vocational Training, by organisation size and broad industry sector (all
trainees) 56
Table 6: Provision of Continual Vocational Training (all organisations) 39 Table 7: Average number of hours spent on CVT courses (Organisations that provided
CVT courses) 57
Table 8: D13-D16/D1 Average cost (£s) of Continuing Vocational Training in 2015 per participant, per hour and per employee (Organisations that provided CVT courses) 62 Table 9: Cost (£) of providing Continuing Vocational Training, , 2010 and 2015 64 Table 10: Training processes, plans and policies by whether training is provided
(B2/B3/B11/B12/B13/B14) Figures in bold highlight higher propensity for formal planning amongst those providing both internal/external CVT courses 72 Table 11: B4 Ways in which organisations usually ensure they provide the skills and competences they will need in the future, by organisation size and whether trained (all
organisations) *denotes less than 0.5% 78
Table 12: Training processes, plans and policies by whether training is provided (all
organisations) 87
11
Table 15: Size of organisations (number of staff employed across all sites) – overall and
by industry sector (all organisations) 107
12
Executive Summary
Introduction
1. Continuing Vocational Training (CVT) is recognised both by the European Union and European national governments as a key contribution to competitiveness and productivity, to adaptation of workforces to changing patterns of production and work organisation, and to social cohesion.
2. To monitor progress and change in the delivery of the CVT supplied by
employers across Europe, the European Union commissions a regular survey of employers to assess their CVT practices.
3. This survey, the Continuing Vocational Training Survey (CVTS) takes place at 5-yearly intervals. The results of the fifth edition of the survey in the UK, ‘CVTS5’, are set out in this report. The international results will be published by Eurostat later this year.
4. It is based on telephone interviews with 3,315 UK employers with 10 or more employees. Survey fieldwork was undertaken between June 2016 and October 2016. It mainly concerns the vocational training undertaken by those employers in the ‘reference year’ of 2015 (previous reference years of earlier editions of the survey having been 1995, 1999, 2005, and 2010).
5. The survey used careful sampling and a data weighting process to ensure its results are representative of the wider population of UK employers with 10 or more employees from which the sample was drawn.
6. The UK survey encompassed a range of industry sectors but excluded
agriculture and related sectors and those, in public administration, education, and health and social work, in which public sector organisations predominate
(sectors A, O, P and Q in terms of their Standard Industrial Classifications). 7. On the whole, only statistically significant differences are reported. Where
comment is made on differences that are not statistically significant, this will be explicit.
Continuing Vocational Training provision
13
working contract or who benefit directly from their work for the enterprise such as unpaid family workers and casual workers. The training measures or activities must be planned in advance and must be organised or supported with the special goal of learning. Random learning and initial vocational training (IVT) are
explicitly excluded. Persons receiving training on an apprenticeship or training contract are not considered as receiving CVT.
9. 86% of employers provided their staff with some form of CVT in 2015.
10. 67% of employers provided CVT courses, as opposed to less formal forms of CVT (such as workshops, job-rotation, on-the-job training, or self-directed learning).
11. The provision of all forms of CVT was more frequent in larger employer organisations, but the increase is particularly pronounced with regard to the provision of CVT courses.
12. 44% of employers provided CVT courses internally to their organisation. 57% provided CVT courses delivered by an external provider. The likelihood of having provided both increases with employer size. Smaller employers, particularly, were more likely to have provided external than internal courses and not to have provided both types.
13. Where external provision was used, private training companies were the main source (84%) and these were used significantly more often than publicly-funded colleges or universities (39%).
14. Of the less formal methods of CVT, guided on-the-job training was, by a wide margin, the most significant, being provided by 63% of all employers.
15. There was an increase in the provision of CVT between 2010 and 2015; from 80% to 86% of all 10+ employers providing some form of CVT. There has been particular growth in the propensity to report self-directed learning (26% in 2010 and 34% in 2015).
Participation in Continuing Vocational Training
16. Three in ten employees (30%) participated in CVT courses in 2015. This
compares with 31% in 2010. Thus, there has been no significant change in this statistic over the last five years.
14
19. The average number of hours spent on CVT courses per employee was 9.2 hours, above the average of 7.7 hours in 2010.
20. The average number of hours spent on CVT courses per participant was 30, above the average of 26 in 2010. The conclusion is that slightly fewer
employees participated in training but participants spent longer periods training in 2015 than in 2010.
21. 36% of all hours on CVT courses were devoted to mandatory training, such as that related to health and safety (26% in 2010).
22. 31% of all hours on CVT courses were on courses leading to a nationally-recognised qualification (30% in 2010).
23. Technical, practical and job-specific skills were the most important focus of CVT courses.
Costs of Continuing Vocational Training Courses
24. Employers’ average total training expenditure on CVT courses in 2015 was around £31,300. This is higher than in 2010 (£17,300)1.
25. Average course expenditure varies from £9,200 in organisations with between 10 and 49 employees to around £671,000 in organisations with 500 or more
employees.
26. The average cost per participant relating to CVT courses was £1,320, which indicates an increase since 2010, when it was £765.
27. The average cost of CVT courses per hour was £44 but with significant variation between sectors. It was lowest, at £31, in the Accommodation and Food
Services sector and highest at £70 in the Mining/Utilities sector. There has been an increase in this figure since 2010, when it was reported at £30.
28. The average cost of CVT courses per employee (that is, averaged across all employees in the organisation whether they participated or not) was £400. As with cost per participant, this was lower in larger organisations than in smaller ones. It compares with £235 per employee in 2010.
29. Indirect costs (which include trainee absence from their work station and for travel and subsistence) accounted for a substantial proportion (33%) of the
15
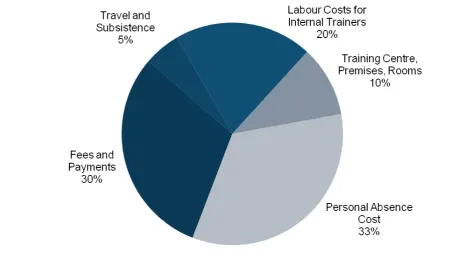
average cost of CVT courses. Direct costs in the form of fees and payments accounted for 30%, labour costs of internal training staff for 20%, and training facilities for 10%.
30. 17% of employers paid a training levy or contributed to collective or other funds for Vocational Training activities. Collective funds include funds or grants managed by a trade, industry or sector association that may have responsibility for arranging qualifications and training at a trade, industry or sectoral level. The average contribution was £10,600 (per contributing organisation).
31. 14% of employers received payments from collective funds. The average receipt was £8,000 (per receiving organisation). Government subsidies were the most frequent source of receipts, closely followed by receipts from training funds.
Training policies and management processes
32. Provision of CVT is generally associated with having supportive infrastructure, such as a training centre or a specific person or department with responsibility for staff training, and supportive processes, such as having formal planning of
training and training budgets.
33. Employers most frequently identified team-working skills, job-specific skills, and customer handling skills as skills which would be important to the future
development of their organisation.
34. 51% of employers reviewed skill needs regularly as part of their overall planning process; 41%, reviewed needs on an ‘as and when needed’ basis. 8% did not assess their skill needs. There has been a significant increase in the propensity to review skill needs since 2010. Five years ago, 43% reviewed skill needs regularly; 42% on an ’as and when needed’ basis, and 14% did not assess their skill needs. Overall, 92% of employers reviewed skill needs in 2015, compared with 86% in 2010.
35. The most vast majority of employers secured the skills they needed through a range of approaches, including training existing staff (93%); reallocating responsibilities to other staff (91%); recruiting new staff that already have the skills, competences and qualifications needed (85%) and recruiting staff who they then provide with specific training (83%).
16
37. 26% of employers reported that staff representation was involved in the management of their CVT provision.
38. Planning of CVT leading to a written training plan or programme was more frequent in 2015 than in 2010 (47%, compared with 42%).
Quality assurance of Continuing Vocational Training
39. 66% of employers supplying CVT formally assessed CVT outcomes.40. Of all employers that assessed training outcomes, 74% used certification after written or practical tests; 71% assessed participants’ behaviour or performance in relation to training objectives; 66% assessed or measured the impact of training on performance within the organisation; and 57% undertook a satisfaction survey among participants
Barriers to provision of Continuing Vocational Training
41. Where employers did not supply CVT at all, the main barriers were that they saw no need for training – their staff were fully skilled – or they preferred to recruit to obtain the skills they needed. ‘Supply-side’ barriers, which concern the
availability of suitable and affordable external training provision, were much less frequent though 19% said CVT courses were too expensive and the same
proportion that suitable courses were not available.
42. When employers who supplied CVT were asked to identify barriers to providing
more training, many (84%) said they had no need for more, fewer that they preferred to recruit (71%), and/or that staff workloads precluded more training (56%).
Initial Vocational Training
43. Initial Vocational Training (IVT) is training intended to prepare an individual for entry to an occupation via study or training towards to a formal qualification. To determine the extent of a particular form of IVT, organisations were asked to provide information on the number of people employed on a Government-recognised apprenticeship leading to a qualification during 2015.
44. 24% of employers employed apprentices in 2015. Most of these did so in order to secure their organisation’s future skills base.
17
proportion was significantly higher within Production/Construction organisations than within those in Service sectors (51%, compared with 39%).
46. Organisations were most likely to have paid fees for apprentices aged 19-24 (74%), while least likely to have done so for 25+ year olds (19%). Around half paid fees for 16-18 year old apprentices (51%).
47. The average fee paid to training providers for each apprentice was highest with regard to those aged 16-18 years (£2,600), followed by those aged 19-24 years (£2,200), falling to £2,000 for each apprentice aged 25+ years.
48. Around half of all organisations (53%) reported that they plan to offer
Apprenticeships in the future. This proportion increased with organisation size to more than four-fifths of organisations with 250 or more apprentices (82% of organisations with 250-499 employees; 87% of those with 500+ employees). 49. The proportion was higher among Production/Construction than Services
organisations (65%, compared with 49%), particularly within Construction (71%) and Manufacturing (62%).
50. Organisations that provided any CVT to employees in 2015 were significantly more likely to expect to offer apprenticeships in the future (56%, compared with 34% of organisations that did not provide any) as were organisations that contributed to collective funds in 2015 (69%, compared with 49%).
51. The vast majority of those already offering apprenticeship (91%) plan to in the future. This compared with 41% of those not offering them in 2015 and 36% of those that have never done so.
52. The pattern of interest in apprenticeships reflects past employment of
apprentices to a great extent but in all cases also exceeds it. It implies scope for growth in take up of apprenticeship initiatives, but chiefly within types of
organisations already predisposed to offering them.
53. Where employers did not employ apprentices, this was most frequently because they did not see them as relevant to their organisation (43%); 16% said there were no vacancies/need for new staff; 12% said that apprenticeships were not available or suitable for their type of activity.
Characteristics of enterprises in the survey
18
55. 57% of the workforce of the weighted sample was male, 43% was female. 56. On average, surveyed organisations employed 80 people.
57. On average, employees in surveyed organisations worked for 37 hours per week. 58. The average labour cost per employee in surveyed organisations was £22,200
per year in 2015.
59. The average labour cost per hour for all employees in surveyed organisations was £12.82.
Overview
60. The survey identifies a number of positive trends in employer training activity which are encouraging for public policies which seek to stimulate increased levels of skills in the UK’s workforce as a key driver of better productivity and competitiveness.
61. However, it was observed that there was a higher proportion of training related to health and safety in the latter year. This form of training is essential but does not necessarily increase a company’s average output per worker. In addition, one of the positive indicators was an increase in average training expenditure per trainee, but some of increase was the result of increased training costs – not all of the increased investment per trainee represents added value in the training which was delivered.
62. In respect of organisation size, a number of survey findings reflect those which have been consistently found in many other surveys (such as the national Employer Skills Surveys) over many years. Generally, smaller firms were less likely than larger ones to provide most forms of CVT than larger ones and to systematically plan such training as they do provide; and they are substantially less likely to offer apprenticeship trainng.
63. However, in other respects the survey reveals that smaller and larger firms do not greatly differ. As above, lower proportions of smaller firms offered training to their employees. However, when they did train, they tended to train a higher
proportion of their workforces – with the overall result that the overall likelihood of an employee in a small firm being trained was similar to that of an employee in a large one. In addition, the proporion of training time which was directed to
19
64. In respect of organisations’ sectors, the survey shows that firms in some sectors (including construction, ICT, and financial services) show, across a range of indicators, a high level of frequency of engagement in training activity; whilst firms in some other sectors (particularly wholesale and retail, transport, and hospitality) show relatively low frequency of engagement.
65. Broadly, such differences are likely to reflect a mix of the different characteristics of sectors, including the average size of firms in the sectors, the complexity of the functions and tasks which are performed by and within the sectors, and the
associated average skill levels which are required. In addition, other factors, such as sectors’average rates of staff turnover (affecting the volume of induction training), the extent to which sectors are subject to statutorily-regulated training, and, in the construction sector case, have an industry-wide levy system in place, are also likely to be relevant.
66. In respect of barriers to employer engagement in training, the survey shows (again as other UK skills surveys have consistently shown) that much the most frequent barriers to engagement are ‘demand-side’ones (particularly the
20
1 The CVTS Survey
Survey background
1. This report documents the result the fifth round of the EU Continuing Vocational Training Survey (CVTS5) undertaken in the UK between June 2016 and October 2016, and covering the reference period of the 2015 calendar year. The research was administered by BMG Research on behalf of the Department for Education (DfE).
2. This round (CVTS5) followed previous surveys carried out in 1995, 2000, 2005 and 2010, and formed part of a wider investigation spanning more than 30 European countries2. The survey has been carried out so that it conforms to the
requirements of the European Union’s Continuing Vocational Training Survey (CVTS5).
3. The Statistical Office of the European Commission (Eurostat) undertook co-ordination of the study and will publish results in late 2017, allowing a comparison of the UK against other European countries.
Objectives
4. The overarching aim of the research project was to conduct a survey of UK employers to explore the nature and extent of the vocational training that they provide.
5. Important research issues for which CVTS data were needed include: • The organisation and management of CVT in enterprises;
• the role of social partners;
• assessment of skill/training needs;
• volume of CVT and possible interaction with IVT; • incentives for enterprises to provide CVT;
• costs and financing of CVT in enterprises; obstacles for enterprises in providing CVT;
• the costs and financing of CVT in enterprises;
21
• and the provision of IVT (Initial Vocational Training or Apprenticeships as it is better known).
Methodology
6. The survey was targeted at enterprises with at least 10 employees across particular industry sectors. The survey excluded agriculture and related sectors and those in which public sector organisations predominate (A, O, P and Q3).
7. The target population was defined by the European Community to fulfil the regulation and ensure comparability with the sample design and results in the other participating countries.
8. Industry sector was defined using NACE Rev. 24 definitions in order to ensure
consistency with other participating EU and non-EU nations. NACE Rev. 2 and the UK Standard Industrial Classification 2007 (SIC 2007) exactly match5. The
industry sectors included in the survey are summarised in the table below:
NACE SIC 2007 NACE/SIC description6
B05-B09 5-9 Mining and quarrying and support activities
C10-C12 10-12 Manufacture of food products, beverages and tobacco
C13-C15 13-15 Manufacture of textiles and textile products Manufacture of leather and leather products
C17-C18 17-18 Manufacture of pulp, paper and paper products, Printing of newspapers
C19-C23 19-23 Manufacture of coke oven products Manufacture of flat glass
C24-C25 24-25 Manufacture of basic iron and steel and of ferro-alloys Manufacture of metal structures and parts of structures
3
A 01-03 Agriculture, forestry, fishing O 84 Public administration P 85 Education
Q 86-88 Human health and social work
4 For full explanation of NACE Rev 2 please see Glossary and Definition of terms towards the end of this
report
5 Source: UK Standard Industrial Classification of Economic Activities 2007 (SIC 2007): Structure and
Explanatory Notes Office for National Statistics, December 2009
6 “The UK SIC is based exactly on NACE but, where it was thought necessary or helpful, a fifth digit has
22
NACE SIC 2007 NACE/SIC description6
C26-C28 and C33 26-28, 33
Manufacture of electronic components, Repair of fabricated metal products
Manufacture of engines and turbines, except aircraft, vehicle and cycle engines
C29-C30 29-30 Manufacture of motor vehicles, Building of ships and floating structures
C16+C31-C32 16, 31, 32 Sawmilling and planing of wood, Manufacture of office and shop furniture, Striking of coins
D-E 35-39 Electricity, gas, steam and air conditioning supply, Water supply; sewerage, waste management and remediation activities
F 41-43 Construction
G45 45 Sale of cars and light motor vehicles
G46 46 Agents involved in the sale of agricultural raw materials, live animals, textile raw materials and semi-finished goods
G47 47 Retail trade in non-specialised stores with food, beverages or tobacco predominating
H 49-53 Transportation and storage
I 55-56 Accommodation and food service activities
J 58-63 Information and communication
K64-K65 64-65 Financial and insurance activities, Life insurance
K66 66 Administration of financial markets
L + M + N + R + S 68-82, 90-96
Real estate, renting and business activities, Professional, scientific and technical activities, Administrative and support service activities, Arts, entertainment and recreation, Other service activities
9. The in scope NACE Rev. 2/SIC 2007 sectors account for approximately 82% of UK enterprises with 10 or more employees. Thus, one in six UK enterprises that are classified within NACE Rev. 2/SIC 2007 codes A, O, P and Q are excluded from the survey.
10. Throughout the report, NACE Rev. 2 sectors have been grouped to provide larger, more robust sample sizes and to enable clearer, more concise
comparisons between similar sectors in tables and charts. These groupings are as follows:
23 • C10-C33: C Manufacturing • F41-F43: F Construction • G45-G47: G Wholesale, Retail • H49-H53: H Transport, Storage
• I55-I56: Accommodation, Food services • J58-J63: Information, Communication • K64-K66: Finance, Insurance
• LMNRS (68-82, 90-96): Business, Technical, Admin. Arts and Other Services
11. The European standard questionnaire was used as the basis for the survey with additional questions added in this UK survey. This was in order to maximise the opportunity to obtain key data on the total number of hours worked by employees and the total labour costs within an organisation and to ensure coverage of
employer practice with regard to apprenticeships. Some questions were re-worded in order that they might be clearer and more relevant to UK employers. The questionnaire used in the survey is available separately.
Sample completed
12. In total, 3,315 interviews were conducted. The majority of interviews were completed using Computer-Assisted Telephone Interviewing (CATI). On average, interviews took 26 minutes to complete. However, the average
interview length varied for training and non-training organisations, with interviews with non-training organisation taking considerably less time because of the substantial number of questions on training practices which were not relevant to these latter companies. A small number of online questionnaires were completed. 13. Interviews were conducted with the most senior person at the site in charge of
training policy. This was further defined as the person who decides what training providers to use or who has the best knowledge of what vocational training is carried out across all sites within the organisation.
14. The sample structure was calculated to specifications designed by the Statistical Office of the European Community (Eurostat) to ensure consistency of approach across all participating countries. It was based on population data, as provided by IDBR (ONS).
24
16. Based on the pre-determined number of contacts issued (as laid down by Eurostat’s specifications), a response rate of 25% was achieved overall. Based only the ‘contacted’ sample, where someone in the respondent organisation was spoken to and a definitive call outcome was obtained, the response rate was 37%.
Non-response
17. The survey aimed at obtaining many numeric responses and was challenging in terms of the demands it made on respondents. Non-response to specific
questions was anticipated in the design and in certain circumstances responses were imputed in order to ensure as comprehensive a dataset as possible. Full details of data imputations, both the rules governing imputing data and the extent to which data was imputed, are available in the technical report that is published separately. This process followed guidance given in the CVTS5 Manual.
18. The following variables were deemed to be key to the survey findings and were those in which imputation was permitted:
19. A3 20. Total number of persons employed at end of 2015
21. A4 22. Total number of hours worked in 2015 by persons employed
23. A5 24. Total labour costs (direct and indirect) of all persons employed in 2015
25. C1tot 26. Total CVT course participants
27. C3tot 28. Paid working time (in hours) spent on all CVT courses
29. C7sub 30. CVT costs sub-total 31. C7tot 32. Total costs CVT
33. PAC 34. Personal absence costs
35. In addition imputations were allowed and were carried out on the following variables (reference in questionnaire in Annex to this report):
25
36. It should be noted that the process of imputation and the fact that some
respondents could only estimate some characteristics of their training (such as its costs or the amount of time which employees spent in training) introduces a margin of error into the data (over and above normal sampling error). Some estimates in the survey should, therefore, not be read as having pinpoint accuracy but as general indications of employer behaviour.
37. There were varied response rates across sector and size categories. As a result some sector and size categories would be over-represented and some under-represented in the data. Particularly, since large organisations are fewer in number in the population, to obtain a statistically robust sub-sample of these organisations a higher proportion of the population was interviewed than of the vastly larger population of small organisations. By applying weighting factors to the data, the responses of larger organisations were scaled down in the
calculation of whole-sample statistics so that these are not biased by
over-representation of large-firm views. Thus, the employer population estimates from IDBR were used to both determine the sample structure and to weight the data to represent the poplation structure. Weighting factors are based on the business population and not on the distribution of employment. These factors are
presented in the Technical Report which is available separately.
Statistical significance
38. Based on a reported statistic of 50%, the overall sample of 3,315 for this survey is subject to a standard sampling error of +/-1.7%. Thus, there is 95%
confidence that the reported statistic would fall within a range of 48.3% to 51.7%. 39. A table which presents the level of standard error for a range of statistics, based
on the total sample and key sub-samples, is included in the Technical Report which is available separately.
40. Unless otherwise stated, discussion of comparisons between sub-samples and between the results of CVTS5 and results from previous CVT surveys is confined to differences which are statistically significant at a 95% confidence level.
26
Note on rounding
42. Throughout this report percentages have been rounded to the nearest whole integer. Further, average cost and cost per hour figures have been rounded to the nearest 10. The exceptions to rounding concern hourly costs and values for hours spent in training. These have been reported to two decimal points (in the case of figures that are based on £ sterling) and to one decimal point (in the case of figures that relate to parts of hours). This enables the reporting of small
differences between sample groups.
Comparisons with previous surveys
43. Findings from CVTS5 and previous surveys are compared where possible and appropriate. Reliable comparisons between surveys have to be on a like-for-like basis. That is to say, the samples that are being compared are similarly
structured and weighted and the question wording has to be substantially similar. For the purposes of comparisons with CVTS5, data from CVTS4 has been
filtered so that only NACE/SIC codes included in CVTS5 have been included in CVTS4 data (see paragraph 57). As in CVTS4, CVTS3 data included additional sectors but since CVTS3 data was unavailable for re-analysis, like-for-like comparisons with this survey (and earlier surveys) was not possible.
Definitions
44. The definitions, below, of Continuing Vocational Training and Initial Vocational Training, should be noted before reading the remainder of this report. The definitions of other terms used in the survey questionnaire are included in the Appendix.
Definition of Continuing Vocational Training
45. Before being asked questions about training within the organisation, respondents were given the definition of Continuing Vocational Training as follows:
• Continuing Vocational Training (or simply, Vocational Training) is training that would have been arranged for employees in advance, it would have been organised with a specific goal of developing new or existing
competences and skills, and it would have been fully or at least partly funded by your organisation. Funding would include the paid time at work employees were involved in the training. Vocational Training would
27
• Vocational Training does not include training for apprentices or new
employees. Trainees, people working on a training contract and inductions are not included in Vocational Training.
Definition of Initial Vocational Training
46. Initial Vocational Training (IVT) can be defined as follows. It is:
• Training intended to prepare an individual for entry to an occupation via study or training towards to a formal qualification.
28
2 Continuing Vocational Training Provision
1. This chapter discusses the provision of Continuing Vocational Training (CVT) by organisations with 10 or more employees in select industry sectors across the UK. CVT covers both courses and other, sometimes less formal, types of training of employees. To summarise the key characteristics of CVT:
The training must be planned in advance.
The training must be organised or supported with the specific goal of learning.
The training must be financed fully or at least partly by the enterprise.
Key points
2. 86% of employers provided their staff with some form of Continuing Vocational Training (CVT) in 2015.
3. 67% of employers provided CVT courses, as opposed to less formal forms of CVT (such as workshops, job-rotation, on-the-job training, or self-directed learning).
4. The provision of all forms of CVT was more frequent in larger employers, but the increase is particularly pronounced with regard to the provision of CVT courses. 5. Employers within the sectors of finance/insurance and business/technical/
administrative/arts/other services were significantly more likely than average to provide both CVT courses and other forms of CVT, while those in construction were significantly more likely to have provided CVT courses to their employees in 2015 and those in wholesale/retail significant less likely to have done so.
6. 44% of employers provided CVT courses internally to their organisation. 57% provided CVT courses delivered by an external provider. The propensity to have provided both increases with employer size. Smaller employers, particularly, were more likely to have provided external than internal courses and not to have provided both types.
7. Where external provision was used, private training companies were the main source (84%) and were used significantly more often than publicly-funded colleges or universities (39%).
29
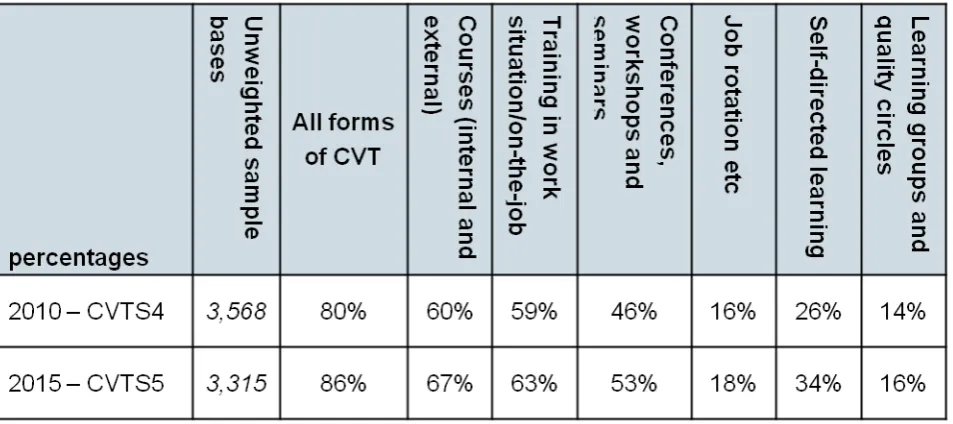
9. There was an increase in the provision of CVT between 2010 and 2015; from 80% to 86% of all 10+ employers providing some form of CVT. There has been particular growth in the propensity to report self-directed learning (26% in 2010 and 34% in 2015).
Overview of provision of Continuing Vocational Training
10. The majority of organisations (86%) participated in some form of ContinuingVocational Training (CVT), with two-thirds (67%) providing CVT courses. The propensity to do so increased with organisation size, as shown in Table 1. Table 1: C1-C10 Provision of Continuing Vocational Training (CVT), including CVT courses and
other forms of CVT, in 2015 overall and by organisation size and broad industry sector (all organisations)
Figures in bold are statistically significantly higher than average based on a 95% confidence level
11. By sector, while there was no significant difference in the propensity to provide CVT (courses and other forms) between the broad sector groups of
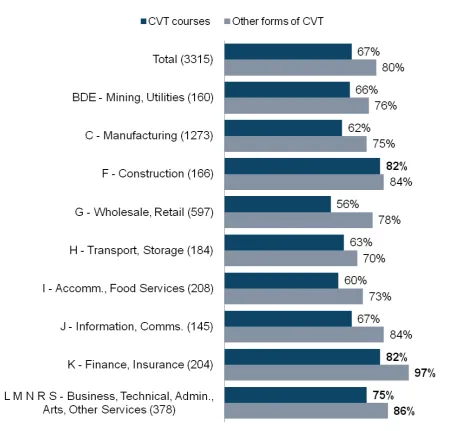
Production/Construction and Services, provision of any CVT was significantly higher within the sectors of Finance/Insurance (82% provided CVT courses, 97% provided other forms of CVT) and Business/Technical/Administrative/Arts/Other Services (75% provided CVT courses, 86% provided other forms of CVT), while Construction businesses were significantly more likely to have provided CVT courses to their employees in 2015 (82%).
30
Figure 1: C1-C10 Provision of Continuing Vocational Training (CVT) courses and other forms of CVT in 2015 by industry sector (all organisations) Unweighted sample bases in parentheses
Figures in bold are statistically significantly higher than average based on a 95% confidence level
13. Within organisations that had lower than average working hours per employee7,
there was less likely to be CVT, particularly in the form of CVT courses (79% any forms; 58% CVT courses). There is no significant difference in the propensity to provide CVT between organisations with working hours around the average or higher.
31
14. Organisations that reported workforce growth in the preceding 12 month period were significantly more likely than average to have provided CVT, again,
particularly in the form of courses (91% any forms; 75% CVT courses). Those that reported a decrease were also more likely than average to have provided CVT but this difference was not statistically significant. The fact that
organisations remaining the same size were less likely than average to have provided CVT would seem more significant. Their lack of need (in general terms) may be behind that.
15. CVT courses which organisations provided were more likely to have been provided externally than internally. However, as organisation size increases, provision of internal CVT courses increased until, in the largest organisation, internal provision overtakes provision of external CVT courses in frequency of occurrence.
16. A third of organisations (34%) provided both internal and external CVT courses in 2015. This increased to three-quarters (75%) of organisations with 500 or more employees (see Table 2).
Table 2: C1 Whether organisations provided internal or external CVT courses in 2015, overall and by organisation size and broad industry sector (all organisations)
32
Internal Continuing Vocational Training courses
17. Just over two-fifths of organisations (44%) provided internal CVT courses for their staff during the calendar year 2015. This proportion increases with organisation size to 82% of 500+ employee organisations.
[image:32.595.61.527.253.732.2]18. While there was little difference between the two broad sector groups of Production/Construction and Services, in more detail, the proportion of organisations that provided internal CVT courses is significantly higher than average within the Finance/Insurance sector (63%) (see Figure 2).
Figure 2: C1a Provision of internal Continuing Vocational Training courses in 2015 by organisation size and industry sector (all organisations) Unweighted sample bases in parentheses
33
External Continuing Vocational Training courses
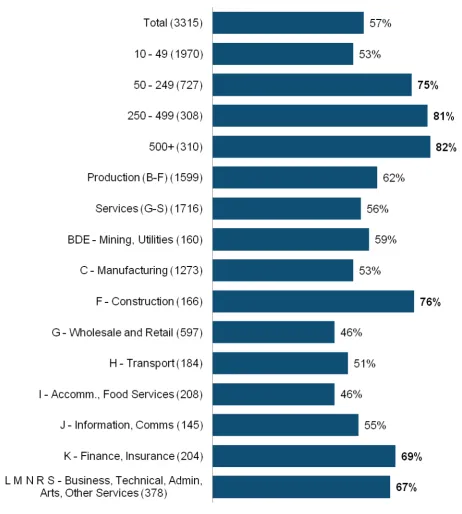
19. More than half of organisations (57%) provided external CVT courses for their staff in the calendar year 2015. Again, this increases with organisation size, but the gap between the smallest and largest organisations in this respect was narrower than observed for internal CVT courses.
34
Figure 3: C1b Provision of external Continuing Vocational Training courses in 2015 by organisation size and industry sector (all organisations) Unweighted sample bases in parentheses
Figures in bold are statistically significantly higher than average based on a 95% confidence level
Use of external Vocational Training providers
35
22. Private training companies were mentioned by 84% of organisations, increasing to 93% in organisations with 500 or more employees.
23. Fewer organisations used schools, colleges, universities and other higher
education institutions and public training institutions, but these training providers were significantly more important to larger organisations than to smaller ones. Table 3: D12 Most important training providers in terms of the number of hours of training with
regard to external Vocational Training courses, by organisation size and broad industry sector (where employees participated in external CVT courses) - prompted, multiple response up to 3
*denotes less than 0.5%
36
Other forms of Continuing Vocational Training (i.e. other than
CVT courses)
24. Four-fifths of organisations (80%) participated in some other form of CVT during the calendar year, 2015. This proportion increased from 78% amongst 10-49 employee organisations to 92% or more of those with 50 or more staff.
Table 4: C2-C10 Provision of other specified forms of Continuing Vocational Training in 2015, by organisation size and broad industry sector (all organisations)
Figures in bold are statistically significantly higher than average based on a 95% confidence level
37
attend conferences or the like and to encourage participation in self-directed learning.
26. More detail of the characteristics of provision of the different forms of ‘other’ Continuing Vocational Training is set out in brief sections following.
On-the-job training
27. Nearly two-thirds of organisations (63%) involved their employees in guided on-the-job training during 2015. This increased to 86% of 500+ employee
organisations, reflecting the general pattern of increasing propensity to provide training as organisation size increases.
28. The proportion was similar in both Production and Construction and Service sectors (61% and 63% respectively). However, the incidence of on-the-job training was particularly high in Finance/Insurance (76%) and
Business/Technical/Administration/Arts/ Other services (68%).
Attendance at conferences, workshops, trade fairs and
lectures
29. Around half of organisations (53%) involved their employees in planned training through attendance at conferences, workshops, trade fairs and lectures in 2015. The proportion gradually increases from 49% of organisations with between 10 and 49 staff to 79% of those with 250+ staff.
30. The propensity to attend conferences, workshops, trade fairs and lectures was significantly higher in Service sectors than in Production and Construction
sectors (55%, compared with 46%). It was particularly high in Finance/Insurance (84%), Business/Technical/Administration/Arts/ Other services (67%) and
Information/communication (65%). Organisations in Transport/Storage (34%), Accommodation/Food services (38%), Manufacturing (43%), and
Wholesale/Retail (47%) sectors were less likely than average to provide Continuing Vocational Training in this way.
Self-directed learning
31. One in three organisations (34%) reported that employees took part in planned training by self-directed learning in 2015. Once again, this proportion increased with organisation size from 30% of organisations with between 10 and 49
38
32. Organisations in Service sectors were more likely to report self-directed learning than those in Production and Construction sectors (36%, compared with 27%). In more detail, self-directed learning was most frequent in the sectors of
Finance/Insurance (72%), Accommodation/Food services (51%) and
Business/Technical/Administration/Arts/ Other services (43%) sectors. Levels of self-directed learning were low in Transport/Storage (22%), Manufacturing (25%), Wholesale/Retail (27%) and Accommodation/Food services (27%) sectors.
Job-rotation, exchanges, secondments or study visits
33. One in six organisations (18%) reported that their staff had been involved inplanned training through job-rotation, exchanges, secondments or study visits in 2015. This increased to around three-fifths (58%) of 500+ employee
organisations.
34. The proportion was similar in the broad Production and Construction and Service sectors (17% and 18% respectively) but, in more detailed sector breakdowns, was higher than average in Finance/Insurance (29%),
Business/Technical/Administration/Arts/ Other services (22%) and Manufacturing (20%) sectors.
35. Very few organisations in Transport/Storage (10%) and Accommodation/Food services (13%) sectors took this approach to training their staff in 2015.
Learning and quality circles
36. Where required, respondents were provided with an explanation of what was meant by learning and quality circles. This was as follows:
•
Learning circles are groups of persons employed who come together on a regular basis with the primary aim of learning more about the requirements of the work organisation, work procedures and work places.•
Quality circles are working groups with the objective of solving production and work place problems through discussion37. One in six organisations (16%) provided planned training through participation in learning or quality circles during 2015. The proportion increased to 33% of organisations with 500+ staff.
38. Participation in learning or quality circles was more prevalent in Service sectors (17%) than in Production and Construction sectors (14%). Use of this approach to planned training was significantly higher in
39
than average to have been used by organisations within the sectors of Transport/Storage (10%), Accommodation/Food services (11%), Wholesale/Retail (13%) and Construction (13%).
Comparisons with CVTS4
[image:39.595.64.541.246.458.2]39. The overall trend in Continuing Vocational Training is also observed. The basic pattern is one in which the proportion of organisations supplying Continuing Vocational Training in all formats increased from 2010 to 2015 (see Table 5).
Table 5: Provision of Continual Vocational Training (all organisations)
40
3 Participation in Continuing Vocational Training
1. This chapter discusses the level of participation in Continuing Vocational Training (CVT) courses, as well as in other forms of CVT, by employees within
organisations that provided CVT in 2015. It summarises the amount of time spent on CVT courses, the extent to which participants have worked towards nationally-recognised qualifications or been involved in mandatory training and the broad skills developed on CVT courses.
Key points
2. Three in ten employees (30%) participated in CVT courses in 2015. This compares with a similar proportion in 2010 (31%).
3. The average number of hours by organisation spent on CVT courses across all employees during 2015 was 1,100, which compares with 600 in 2010.
4. As a proportion of all hours worked, hours on CVT courses accounted for less than 1%.
5. The average number of hours spent on CVT courses per employee was 9.2 hours, above the average of 7.7 hours in 2010.
6. The average number of hours spent on CVT per participant was 30 (above the average of 26 in 2010).
7. The conclusion is that slightly fewer employees participated in training but participated for longer periods in 2015 than in 2010.
8. 36% of all hours on CVT courses were devoted to mandatory training, such as that related to health and safety (26% in 2010).
9. 31% of all hours on CVT courses were on courses leading to a nationally-recognised qualification (30% in 2010).
10. In terms of their share of hours spent on CVT courses, technical, practical and job-specific skills were the most significant.
41
Overview of participation in Continuing Vocational Training
Proportion of the workforce participating in Continuing
Vocational Training courses
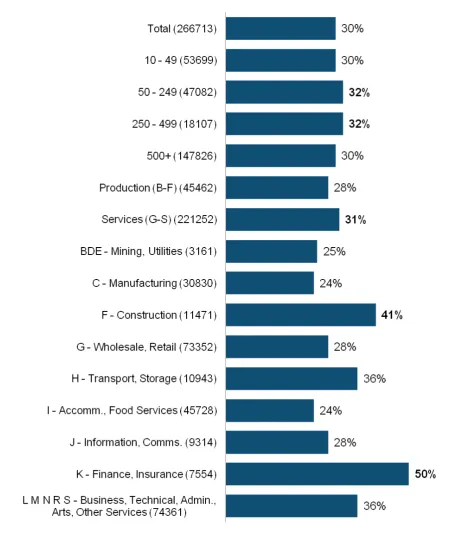
12. Three in ten employees (30%) participated in either internal or external CVT courses during 2015. Participation in CVT courses varied little with organisation size but the proportion was slightly higher than average within organisations with between 50 and 499 staff (32%) (see Figure 3).
13. The proportion was lower in broad Production and Construction sectors than in Service sectors (28%, compared with 31%), but was higher than average in Construction (41%). Half of employees (50%) within the Finance/Insurance sector have participated in CVT courses.
14. Participation as a proportion of the workforce was higher than average within organisations that reported a decrease in workforce size in the preceding 12 months (33%). This compared with 30% within organisations that reported an increase and 29% within those that reported no change.
15. Within organisations where employees each worked (on average) fewer8 than
average hours, the proportion of the workforce participating in CVT was higher than average (37%). This compared with 31% within organisations in which employees each worked (on average) higher9 than average hours.
8 Defined as fewer than 20% more than the overall working hours per employee.
42
Figure 4: D1 Proportion of the total workforce that participated in Continuing Vocational Training courses in 2015 (all employees) Weighted sample bases in parentheses
43
Time spent on Continuing Vocational Training courses
16. Organisations whose employees participated in CVT courses in 2015 were asked about the number of hours which their employees spent in CVT. The average number of paid working hours spent on CVT courses in 2015 (based on employees who took part) was 1,104.
17. One in six organisations (16%) reported that their employees (totalled for all employees in the organisation) spent between 1 and 30 hours on CVT courses, whilst just 5% reported that their employees (in total) spent 3,000 or more hours on courses in 2015.
18. Since the number of employees participating in CVT courses increases with organisation size, the total number of hours on CVT courses increases similarly. The average by organisation ranged from 412 hours in organisations with
between 10 and 49 employees to 1,629 hours in organisations with 50 and 249 employees to 4,084 in organisations with 250 to 499 employees, to just over 20,000 hours in the largest organisations (500 or more employees).
19. Services sector organisations reported a higher average of total employee hours spent on CVT courses than those in Production and Construction sectors (1,150 hours, compared with 952 hours). The average was particularly high in
Finance/Insurance (3,341) and lower than average within Accommodation/Food services (624) and Construction (819). The relatively low average in terms of hours spent on CVT courses in Construction, in the context of a higher than average proportion of the workforce in this sector, might suggest that training is more thinly spread across a larger number of employees compared with other sectors.
20. In relation to the total number of hours worked during the calendar year 2015 in organisations that provided Continuing Vocational Training, the average number of hours spent in vocational training accounted for less than 1% (0.6%).
21. There was little difference by organisation size and sector in this respect, although the proportion declined as organisation size increased; 1.1% within organisations with 10-49 employees, to 0.9% of those with 50-249 employees, to 0.7% of those with 250-499 employees, to 0.4% of those with 500+ employees. 22. By sector, the highest proportion of working hours spent on CVT courses was
44
23. In terms of the number of hours spent on CVT courses per employee in
organisations that provided course-based vocational training, the average was 9.2 hours. (Note: This average is calculated on a base of all employees in the organisation not just those employees who undertook CVT courses) (see Figure 5).
24. The average number of hours spent on CVT courses per employee decreased as organisation size increases from 13.5 hours in organisations employing between 10 and 49 employees to 6.3 hours in organisations employing 500 or more people.
25. The average figure was similar in both Production and Construction (10.9) and Services (8.9) sectors but, in more detail, was notably higher in the
45
Figure 5: D4 Average number of hours spent on CVT courses per employee, by organisation size and industry sector (All organisations) Maximum unweighted sample bases in parentheses
Statistically significant differences are not highlighted in this table because statistics are derived from responses to two different questions
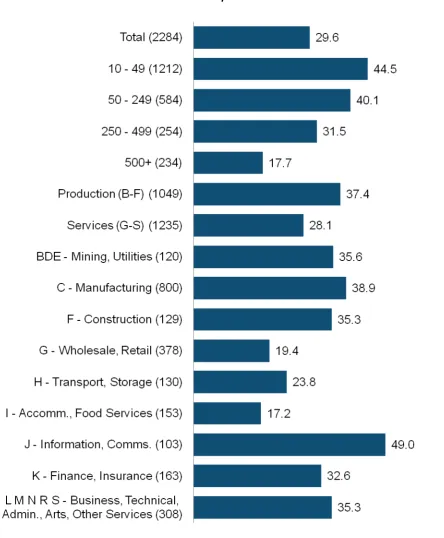
26. The average number of hours spent on CVT courses per participant in CVT courses in 2015 was 29.6 hours (see Figure 6).
27. Once again, the average number of hours per participant decreased as
46
28. The average was lower in Service sectors (28.1 hours) than in Production and Construction organisations (37.4 hours). However, it was higher than average in the Service sectors of Information/Comms (49.0), Business/Technical/Admin./ Arts/Other services (35.3) and Finance/Insurance (32.6) sectors. The Service sector overall average was reduced by relatively low number of hours in training per participant within Wholesale/Retail (19.4) and Accommodation/Food Services (17.2).
29. Focusing on where there has been workforce growth or shrinkage, organisations that reported a reduction of their workforce between 2014 and 2015 reported a higher number of hours in training per participant (42.8), while those that reported an increase also reported a higher than average number of hours but
47
Figure 6: D4 Average number of hours spent on CVT courses per participant, by organisation size and industry sector (Organisations that provided CVT courses) Maximum unweighted sample
bases in parentheses
Statistically significant differences are not highlighted in this table because statistics are derived from responses to two different questions
30. In summary, larger organisations, simply by virtue of their size, are likely to supply more total training hours but provide fewer hours in training as a
48
Breakdown of time spent on internal and external Continuing
Vocational Training courses
31. An analysis of the number of hours spent on internal or external CVT courses allows an approximation of the balance between the two in terms of the time spent on each. Overall, 53% of hours spent on CVT courses involve internal courses, with the remaining 47% involving external courses.
32. As organisation size increases, the balance shifts from external to internal courses, reflecting the extent to which larger organisations are more likely to have facilities for internal training.
33. Internal CVT courses accounted for a significantly larger than average majority of hours spent on CVT courses overall in three Services sector groups:
Accommodation/Food Services (70% of training hours on internal CVT courses); Information/Comms. (68%); and Transport/Storage (67%). External CVT
courses account for the majority of hours spent on CVT courses in the Construction sector (63%) (see Figure 7).
49
Figure 7: D5/D6 Proportion of training hours spent on internal and external training courses in 2015 by organisation size and industry sector (Organisations that provided CVT courses) Weighted
50
Time spent on mandatory Vocational Training courses
35. Organisations whose employees undertook CVT courses in 2015 were asked to provide an estimate of training hours that were spent on mandatory courses, such as those relating to occupational health and safety.
36. On average, 36% of all training hours were spent on these courses. This proportion varied little with organisation size, but was lower in organisations employing 500 or more staff (31%) (see Figure 8).
37. The average share of training hours spent on mandatory courses was
significantly higher in Production and Construction organisations than in those in the Service sectors (45%, compared with 33%).
38. In more detail, it was higher than average in the Construction (53%), Transport/Storage (50%) and Utilities (46%) sectors. It was lowest in Business/Technical/Admin./Arts/Other Services (27%).
51
Figure 8: D9 Proportion of training hours spent on mandatory occupational health and safety courses by organisation size and industry sector (Organisations that provided CVT courses)
Maximum unweighted sample bases in parentheses
52
Time spent on courses leading to a nationally-recognised qualification
41. Organisations whose employees undertook CVT courses in 2015 were alsoasked to provide an estimate of training hours that were spent on courses leading towards a nationally-recognised qualification.
42. On average, 31% of all training hours were spent on these types of courses. Again, the proportion varied little by organisation size (see Figure 9).
43. There was also little difference between organisations in broad Production/ Construction and Service sectors (35% and 29% respectively).
44. The proportion was higher than average in the Construction (45%) and
Transport/ Storage (44%) sectors, reflecting a stronger regulatory requirement for staff in these sectors to undertake mandatory courses. It was lowest in the
Information/Comms sector (18%).
53
Figure 9: D9 Proportion of training hours spent on courses leading towards a nationally- recognised qualification, by organisation size and industry sector (Organisations that provided CVT
courses) Maximum unweighted sample bases in parentheses
54
Skills/competences developed
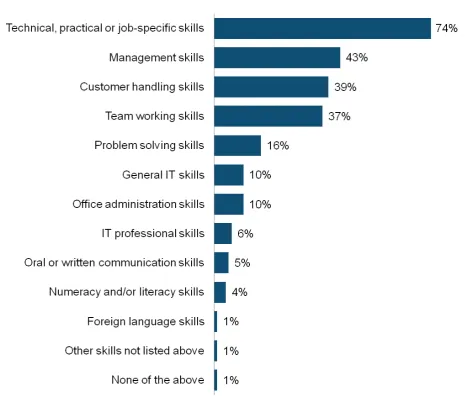
46. Respondents were asked which three skills or competences had been the most important to the organisation in terms of the number of all training hours devoted to relevant CVT courses within paid working time. The most frequently
mentioned (from a list of prompted responses) were technical, practical or job-specific skills (74%) (see Figure 10). Although, many of the other
skills/competences were mentioned significantly more often by larger
[image:54.595.63.529.286.698.2]organisations, technical, practical or job-specific skills were of similar importance across all size bands.
Figure 10: D7 Skills/competences that were most important in relation to the number of all training hours spent on Vocational Training courses within paid working time in 2015 – prompted, multiple response up to three (Organisations that provided CVT courses) Unweighted sample base = 2,340
*denotes less than 0.5%
55
• Management skills (e.g. leading and managing staff, planning the activities of others): 40% of 10-49 employers; 69% of 500+ employers
• Team working skills (e.g. dealing with colleagues, working together): 35% of 10-49 employers; 53% of 500+ employers
• Customer handling skills (e.g. dealing with customers, persuadi