00 en σι
Ζ O
Q
ui
Energiepreise
D a t e n 1985-1998
Energy prices
Data 1985-1998
Prix de l'énergie
eurostat
STATISTISCHES AMT DER EUROPAISCHEN GEMEINSCHAFTEN STATISTICAL OFFICE OF THE EUROPEAN COMMUNITIES OFFICE STATISTIQUE DES COMMUNAUTÉS EUROPÉENNES
L-2920 Luxembourg — Tél. (352) 43 01-1 —Télex COMEUR LU 3423 Rue de la Loi 200, B-1049 Bruxelles — Tél. (32-2) 299 11 11
Eurostat hat die Aufgabe, den Informa-tionsbedarf der Kommission und aller am Aufbau des Binnenmarktes Beteiligten mit Hilfe des europäischen statistischen Systems zu decken.
Um der Öffentlichkeit die große Menge an verfügbaren Daten zugänglich zu machen und Benutzern die Orientierung zu erleichtern, werden zwei Arten von Publi-kationen angeboten: Statistische Doku-mente und Veröffentlichungen.
Statistische Dokumente sind für den Fachmann konzipiert und enthalten das ausführliche Datenmaterial: Bezugs-daten, bei denen die Konzepte allgemein bekannt, standardisiert und wissenschaft-lich fundiert sind. Diese Daten werden in einer sehr tiefen Gliederung dargeboten. Die Statistischen Dokumente wenden sich an Fachleute, die in der Lage sind, selbständig die benötigten Daten aus der Fülle des dargebotenen Materials auszu-wählen. Diese Daten sind in gedruckter Form und/oder auf Diskette, Magnet-band, CD-ROM verfügbar. Statistische Dokumente unterscheiden sich auch optisch von anderen Veröffentlichungen durch den mit einer stilisierten Graphik versehenen weißen Einband.
Veröffentlichungen wenden sich an eine ganz bestimmte Zielgruppe, wie zum Beispiel an den Bildungsbereich oder an Entscheidungsträger in Politik und Ver-waltung. Sie enthalten ausgewählte und auf die Bedürfnisse einer Zielgruppe abgestellte und kommentierte Informa-tionen. Eurostat übernimmt hier also eine Art Beraterrolle.
Für einen breiteren Benutzerkreis gibt Eurostat Jahrbücher und periodische Veröffentlichungen heraus. Diese enthal-ten statistische Ergebnisse für eine erste Analyse sowie Hinweise auf weiteres Datenmaterial für vertiefende Unter-suchungen. Diese Veröffentlichungen werden In gedruckter Form und in Daten-banken angeboten, die in Menütechnik zugänglich sind.
Um Benutzern die Datensuche zu erleich-tern, hat Eurostat Themenkreise, d. h. eine Untergliederung nach Sachgebieten, eingeführt. Daneben sind sowohl die Statistischen Dokumente als auch die
It is Eurostats responsibility to use the European statistical system to meet the requirements of the Commission and all parties involved in the development of the single market.
To ensure that the vast quantity of ac-cessible data is made widely available, and to help each user make proper use of this information, Eurostat has set up two main categories of document: statistical documents and publications.
The statistical document is aimed at spe-cialists and provides the most complete sets of data: reference data where the methodology is well-established, stand-ardised, uniform and scientific. These data are presented in great detail. The statistical document Is intended for ex-perts who are capable of using their own means to seek out what they require. The information is provided on paper and/or on diskette, magnetic tape, CD-ROM. The white cover sheet bears a stylised motif which distinguishes the statistical docu-ment from other publications.
The publications proper tend to be com-piled for a well-defined and targeted public, such as educational circles or political and administrative decision-makers. The information in these docu-ments is selected, sorted and annotated to suit the target public. In this instance, therefore, Eurostat works in an advisory capacity.
Where the readership is wider and less well-defined, Eurostat provides the infor-mation required for an initial analysis, such as yearbooks and periodicals which contain data permitting more in-depth studies. These publications are available on paper or in videotext databases. To help the user focus his research, Eurostat has created 'themes', i.e. subject classifications. The statistical documents and publications are listed by series: for example, yearbooks, short-term trends or methodology in order to facilitate access to the statistical data.
Y. Franchet Director-General
Pour établir, évaluer ou apprécier les dif-férentes politiques communautaires, la Commission européenne a besoin d'infor-mations.
Eurostat a pour mission, à travers le sys-tème statistique européen, de répondre aux besoins de la Commission et de l'en-semble des personnes impliquées dans le développement du marché unique. Pour mettre à la disposition de tous l'im-portante quantité de données accessibles et faire en sorte que chacun puisse s'orienter correctement dans cet ensem-ble, deux grandes catégories de docu-ments ont été créées: les docudocu-ments statistiques et les publications.
Le document statistique s'adresse aux spécialistes. Il fournit les données les plus complètes: données de référence où la méthodologie est bien connue, standar-disée, normalisée et scientifique. Ces données sont présentées à un niveau très détaillé. Le document statistique est des-tiné aux experts capables de rechercher, par leurs propres moyens, les données requises. Les informations sont alors disponibles sur papier et/ou sur disquette, bande magnétique, CD-ROM. La couver-ture blanche ornée d'un graphisme stylisé démarque le document statistique des autres publications.
Les publications proprement dites peu-vent, elles, être réalisées pour un public bien déterminé, ciblé, par exemple l'enseignement ou les décideurs politi-ques ou administratifs. Des informations sélectionnées, triées et commentées en fonction de ce public lui sont apportées. Eurostat joue, dès lors, le rôle de conseil-ler.
Dans le cas d'un public plus large, moins défini, Eurostat procure des éléments nécessaires à une première analyse, les annuaires et les périodiques, dans les-quels figurent les renseignements adé-quats pour approfondir l'étude. Ces publications sont présentées sur papier ou dans des banques de données de type vidéotex.
-Energiepreise
Daten 1985-1998
Energy prices
Data 1985-1998
Prix de l'énergie
Manuskript abgeschlossen im Dezember 1998
Manuscript completed in December 1998
Manuscrit terminé en décembre 1998
Für alle Informationen zu dieser Veröffentlichung wenden Sie sich bitte an:
For all information concerning this publication, please contact:
Pour toute information concernant cette publication, veuillez vous adresser à:
Eurostat, tél. (352) 43 01-32040
Zahlreiche weitere Informationen zur Europäischen Union sind verfügbar über Internet,
Server Europa (http://europa.eu.int).
A great deal of additional information on the European Union is available on the Internet.
It can be accessed through the Europa server (http://europa.eu.int).
De nombreuses autres informations sur l'Union européenne sont disponibles sur Internet
via le serveur Europa (http://europa.eu.int).
Bibliographische Daten befinden sich am Ende der Veröffentlichung.
Cataloguing data can be found at the end of this publication.
Une fiche bibliographique figure à la fin de l'ouvrage.
Luxembourg: Office des publications officielles des Communautés européennes, 1999
ISBN 92-828-5673-9
Inhalts / Contents / Sommaire
1. Einleitung 5
Introduction 11
Introduction 17
2. Quellenangaben und Anmerkungen zur Methodik 7
Notes on sources and methods 13
Note concernant les sources et la méthodologie 19
3. Naturgas / Natural gas / Gas naturel 23
4. Elektrizitaet / Electricity / Electricité 57
5. Mineralölerzeugnisse / Petroleum products / Produits pétroliers 107
6. Vergleich der Energiepreise (mit Grafiken) / 149
Comparison between energy prices (with graphics) /
Comparaison entre les prix de l'énergie (avec graphiques)
Ξ 2
euostat1.
Einleitung
EUROSTAT sammelt und veröffentlicht zahlreiche Angaben über die Energiepreise in den
Mitgliedstaaten. Mit der vorliegenden Veröffentlichung soll in möglichst knapper Form über die Preise der
letzten Jahre für die grossen Energieträger informiert werden. Es wurde daher bewusst nur die
Entwicklungen bis zu dem Zeitpunkt, zu dem Informationen für alle Energieträger verfügbar waren
betrachtet. Einzelne Preisangaben für spezifische Energieträger können aus der Fachpresse und
insbesondere aus:
- dem wöchentlichen "Oel-Preis-Bulletin"
- den halbjährlichen "Statistik Kurzgefasst" über Gas und Elektrizität
- den jährlichen Veröffentlichungen "Gaspreise" und "Elektrizitätspreise"
der Kommission entnommen werden.
Zeichen und Abkürzungen
Kein Nachweis vorhanden
jährlicher durchschnittlicher prozentualer Anstieg
kWh
GWh
h
GJ
Ho
Hu
HS
tRÖE
MWSt
BEF
DKK
DEM
GRD
ESP
FRF
IEP
ITL
LUF
NLG
ATS
PTE
FIM
SEK
GBP
ECU
KKS
BIP
EU 15
EUROSTAT
Kilowattstunden
Gigawattstunden (10
6kWh)
Stunde
Gigajoule (10
3MJ)
oberer Heizwert
unterer Heizwert
hoher Schwefelgehalt
Tonne Rohöleinheiten
Mehrwertsteuer
Belgischer Franc
Dänische Krone
Deutsche Mark
Griechische Drachme
Spanische Peseta
Französischer Franc
Irisches Pfund
Italienische Lira
Luxemburgischer Franc
Niederländischer Gulden
Österreichischer Schilling
Portugiesischer Escudo
Finnische Markka
Schwedische Krone
Pfund Sterling
Europäische Währungseinheit
Kaufkraftstandard
Bruttoinlandsprodukt
m.
eurostat2. Quellenangaben und Anmerkungen
2.1 Mengeneinheiten
Für die Endverbraucher sind die Preise in nationalen Währungseinheiten pro spezifische Einheit
(Gigajoule, Kilowattstunde, Liter, Tonne) ausgedrückt. Drei Arten von Preisen werden angegeben.
Preise einschließlich Steuern
Preise ausschließlich Mehrwertsteuer und ausschliesslich absetzbare Steuern (für die Industrie)
Preise ausschließlich alle Steuern.
Der Preis einschließlich Steuern ist der vom privaten Verbraucher tatsächlich gezahlte Preis. Er umfasst
den Preis ausschließlich Steuern plus die Summe aller vom Verbraucher zu tragenden Steuern.
Im Falle des Industriellen Energieverbrauchers ist der Preis der für die Vergleiche, benutzt wurde der
Preis ohne und sonstige abzugsfähige Steuern.
2.2 Währungseinheit
2.2.1 Die europäische Währungseinheit (ECU)
Die europäische Währungseinheit ist ein Währungskorb.
Die Zusammensetzung des Währungskorbs der ECU stellt sich wie folgt dar :
3.301 BEF 0.1976 DKK 0.6242 DEM 1.44 GRD 1.393 PTE 1.332 FRF
0.2198 NLG 0.008552 IEP 0.13 LUF 151.8 ITL 6.885 ESP 0.08784 GBP
Nach ihrer Definition spiegelt der ECU durchaus die Wechselkursschwankungen wider und ist daher zur
Messung der Preise und Werte der internationalen Waren- und Dienstleistungsströme geeignet. Die in
ECU ausgedrückten Daten ermöglichen infolgedessen einen Vergleich zwischen den Preisen nach
Umtausch von Devisen bei der Bank. Dieser Währungsumtausch zu den auf dem Devisenmarkt notierten
Wechselkursen hat jedoch den Nachteil, dass mit der Zeit unter der Einwirkung zahlreicher Faktoren, die
von den Bewegungen der Inlandspreise unabhängig sind, Fluktuationen auftreten:
Kapitaltransfers,
politische Entscheidungen,
Reglementierungen,
Spekulationen,
psychologische Faktoren,
Zinssätze.
So kann eine Landeswährung im Vergleich zu ihrer wirklichen Kaufkraft unter- oder überbewertet werden.
eurostat Enerqiepreise 1985 - 1 9 9 8
2.2.2 Kaufkraftstandard (KKS)
Der KKS ist eine Bezugseinheit, deren Relation zu den verschiedenen Landeswährungen sich
proportional zu den Kaufkraftparitäten (KKP) dieser Währungen verhält.
Die Kaufkraftparitäten werden als Mittelwerte der Preisrelationen zwischen den einzelnen Ländern für
einen Waren- und Dienstleistungskorb ermittelt, der einer vollständigen genau definierten Klassifikation
entspricht. Sie ermöglichen es, die in Landeswährung ausgedrückten Werte der Wirtschaftsaggregate der
Länder in eine gemeinsame Währung zu konvertieren.
Die KKP, die für alle Verwendungen des BIP berechnet werden, spiegeln die Relationen zwischen den
Preisniveaus der verschiedenen Länder wider; sie geben an, welche Summe in Landeswährung
erforderlich ist, um in den einzelnen Ländern jeweils denselben Korb von Waren und Dienstleistungen
aus den Verwendungen des BIP zu kaufen. In der vorliegenden Veröffentlichung werden nur die KKP an
der Aggregationsstufe des BIP verwendet.
Die Kaufkraftparitäten werden im Verhältnis zu einer Bezugsgröße ausgedrückt, die man
Kaufkraftstandard (KKS) nennt. Diese Bezugsgröße wird so definiert, daß für jedes einzelne Aggregat der
durch Umrechnung der Werte in Landeswährung mit Hilfe der Kaufkraftparitäten
erzielte
gemeinschaftliche Gesamtwert gleich dem gemeinschaftlichen Gesamtwert in ECU ist.
Wenn die Preise mit Hilfe der BIP-Parität in KKS umgerechnet werden, lässt sich eine Aussage wie die
folgende treffen:
Wenn 1 Gigajoule Energie im Lande A 10 KKS und im Lande Β 5 KKS kostet, so bedeutet dies,
daß dieses Gigajoule Energie nach Bereinigung der Unterschiede zwischen den allgemeinen
Preisniveaus der beiden Länder in dem Land A doppelt so teuer ist wie in dem Land B.
Diese Bewertung ist unabhängig von den Wechselkursen und damit von den Wechselkursschwankungen,
die durch Kapitalbewegungen, Spekulation und Regierungsentscheidungen usw. entstehen.
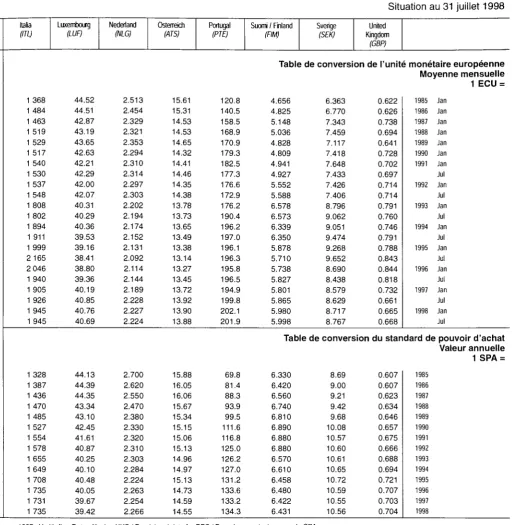
Die Umrechnungsfaktoren für die Berichtsjahre der vorliegenden Studie sind in einer Tabelle im Anhang
enthalten.
2.3 Energieträger
2.3.1 Gas
Die
Preise
stammen
aus
einer
regelmässigen
Erhebung
des
EUROSTAT
bei
Gasversorgungsunternehmen in den Ländern der Europaischen Union. Die dabei angewandte Methodik
ist in der EUROSTAT-Veröffentlichung "Gaspreise" beschrieben.
Für die Veröffentlichung von EUROSTAT "Energiepreise" wurden ein Ort pro Land und folgende
Verbrauchergruppen berücksichtigt :
Haushaltsverbraucher :
Enerqiepreise 1985-1998
m
eurostatIndustrielleverbraucher
eurostat
I3-1
I4-1
Jahresverbrauch
41860 GJ (das sind 11,63GWh)
418 600 GJ (das sind 116,30 GWh)
Benutzungsdauer
200 Tage 1 600 Stunden
250 Tage 4 000 Stunden
2.3.2 Elektrizität
Die Preise stammen aus einer regelmässigen Erhebung des EUROSTAT bei
Elektrizitätsversorgungsunternehmen in den Ländern der Europaischen Union. Die dabei angewandte
Methodik ist in der EUROSTAT-Veröffentlichung "Elektrizitätspreise" beschrieben.
Für die Veröffentlichung von EUROSTAT "Energiepreise" wurden ein Ort pro Land und folgende
Verbrauchergruppen berücksichtigt :
Haushaltverbraucher :
eurostat
Db
Dc
De
Jahresverbrauch
kWh
Insgesamt
1 200
3 500
20 000
(darunter
Nachtstrom)
(1 300)
(15 000)
Bestellte
Leistung
(Richtwert) in
kW
3-4
4-9
9
Wohnungstyp
70 m
23 Zimmer + Küche
90 m
24 Zimmer + Küche
120 m
25 Zimmer + Küche
Industrieverbraucher
I4M
eurostat
ld
If
ig
Jahresverbrauch
kWh
1 250 000
10 000 000
24 000 000
Maximaler
Leistungsbedarf kW
(Höchstlast)
500
2 500
4 000
Jahresnutzungsdauer
(1)2 500 St.
4 000 St.
6 000 St.
euroetat Enerqiepreise 1985 - 1998
2.3.3Mineralölerzeugnisse
Die Preise werden der Kommission von den Mitgliedstaaten als die an häufigsten angewandte, für eine
bestimmte, unten genau spezifizierte Verbrauchergruppe, gemeldet. Ausgewiesen sind die am 15. Januar
und 15. Juli gültigen Preise für :
Super Benzin, bleifrei Super-Benzin und Dieselöl : Tankstellenpreise
Leichtes Heizöl : Preise für Lieferungen von 2 000 bis 5 000 Liter
Schweres Heizöl : Preise für Lieferungen von weniger als 2 000 Tonnen pro Monat bzw. weniger
als 24 000 Tonnen pro Jahr.
Endverbraucherpreisreihen : die Preise sind für Januar und Juli ausgewiesen.
Preisvergleich auf Endenergieebene : diese Tabellen enthalten die Preise der in Ihrem jeweiligen
Verbrauchersektor als konkurrierend angesehenen Energieträger, ausgedrückt in ECU pro GJ (Hu).
2.4 Umrechnungsfaktor
Petroleum
Schweres Heizöl
Leichtes Heizöl
Leichtes Heizöl
Gas
Elektrizität
1 t ROE
1 000 kg
1 000 kg
1 000 I
1 GJ (Ho)
1000kWh
=
=
=
=
=
=
41,86
40,00
42,30
36,38
0,90
3,60
eurostat
1. Introduction
EUROSTAT collects and publishes a wide range of information on energy prices in the Member States.
The aim of this publication is to summarize as succintly as possible the most recent price information for
the principal energy sources. It is therefore deliberately confined to trends up to the date at which
information for all these energy sources was available. More detailed prices for particular sources can be
found in the specialised press and notably in:
- the weekly "Oil Price Bulletin"
- the halfyearly "Statistics in focus" for "Gas" and "Electricity"
- the yearly publications "Gas prices" and "Electricity prices"
published by the Commission.
Symbols and abbreviations
No data available
Annual average percentage increase
kWh
GWh
h
GJ
GCV
NCV
HSC
toe
VAT
BEF
DKK
DEM
GRD
ESP
FRF
IEP
ITL
LUF
NLG
ATS
PTE
FIM
SEK
GBP
ECU
PPS
GDP
EU 15
EUROSTAT
Kilowatthour
Gigawatthour (10
6kWh)
Hour
Gigajoule (10
3MJ)
Gross calorific value
Net calorific value
High sulphur content
Ton of oil equivalent
Value added tax
Belgian franc
Danish crown
German mark
Greek Drachma
Spanish Peseta
French franc
Irish pound
Italian lira
Luxembourg franc
Dutch guilder
Austrian Schilling
Portuguese Escudo
Finnish Markka
Swedish crown
Pound sterling
European currency unit
Purchasing power standard
Gross domestic product
eurostat
2. Sources and methods
2.1 Quantity units employed
For end-users, the prices are indicated in currency units per specific unit (gigajoule, kilowatt hour, tonne,
litre). Three types of prices were used :
prices including all taxes
prices excluding VAT and excluding specific deductible taxes (for industrial consumers)
prices excluding all taxes.
The prices including all taxes are the prices actually paid by the household consumer. They therefore
comprise the price excluding tax plus all taxes borne by the consumer.
In the case of industrial consumers, the price used for comparison excludes both VAT and other specific
deductible taxes.
2.2 Currency units
2.2.1 The european currency unit (ECU)
The ECU is a basket-type currency unit.
The composition of the ECU basket is as follows:
3.301 BEF 0.1976 DKK 0.6242 DEM 1.44 GRD 1.393 PTE 1.332 FRF
0.2198 NLG 0.008552 IEP 0.13 LUF 151.8 ITL 6.885 ESP 0.08784 GBP
The definition of the ECU is such that it reflects fluctuations in exchange rates and is suitable for
measuring the prices and values of international flows of goods and services. Data expressed in ECU
therefore permit the comparison of prices in terms of currency exchange. This financial operation at the
market exchange rates, however, has the drawback of being liable to changes in time under the influence
of many factors which are independent of internal price movements:
capital transfers,
political decisions,
regulations,
speculation,
psychological factors,
interest rates.
Thus, a national currency can be over- or undervalued in comparison with its real purchasing power.
eurostat Energy prices 1985 - 1 9 9 8
2.2.2 The purchasing power standard (PPS)
The PPS is a reference unit for which the ratios between the different national currencies are proportional
to the purchasing power parities (PPP) between these currencies.
Purchasing power parities are obtained as the averages of the price ratios between the different countries
for a basket of goods and services representing the whole of a well-defined classification. They can be
used to convert the values of the countries' economic aggregates expressed in national currency into a
common currency.
The PPP, which are calculated for all the uses of the GDP, reflect the ratios between price levels in the
different countries; they indicate the amount of a national currency required to buy in each country the
same basket of goods and services which are included in the uses of the GDP. In this present publication
only the PPP at GDP level are used.
The purchasing power parities are expressed in relation to a reference unit, a
numeraire,
which is called
purchasing power standard (PPS). This
numeraire
is defined in such a way that, for each individual
aggregate (in this publication, the aggregate used is the GDP), the Community total obtained from
converting the values in national currency by means of the purchasing power parities is equal to the
Community total in ECU.
When prices are converted to PPS using the GDP parity the following conclusion is possible:
if one gigajoule of energy costs 10 PPS in country A and 5 PPS in country B, this means that after
eliminating the differences between the general level of prices in the two countries, this gigajoule of
energy is twice as expensive in country A than in country B.
This conclusion is independent of market exchange rates and therefore, is not influenced by fluctuations
in the same, brought about by movements of capital, speculation , political decisions, etc.
The conversion rates for the years covered by this study are given in a table in the annex.
2.3 Sources
2.3.1 Gas
These prices are taken from regular EUROSTAT surveys of the gas utilities in the European Union
countries. The methodology is described in the EUROSTAT publication "Gas Prices".
For the EUROSTAT "Energy prices" publication, we used one location for each country and the following
standard consumers categories:
domestic consumers:
eurostat
D
2Annual consumption
16.74 GJ (i.e. 4652 kWh)
125.60 GJ (i.e. 34890 kWh)
Equipment
cooking and water heating
Enerav prices 1985-1998
eurostat-Tr
industrial consumers:
eurostat
I3-1
I4-1
Annual consumption
41 860 GJ(i.e. 11.63GWh)
418 600 GJ(i.e. 116.30 GWh)
Load factor
200 days 1 600 hours
250 days 4 000 hours
2.3.2 Electricity
These prices are taken from regular EUROSTAT surveys of the electricity utilities in the European Union
countries. The methodology is described in the EUROSTAT publication "Electricity Prices".
For the EUROSTAT "Energy prices" publication, we used one location for each country and the following
standard consumers categories:
domestic consumers:
eurostat
Db
Dc
De
Annual consumption
kWh
Total
1 200
3 500
20 000
of which night
(1 300)
(15 000)
Approx.
subscribed
demand
in kW
3-4
4-9
9
Standard dwelling
70 m
23 rooms + kitchen
90 m
24 rooms + kitchen
120 m
25 rooms + kitchen
industrial consumers:
eurostat
ld
If
ig
Annual consumption
kWh
1 250 000
10 000 000
24 000 000
Maximum demand
in kW
500
2 500
4 000
Annual load
(1)2 500 h
4 000 h
6 000 h
eurostat Energy prices 1985 - 1998
2.3.3 Petroleum products
The prices are supplied to the Commission (DG XVII) by the Member States as being the most frequently
encountered for the specific categories of sale listed below. The prices given are those recorded at 15
January and 15 July for :
Gasoline, premium unleaded gasoline and automotive diesel oil: pump prices
Heating gas oil: prices for deliveries of between 2 000 and 5 000 litres
Residual fuel oil: prices for monthly deliveries of less than 2 000 tonnes or annual deliveries of less
than 24 000 tonnes
Series of end consumer prices: prices are given for January and July.
Comparison of supplied energy prices (and graphics): these tables show the prices of energy sources
which can be regarded as competing in their sector of utilization. Prices are expressed in ECU per GJ
(NCV).
2.4 Conversion factors
Crude Oil
Residual fuel
Gasoil
Gasoil
Gas
Electricity
1 toe
1 000 kg
1 000 kg
1 000 I
1 GJ (GCV)
1000kWh
41.86
40.00
42.30
36.38
0.90
3.60
sa
eurostat
1. Introduction
EUROSTAT recueille et publie de nombreuses informations sur les prix de l'énergie dans les Etats
Membres. Le but de cette publication est de rassembler de la manière la plus synthétique possible les
informations les plus récentes sur les prix couvrant les principales sources d'énergie. Elle se limite par
conséquent à l'évolution observée jusqu'au moment où les informations pour toutes ces sources ont été
disponibles. Pour certaines sources d'énergie, le lecteur intéressé trouvera des données de prix plus
détaillées dans les publications spécialisées de la Commission, et en particulier, dans :
- le "bulletin Pétrolier", hebdomadaire
- les "Statistiques en bref' semestrielles sur le gaz et l'électricité
- les publications annuelles "Prix du Gaz" et "Prix de l'Electricité".
Signes et abréviations
Donnée non disponible
0 Pourcentage annuel moyen d'évolution
kWh
Kilowattheure
GWh
Gigawattheure(10
6kWh)
h
Heure
GJ Gigajoule (10
3MJ)
PCS
Pouvoir calorifique supérieur
PCI
Pouvoir calorifique inférieur
HTS
Haute teneur en soufre
tep
Tonne d'équivalent pétrole
TVA
Taxe à la valeur ajoutée
BEF
Franc belge
DKK
Couronne danoise
DEM
Mark allemand
GRD
Drachme grecque
ESP
Peseta espagnole
FRF
Franc français
IEP
Livre irlandaise
ITL
Lire italienne
LUF
Franc luxembourgeois
NLG
Florin néerlandais
ATS
Schilling autrichien
PTE
Escudo portugais
FIM
Mark finlandais
SEK
Couronne suédoise
GBP
Livre sterling
ECU
Unité monétaire européenne
SPA
Standard de pouvoir d'achat
PIB
Produit intérieur brut
EU
15 Ensemble des Etats Membres de l'union Européenne
eurostat
2. Sources et méthodologie
2.1 Unités de mesure quantitative
Les tableaux de la consommation finale présentent les prix en unités monétaires nationales par unité
spécifique (gigajoule, kilowatt-heure, tonne, litre). Trois niveaux de prix ont été retenus :
prix toutes taxes comprises
prix hors TVA et hors taxes spécifiques déductibles (pour les consommateurs industriels)
prix hors taxes.
Le prix toutes taxes comprises est le prix réellement payé par le consommateur domestique. Il
correspond donc au prix hors taxes plus l'ensemble des taxes qui restent à la charge du consommateur.
Dans le cas des consommateurs industriels, le prix utilisé pour les comparaisons est le prix hors TVA et
hors taxes spécifiques déductibles.
2.2 Unités monétaires
2.2.1 Unité monétaire européenne (ECU)
L'ECU est une unité monétaire de type "panier".
La composition du panier de l'ECU se présente comme suit :
3,301 BEF 0,1976 DKK 0,6242 DEM 1,44 GRD 1,393 PTE 1,332 FRF
0,2198 NLG 0,008552 IEP 0,13 LUF 151,8 ITL 6,885 ESP 0,08784 GBP
De par sa définition, l'ECU reflète bien les fluctuations des taux de change et s'avère adapté à mesurer
les prix et les valeurs des flux internationaux des biens et services. Des données exprimées en ECU se
placent donc dans l'optique d'une comparaison des prix, après conversion des devises. Cependant, cette
opération monétaire aux taux de change du marché présente l'inconvénient de fluctuer dans le temps
sous l'effet de nombreux facteurs indépendants des mouvements de prix intérieurs :
transferts de capitaux,
décisions politiques,
réglementations,
spéculations,
facteurs psychologiques,
taux d'intérêts.
Ainsi, une monnaie nationale peut-elle être sur ou sous-évaluée par rapport à son véritable pouvoir
d'achat.
Ξί
eurostat Prix de l'énergie 1985-1998
2.2.2 Le standard de pouvoir d'achat (SPA)
Le SPA est une unité de référence dont les relations avec les différentes monnaies nationales sont
proportionnelles aux parités de pouvoir d'achat (PPA) entre ces monnaies.
Les parités de pouvoir d'achat sont obtenues comme moyennes de rapports de prix entre les différents
pays pour un panier de biens et services représentant l'ensemble d'une classification bien définie. Elles
permettent de convertir les valeurs des agrégats économiques des pays exprimées en monnaie nationale
dans une monnaie commune.
Les PPA, qui sont calculées pour tous les emplois du PIB, reflètent les relations entre les niveaux des
prix des différents pays; elles indiquent les quantités de monnaie nationale nécessaires pour acheter dans
chaque pays le même panier de biens et services compris dans les emplois du PIB. Dans la présente
publication, seules les PPA au niveau du PIB sont utilisées.
Les parités de pouvoir d'achat sont exprimées par rapport à une unité de référence, un numéraire, qu'on
appelle standard de pouvoir d'achat (SPA). Ce numéraire est défini de manière à ce que, pour chaque
agrégat individuel (dans cette publication, l'agrégat utilisé est le PIB) le total communautaire obtenu de la
conversion des valeurs en monnaie nationale avec les parités de pouvoir d'achat soit égal au total
communautaire en ECU.
Lorsque les prix sont convertis en SPA à l'aide de la parité du PIB, le jugement suivant devient possible :
si un gigajoule d'énergie coûte 10 SPA dans le pays A et 5 SPA dans le pays B, cela signifie que,
après qu'on ait éliminé les différences entre les niveaux généraux de prix des deux pays, ce
gigajoule d'énergie est deux fois plus cher dans le pays A que dans le pays B.
Ce jugement est indépendant des taux de change monétaires et donc des fluctuations de ceux-ci
provoquées par les mouvements de capitaux, la spéculation, les décisions publiques, etc.
Les facteurs de conversion des années couvertes par cette étude sont données dans un tableau en
annexe.
2.3 Sources
2.3.1 Gaz
Les prix proviennent de l'enquête régulière menée par EUROSTAT parmi les sociétés de distribution de
gaz dans les différents pays de l'Union Européenne. La méthodologie est décrite dans la publication
EUROSTAT "Prix du Gaz".
Pour la publication EUROSTAT "Prix de l'énergie", on a retenu une place par pays et les consommateurs
type suivants :
consommateurs domestiques :
eurostat
Consommation annuelle
16,74 GJ (soit 4652 kWh)
Equipement
Prix de l'énergie 1985-1998
eurostat
consommateurs industriels
eurostat
I3-1
I4-1
Consommation annuelle
41 860 GJ(soit 11,63GWh)
418 600 GJ (soit 116,30 GWh)
Modulation
200 jours 1 600 heures
250 jours 4 000 heures
2.3.2 Electricité
Les prix proviennent de l'enquête régulière menée par EUROSTAT parmi les sociétés de distribution
d'électricité dans les différents pays de l'Union Européenne. La méthodologie est décrite dans la
publication EUROSTAT "Prix de l'électricité".
Pour la publication EUROSTAT "Prix de l'énergie", on a retenu une place par pays et les consommateurs
type suivants :
consommateurs domestiques :
eurostat
D
bDc
De
Consommation annuelle
en kWh
Total
1 200
3 500
20 000
dont nuit
(1 300)
(15 000)
Puissance
souscrite
indicative en
kW
3-4
4-9
9
Logement type
70 m
23 pièces + cuisine
90 m
24 pièces + cuisine
120 m
25 pièces + cuisine
consommateurs industriels :
eurostat
ld
If
ig
Consommation annuelle
kWh
1 250 000
10 000 000
24 000 000
Puissance maximale
appelée en kW
500
2 500
4 000
Modulation
(D
2 500 h
4 000 h
6 000 h
eurostat Prix de l'énergie 1985-1998
2.3.3 Produits pétroliers
Les prix sont communiqués par les Etats Membres à la Commission (DGXVII) comme étant les plus
fréquemment pratiqués, pour une catégorie bien spécifique de livraison définie ci-dessous. Les prix
indiqués sont les prix relevés au 15 janvier et au 15 juillet pour les consommations suivantes :
Essence super, essence super sans plomb et gasoil routier : prix à la pompe
Gasoil chauffage : prix pour livraisons de 2 000 à 5 000 litres
Fuel oil résiduel : prix pour livraisons inférieures à 2 000 tonnes par mois ou 24 000 tonnes par an.
Séries de prix à la consommation finale : les tableaux présentent les prix pour les mois de janvier et
juillet.
Comparaison entre prix de l'énergie finale : dans ces tableaux ont été réunis les prix des énergies qui
peuvent être considérées comme concurrentes dans leur secteur d'utilisation. Les prix sont exprimés en
ECU par Gigajoule (PCI).
2.4 Facteurs de conversion
Pétrole brut
Fuel oil résiduel
Gasoil chauffage
Gasoil chauffage
Gaz
Electricité
1 tep
1 000 kg
1 000 kg
1 000 I
1 GJ (PCS)
1000 kWh
η
=
=
=
=
=
41,86
40,00
42,30
36,38
0,90
3,60
Naturgas
Natural gas
Naturgaspreise
Natural gas prices
Prix du gaz naturel
Hausaltsverbraucher
16,74 GJ/Jahr -Preise pro GJ (HO)
Æh
Household consumer
16,74 G J/Year -Prices per G J (GCV) 16,74 GJ/an -Prix par GJ (PCS) Consommateur domestique Nationale Währung National currency Monnaie nationale Steuern Inbegr. Taxes ¡nel. Taxes comprises Ohne Mehrwert VAT excl. Hors TVA Ohne Steuern Taxes excl. Hors taxes Steuern Inbegr. Taxes incl. Taxes comprises KKS PPS SPA Ohne Mehrwert. VAT excl. Hors TVA Ohne Steuern Taxes excl. Hors taxes Steuern Inbegr. Taxes incl. Taxes comprises ECUS Ohne Mehrwert. VAT excl. Hors TVA Ohne Steuern Taxes excl. Hors taxes BELGIQUE/BELGIE 1985 Jan 1986 Jan 1987 Jan 1988 Jan 1989 Jan 1990 Jan 1991 Jan Jul 1992 Jan Jul 1993 Jan Jul 1994 Jan Jul 1995 Jan Jul 1996 Jan Jul 1997 Jan Jul 1998 Jan Jul %ø 85-01/98-01 %ø 90-01/98-01 % 97-01/98-01 663.90 648.60 519.50 517.10 506.70 544.51 569.00 569.10 562.00 565.00 564.10 562.60 589.90 586.50 590.30 591.90 590.20 594.20 605.00 616.90 620.00 606.40 -0.52 1.64 2.48 BEF 567.50 554.40 444.00 442.20 433.10 465.39 486.30 486.40 480.30 472.80 472.00 470.80 489.60 486.70 489.90 491.20 487.80 491.00 500.00 509.90 512.40 501.20 567.50 554.40 444.00 442.20 433.10 465.39 486.30 486.40 480.30 472.80 472.00 470.80 475.90 473.00 476.20 477.50 474.10 477.40 486.30 496.20 498.70 487.50 15.04 14.61 11.71 11.93 11.76 12.81 13.67 13.68 13.75 13.83 14.01 13.98 14.71 14.63 14.66 14.70 14.78 14.88 15.35 15.66 15.73 15.38 0.34 2.60 2.44 12.86 12.49 10.01 10.20 10.05 10.95 11.69 11.69 11.75 11.57 11.72 11.69 12.21 12.14 12.16 12.20 12.22 12.30 12.69 12.94 13.00 12.72 12.86 12.49 10.01 10.20 10.05 10.95 11.69 11.69 11.75 11.57 11.72 11.69 11.87 11.80 11.82 11.86 11.88 11.96 12.34 12.59 12.65 12.37 14.91 14.57 12.12 11.97 11.61 12.77 13.48 13.46 13.38 13.43 14.00 13.96 14.62 14.84 15.07 15.41 15.21 15.10 15.05 15.10 15.21 14.91 0.15 2.20 1.04 Bruxelles 12.75 12.46 10.36 10.24 9.92 10.92 11.52 11.50 11.44 11.24 11.71 11.69 12.13 12.31 12.51 12.79 12.57 12.48 12.44 12.48 12.57 12.32 12.75 12.46 10.36 10.24 9.92 10.92 11.52 11.50 11.44 11.24 11.71 11.69 11.79 11.97 12.16 12.43 12.22 12.13 12.10 12.15 12.23 11.98 DANMARK 1985 Jan 1986 Jan 1987 Jan 1988 Jan 1989 Jan 1990 Jan 1991 Jan Jul 1992 Jan Jul 1993 Jan Jul 1994 Jan Jul 1995 Jan Jul 1996 Jan Jul 1997 Jan Jul 1998 Jan Jul %ø 85-01/98-01 %0 90-01/98-01 % 97-01/98-01
(1)
162.01 163.10 140.21 154.13 171.85 200.00 247.35 227.31 250.91 247.60 234.94 240.06 207.29 200.91 201.83 198.18 221.61 241.15 241.06 233.95 252.66 259.28 3.48 2.96 4.81 DKK 132.80 133.69 114.93 126.34 140.86 163.92 202.75 186.32 200.73 198.08 187.95 192.05 165.83 160.73 161.46 158.54 177.29 192.92 192.85 187.16 202.13 207.42 132.80 133.69 114.93 126.34 140.86 163.92 202.75 186.32 200.73 198.08 187.95 192.05 165.83 160.73 161.46 158.54 171.52 187.15 187.09 181.39 196.36 195.63 15.93 15.84 13.32 14.75 16.59 19.76 25.37 23.31 25.37 25.03 24.78 25.32 22.13 21.45 21.50 21.11 23.85 25.95 26.05 25.29 27.13 27.84 4.18 4.04 4.12 13.06 12.98 10.91 12.09 13.60 16.19 20.79 19.11 20.30 20.03 19.83 20.26 17.71 17.16 17.20 16.89 19.08 20.76 20.84 20.23 21.70 22.27 13.06 12.98 10.91 12.09 13.60 16.19 20.79 19.11 20.30 20.03 19.83 20.26 17.71 17.16 17.20 16.89 18.46 20.14 20.22 19.60 21.08 21.00 20.38 20.43 17.91 19.43 21.30 25.37 31.36 28.62 31.70 31.49 31.09 31.77 27.49 26.66 26.94 27.24 30.35 32.73 32.42 31.04 33.57 34.48 3.91 3.57 3.56 Kobenhavn 16.71 16.75 14.68 15.93 17.46 20.79 25.70 23.46 25.36 25.20 24.88 25.41 21.99 21.33 21.55 21.79 24.28 26.19 25.94 24.83 26.86 27.59 16.71 16.75 14.68 15.93 17.46 20.79 25.70 23.46 25.36 25.20 24.88 25.41 21.99 21.33 21.55 21.79 23.49 25.40 25.16 24.07 26.09 26.02
Naturgaspreise
Natural gas prices
Prix du gaz naturel
Hausaltsverbraucher
16,74 GJ/Jahr -Preise pro GJ (HO) 16,74 GJ/Year -Prices per GJ (GCV) Household consumer
ΉΔ
Consommateur domestique 16,74 GJ/an -Prix par GJ (PCS) Nationale Währung
National currency Monnaie nationale Steuern
Inbegr. Taxes incl.
Taxes comprises
Ohne Mehrwert
VAT excl. Hors TVA
Ohne Steuern Taxes excl.
Hors taxes
KKS PPS SPA Steuern
Inbegr. Taxes incl.
Taxes comprises
Ohne Mehrwert
VAT excl. Hors
TVA
Ohne Steuern Taxes excl.
Hors taxes
ECUS
Steuern Inbegr. Taxes incl.
Taxes comprises
Ohne Mehrwert.
VAT excl. Hors TVA
Ohne Steuern Taxes excl. Hors taxes
DEUTSCHLAND
1985 Jan 1986 Jan 1987 Jan 1988 Jan 1989 Jan 1990 Jan 1991 Jan Jul 1992 Jan Jul 1993 Jan Jul 1994 Jan Jul 1995 Jan Jul 1996 Jan Jul 1997 Jan Jul 1998 Jan Jul %ø 85-01/98-01 %ø 90-01/98-01 % 97-01/98-01
33.85 33.85 23.97 23.97 24.03 25.77 26.29 28.53 28.53 28.54
28.14 27.49 27.49 26.83 26.83 26.83 26.83 26.83 26.83 26.80 27.03 -1.78 0.49 -0.11
DEM 29.69 29.69 21.03 21.03 21.08 22.60 23.06 25.03 25.03 25.04
24.47 23.90 23.90 23.33 23.33 23.33 23.33 23.33 23.33 23.31 23.31
29.69 29.69 21.03 21.03 20.36 21.88 22.33 24.03 24.03 24.04
23.47 22.90 22.90 22.33 22.33 22.33 22.33 22.33 22.33 22.31 22.31
14.05 14.05 9.99 10.24 10.54 11.45 11.82 12.83 12.77 12.78
12.40 12.35 12.35 11.97 11.97 12.17 12.17 12.27 12.27 12.28 12.38 -1.03 0.87 0.07
12.32 12.32 8.76 8.99 9.25 10.04 10.37 11.25 11.20 11.21
10.78 10.74 10.74 10.41 10.41 10.58 10.58 10.67 10.67 10.68 10.68
12.32 12.32 8.76 8.99 8.93 9.72 10.04 10.80 10.76 10.76
10.34 10.29 10.29 9.96 9.96 10.13 10.13 10.21 10.21 10.22 10.22
15.22 15.54 11.61 11.61 11.53 12.67 12.83 13.89 13.99 13.97
14.42 14.16 14.33 14.11 14.36 14.21 14.04 13.76 13.56 13.56 13.70 -0.88 0.86 -1.44
Düsseldorf
13.35 13.35 13.63 13.63 10.19 10.19 10.18 10.18 10.11 9.77 11.11 10.76 11.26 10.90 12.18 11.70 12.27 11.78 12.26 11.77
12.54 12.03 12.31 11.79 12.46 11.94 12.27 11.74 12.49 11.96 12.36 11.83 12.21 11.69 11.97 11.45 11.79 11.28 11.80 11.29 11.81 11.31
E L L A D A O ) 1985 Jan 1986 Jan 1987 Jan 1988 Jan 1989 Jan 1990 Jan 1991 Jan
Jul 1992 Jan Jul 1993 Jan Jul 1994 Jan Jul 1995 Jan Jul 1996 Jan Jul 1997 Jan Jul 1998 Jan Jul
GRD
National
%ø 85-01/98-01 %0 90-01/98-01 % 97-01/98-01
Naturgaspreise
Natural gas prices
Prix du gaz naturel
Hausaltsverbraucher16,74 GJ/Jahr-Preise pro GJ (HO)
Ξ0
Household consumer 16,74 GJ/Year -Prices per GJ (GCV)
Consommateur domestique 16,74 GJ/an -Prix par GJ (PCS) Nationale Währung National currency Monnaie nationale Steuern Inbegr. Taxes incl. Taxes comprises Ohne Mehrwert VAT excl. Hors TVA Ohne Steuern Taxes excl. Hors taxes Steuern Inbegr. Taxes incl. Taxes comprises KKS PPS SPA Ohne Mehrwert. VAT excl. Hors TVA Ohne Steuern Taxes excl. Hors taxes Steuern Inbegr. Taxes incl. Taxes comprises ECUS Ohne Mehrwert VAT excl. Hors TVA Ohne Steuern Taxes excl. Hors taxes
ESPAN A(1) 1985 Jan 1986 Jan 1987 Jan 1988 Jan 1989 Jan 1990 Jan 1991 Jan Jul 1992 Jan Jul 1993 Jan Jul 1994 Jan Jul 1995 Jan Jul 1996 Jan Jul 1997 Jan Jul 1998 Jan Jul %ø 85-01/98-01 %ø 90-01/98-01 % 97-01/98-01 1 558.00 1 991.00 1 643.00 1 643.00 1 653.00 1 694.00 1 777.00 1 777.00 1 945.30 1 945.30 1 979.70 1 979.70 1 979.70 2 082.70 2 100.18 2 100.10 2 180.50 2 180.50 2 213.80 2 249.20 2 249.20 2 249.20 2.86 3.61 1.60 ESP 1 558.00 1 778.00 1 467.00 1 467.00 1 476.00 1 512.00 1 586.00 1 586.00 1 721.50 1 721.50 1 721.50 1 721.50 1 721.50 1 810.50 1 810.50 1 810.50 1 879.70 1 879.70 1 908.50 1 938.90 1 938.90 1 938.90 1 535.00 1 752.00 1 445.00 1 445.00 1 406.00 1 490.00 1 563.00 1 563.00 1 721.50 1 721.50 1 721.50 1 721.50 1 721.50 1 810.50 1 810.50 1 810.50 1 879.70 1 879.70 1 908.50 1 938.90 1 938.90 1 938.90 15.60 18.54 14.79 14.59 14.41 14.37 15.16 15.16 15.68 15.68 15.68 15.68 15.16 15.95 15.60 15.60 16.05 16.05 16.16 16.42 16.24 16.24 0.31 1.54 0.49 15.60 16.55 13.20 13.03 12.87 12.82 13.53 13.53 13.88 13.88 13.63 13.63 13.19 13.87 13.45 13.45 13.83 13.83 13.93 14.15 14.00 14.00 15.37 16.31 13.01 12.83 12.26 12.64 13.33 13.33 13.88 13.88 13.63 13.63 13.19 13.87 13.45 13.45 13.83 13.83 13.93 14.15 14.00 14.00 12.67 14.61 11.42 11.71 12.66 12.84 13.75 13.81 15.06 14.96 14.25 12.93 12.41 13.16 12.77 13.04 13.72 13.50 13.53 13.47 13.43 13.43 0.45 0.56 -0.73 Barcelona 12.67 13.05 10.20 10.46 11.31 11.46 12.28 12.32 13.32 13.24 12.39 11.24 10.79 11.44 11.01 11.24 11.82 11.64 11.66 11.61 11.58 11.58 12.48 12.86 10.04 10.30 10.77 11.29 12.10 12.14 13.32 13.24 12.39 11.24 10.79 11.44 11.01 11.24 11.82 11.64 11.66 11.61 11.58 11.58 FRANCE 1985 Jan 1986 Jan 1987 Jan 1988 Jan 1989 Jan 1990 Jan 1991 Jan Jul 1992 Jan Jul 1993 Jan Jul 1994 Jan Jul 1995 Jan Jul 1996 Jan Jul 1997 Jan Jul 1998 Jan Jul %ø 85-01/98-01 %0 90-01/98-01 % 97-01/98-01 108.61 104.70 86.68 83.26 82.54 84.58 87.86 89.08 90.26 87.96 86.25 86.25 86.25 84.20 82.84 83.30 84.70 83.85 85.73 88.75 91.42 89.23 -1.32 0.98 6.64 FRF 91.58 88.28 73.09 70.20 70.91 72.63 75.40 76.42 77.42 75.48 74.04 74.04 74.04 72.29 71.00 70.23 70.23 69.53 71.09 73.59 75.81 73.99 91.58 88.28 73.09 70.20 70.91 72.63 75.40 76.42 77.42 75.48 74.04 74.04 74.04 72.29 71.00 70.23 70.23 69.53 71.09 73.59 75.81 73.99 15.04 14.21 11.70 11.34 11.43 11.87 12.70 12.88 13.00 12.67 12.16 12.16 12.11 11.82 11.62 11.68 12.02 11.90 12.29 12.72 13.14 12.83 -1.03 1.28 6.96 12.68 11.98 9.86 9.56 9.82 10.19 10.90 11.05 11.15 10.87 10.44 10.44 10.40 10.15 9.96 9.85 9.97 9.87 10.19 10.55 10.90 10.64 12.68 11.98 9.86 9.56 9.82 10.19 10.90 11.05 11.15 10.87 10.44 10.44 10.40 10.15 9.96 9.85 9.97 9.87 10.19 10.55 10.90 10.64 15.95 15.67 12.60 11.94 11.62 12.22 12.62 12.78 12.97 12.76 12.99 12.98 13.08 12.81 12.60 12.82 13.10 12.96 13.03 13.29 13.82 13.49 -1.10 1.55 6.04 13.45 13.21 10.62 10.07 9.98 10.49 10.83 10.96 11.13 10.95 11.15 11.14 11.22 11.00 10.80 10.80 10.86 10.75 10.80 11.02 11.46 11.19 Paris 13.45 13.21 10.62 10.07 9.98 10.49 10.83 10.96 11.13 10.95 11.15 11.14 11.22 11.00 10.80 10.80 10.86 10.75 10.80 11.02 11.46 11.19
Naturgaspreise
Natural gas prices
Prix du gaz naturel
Hausaltsverbraucher
16,74 GJ/Jahr -Preise pro GJ (HO)
~m
Household consumer 16,74 GJ/Year -Prices per GJ (GCV)
Consommateur domestique 16,74 GJ/an -Prix par GJ (PCS)
Nationale Währung National currency Monnaie nationale Steuern Inbegr. Taxes incl. Taxes comprises Ohne Mehrwert VAT excl. Hors TVA Ohne Steuern Taxes excl. Hors taxes Steuern Inbegr. Taxes incl. Taxes comprises KKS PPS SPA Ohne Mehrwert. VAT excl. Hors TVA Ohne Steuern Taxes excl. Hors taxes Steuern Inbegr. Taxes incl. Taxes comprises ECUS Ohne Mehrwert. VAT excl. Hors TVA Ohne Steuern Taxes excl. Hors taxes IRELAND(1 1985 Jan 1986 Jan 1987 Jan 1988 Jan 1989 Jan 1990 Jan 1991 Jan Jul 1992 Jan Jul 1993 Jan Jul 1994 Jan Jul 1995 Jan Jul 1996 Jan Jul 1997 Jan Jul 1998 Jan Jul %ø 85-01/98-01 %ø 90-01/98-01 % 97-01/98-01 ) 13.04 14.28 13.18 13.18 13.18 11.00 11.25 13.44 13.44 13.44 13.41 13.41 13.41 13.41 13.41 13.41 13.41 13.41 13.41 13.41 13.41 13.41 0.22 2.51 -IEP 12.42 12.98 11.98 11.98 11.98 10.00 10.00 11.95 11.95 11.95 11.92 11.92 11.92 11.92 11.92 11.92 11.92 11.92 11.92 11.92 11.92 11.92 12.42 12.98 11.98 11.98 11.98 10.00 10.00 11.95 11.95 11.95 11.92 11.92 11.92 11.92 11.92 11.92 11.92 11.92 11.92 11.92 11.92 11.92 16.63 17.76 16.41 16.58 16.68 14.79 15.89 18.98 19.48 19.48 18.98 18.98 19.53 19.53 19.58 19.58 19.78 19.78 19.84 19.84 19.72 19.72 1.32 3.66 -0.59 15.84 16.14 14.92 15.07 15.16 13.45 14.12 16.87 17.32 17.32 16.87 16.87 17.36 17.36 17.40 17.40 17.58 17.58 17.63 17.63 17.53 17.53 15.84 16.14 14.92 15.07 15.16 13.45 14.12 16.87 17.32 17.32 16.87 16.87 17.36 17.36 17.40 17.40 17.58 17.58 17.63 17.63 17.53 17.53 18.26 19.96 17.07 16.96 16.92 14.30 14.65 17.50 17.54 17.54 18.08 16.63 17.23 16.76 16.83 16.36 16.44 16.92 18.01 18.16 17.04 17.10 -0.53 2.22 -5.36 17.39 18.14 15.52 15.41 15.38 13.00 13.02 15.56 15.60 15.60 16.07 14.78 15.32 14.90 14.96 14.54 14.61 15.04 16.01 16.15 15.15 15.20 Dublin 17.39 18.14 15.52 15.41 15.38 13.00 13.02 15.56 15.60 15.60 16.07 14.78 15.32 14.90 14.96 14.54 14.61 15.04 16.01 16.15 15.15 15.20 ITALIA 1985 Jan 1986 Jan 1987 Jan 1988 Jan 1989 Jan 1990 Jan 1991 Jan Jul 1992 Jan Jul 1993 Jan Jul 1994 Jan Jul 1995 Jan Jul 1996 Jan Jul 1997 Jan Jul 1998 Jan Jul %ø 85-01/98-01 %ø 90-01/98-01 % 97-01/98-01 18 241 19 082 17 011 16 890 18 727 18 704 16 849 16 849 16 849 16 849 17 659 17 659 19 670 19 722 20 972 23 197 23 197 23 267 23 267 23 302 23 302 23 323 1.90 2.79 0.15 ITL 16 735 17 506 15 606 15 495 17 181 17 160 16 201 16 201 16 201 16 201 16 201 16 201 18 046 18 094 19 241 21 088 21 088 21 152 21 152 21 183 21 183 21 202 15 946 16 718 14 817 14 707 15 160 15 160 15 630 15 630 15 630 15 630 15 630 15 630 16 487 16 535 17 682 17 737 17 737 17 802 17 802 17833 17833 17 852 13.68 13.74 11.91 11.49 12.55 12.16 10.78 10.78 10.61 10.61 10.60 10.60 12.00 12.03 12.37 13.69 13.45 13.49 13.26 13.28 13.28 13.29 -0.23 1.11 0.15 12.55 12.60 10.92 10.54 11.51 11.15 10.37 10.37 10.21 10.21 9.72 9.72 11.01 11.04 11.35 12.44 12.23 12.27 12.06 12.07 12.07 12.09 11.96 12.04 10.37 10.00 10.16 9.85 10.00 10.00 9.85 9.85 9.38 9.38 10.06 10.09 10.43 10.46 10.29 10.33 10.15 10.16 10.16 10.18 13.32 12.78 11.57 11.15 12.17 12.34 10.95 10.95 10.95 10.95 9.71 9.71 10.43 10.26 10.49 10.67 11.37 12.10 12.10 12.12 11.88 11.89 -0.87 -0.47 -1.78 12.22 11.73 10.61 10.23 11.17 11.33 10.53 10.53 10.53 10.53 8.91 8.91 9.56 9.41 9.62 9.70 10.33 11.00 11.00 11.02 10.80 10.81 Roma 11.64 11.20 10.08 9.71 9.85 10.01 10.16 10.16 10.16 10.16 8.60 8.60 8.74 8.60 8.84 8.16 8.69 9.26 9.26 9.27 9.09 9.10
Naturgaspreise
Natural gas prices
Prix du gaz naturel
Hausaltsverbraucher
16,74 GJ/Jahr -Preise pro GJ (HO)
ml
Household consumer
16,74 GJ/Year-Prices per GJ (GCV) 16,74 GJ/an -Prix par GJ (PCS) Consommateur domestique
Naturgaspreise
Natural gas prices
Prix du gaz naturel
Hausaltsverbraucher
16,74 GJ/Jahr -Preise pro GJ (HO)
L ^
Household consumer 16,74 GJ/Year -Prices per GJ (GCV)
Consommateur domestique 16,74 GJ/an -Prix par GJ (PCS) Nationale Währung
National currency Monnaie nationale Steuern
Inbegr. Taxes incl.
Taxes comprises
Ohne Mehrwert VAT excl. Hors TVA
Ohne Steuern Taxes excl. Hors taxes
Steuern Inbegr. Taxes incl.
Taxes comprises
KKS PPS SPA Ohne Mehrwert.
VAT excl. Hors TVA
Ohne Steuern Taxes excl.
Hors taxes
Steuern Inbegr. Taxes incl.
Taxes comprises
ECUS
Ohne Mehrwert. VAT excl.
Hors TVA
Ohne Steuern Taxes excl. Hors taxes
OSTERREICH 1985 Jan
1986 Jan 1987 Jan 1988 Jan 1989 Jan 1990 Jan 1991 Jan Jul 1992 Jan Jul 1993 Jan Jul 1994 Jan Jul 1995 Jan Jul 1996 Jan Jul 1997 Jan Jul 1998 Jan Jul
ATS
137.07 154.98 154.98 154.98 155.06 155.06
114.23 129.15 129.15 129.15 129.22 129.22
114.23 114.23 114.23 114.23 114.28 114.28
9.21 10.41 10.51 10.51 10.53 10.53
7.67 8.67 8.76 8.76 8.78 8.78
7.67 7.67 7.75 7.75 7.76 7.76
10.33 11.52 11.30 11.13 11.16 11.17
Wien
8.60 9.60 9.41 9.28 9.30 9.31
8.60 8.49 8.33 8.20 8.22 8.23 %ø 85-01/98-01
%0 90-01/98-01
% 97-01/98-01 -1.27
PORTUGAL^)
1985 Jan 1986 Jan 1987 Jan 1988 Jan 1989 Jan 1990 Jan 1991 Jan Jul 1992 Jan Jul 1993 Jan Jul 1994 Jan Jul 1995 Jan Jul 1996 Jan Jul 1997 Jan Jul 1998 Jan
Jul %ø 85-01/98-01 %o 90-01/98-01 % 97-01/98-01
1 33.50 1 467.60 1 308.30 1 393.50 1 507.30 1 677.90 1 848.60 2 107.50 2 108.00 2 264.00 2 264.00 2 411.00 2 411.00 2 909.00 2 909.00 2 909.00 3 019.00 3 019.00 3 109.00 3 109.00 3 109.00 3 171.18 6.37 8.01
-PTE
1 393.50 1 358.90 1 211.40 1 290.30 1 395.60 1 553.60 1 711.60 1 951.40 1 951.00 1 951.00 1 951.00 2 296.00 2 296.00 2 770.00 2 770.00 2 770.00 2 875.00 2 875.00 2 961.00 2 961.00 2 961.00 3 020.22
1 393.50 1 358.90 1 211.40 1 290.30 1 395.60 1 553.60 1 711.60 1 951.40 1 951.00 1 951.00 1 951.00 2 296.00 2 296.00 2 770.00 2 770.00 2 770.00 2 875.00 2 875.00 2 961.00 2 961.00 2 961.00 3 020.22
19.97 18.04 14.82 14.84 15.15 15.02 15.82 18.04 16.86 18.11 17.93 19.10 18.97 22.89 22.11 22.11 22.76 22.76 23.22 23.22 22.94 23.40 1.07 5.44 -1.20
19.97 16.70 13.73 13.74 14.03 13.90 14.65 16.70 15.61 15.61 15.45 18.18 18.07 21.80 21.05 21.05 21.68 21.68 22.12 22.12 21.85 22.29
19.97 16.70 13.73 13.74 14.03 13.90 14.65 16.70 15.61 15.61 15.45 18.18 18.07 21.80 21.05 21.05 21.68 21.68 22.12 22.12 21.85 22.29
11.54 10.45 8.26 8.25 8.82 9.36 10.13 11.89 11.93 13.09 12.84 12.66 12.30 14.78 14.84 14.81 15.43 15.34 15.95 15.55 15.39 15.70 2.24 6.41 -3.51
11.54 9.68 7.64 7.64 8.16 8.67 9.38 11.01 11.04 11.28 11.06 12.05 11.71 14.07 14.13 14.10 14.69 14.61 15.19 14.81 14.66 14.95
Lisboa 11.54
9.68 7.64 7.64 8.16 8.67 9.38 11.01 11.04 11.28 11.06 12.05 11.71 14.07 14.13 14.10 14.69 14.61 15.19 14.81 14.66 14.95
Naturgaspreise
Natural gas prices
Prix du gaz naturel
Hausaltsverbraucher
16,74 GJ/Jahr-Preise pro GJ (HO)
ΈΖΔ
Household consumer 16,74 GJ/Year -Prices per GJ (GCV)
Consommateur domestique 16,74 GJ/an -Prix par GJ (PCS) Nationale Währung
National currency Monnaie nationale Steuern
Inbegr. Taxes incl.
Taxes comprises
Ohne Mehrwert VAT excl. Hors TVA
Ohne Steuern Taxes excl. Hors taxes
Steuern Inbegr. Taxes incl.
Taxes comprises
KKS PPS SPA Ohne Mehrwert. VAT excl.
Hors TVA
Ohne Steuern Taxes excl. Hors taxes
Steuern Inbegr. Taxes incl.
Taxes comprises
ECUS
Ohne Mehrwert. VAT excl.
Hors TVA
Ohne Steuern Taxes excl. Hors taxes
SUOMI/FINLAND
1985 Jan 1986 Jan 1987 Jan 1988 Jan 1989 Jan 1990 Jan 1991 Jan Jul 1992 Jan
Jul 1993 Jan
Jul 1994 Jan
Jul 1995 Jan
Jul 1996 Jan
Jul 1997 Jan
Jul 1998 Jan
Jul
FIM National
%ø 85-01/98-01 %0 90-01/98-01 % 97-01/98-01
SVERIGE
1985 Jan 1986 Jan 1987 Jan 1988 Jan 1989 Jan 1990 Jan 1991 Jan Jul 1992 Jan Jul 1993 Jan
Jul 1994 Jan
Jul 1995 Jan
Jul 1996 Jan
Jul 1997 Jan Jul 1998 Jan
Jul
SEK National
134.75 135.00 135.00 135.00 135.00
108.35 108.10 108.10 108.10 108.10
84.74 84.70 81.70 81.70 81.70
12.47 12.49 12.49 12.41 12.41
10.03 10.00 10.00 9.94 9.94
7.84 7.84 7.56 7.51 7.51
15.97 15.74 15.65 15.49 15.40
12.84 12.60 12.53 12.40 12.33
10.04 9.87 9.47 9.37 9.32
%ø 85-01/98-01 %0 90-01/98-01
Naturgaspreise
Natural gas prices
Prix du gaz naturel
Hausaltsverbraucher16,74 GJ/Jahr-Preise pro GJ (HO)
Household consumer 16,74 GJ/Year-Prices per GJ (GCV)
~m
Consommateur domestique 16,74 GJ/an -Prix par GJ (PCS)
Nationale Währung National currency Monnaie nationale Steuern
Inbegr. Taxes incl.
Taxes comprises
Ohne Mehrwert VAT excl. Hors TVA
Ohne Steuern Taxes excl. Hors taxes
Steuern Inbegr. Taxes incl.
Taxes comprises
KKS PPS SPA Ohne Mehrwert.
VAT excl. Hors TVA
Ohne Steuern Taxes excl. Hors taxes
Steuern Inbegr. Taxes incl.
Taxes comprises
ECUS
Ohne Mehrwert.
VAT excl. Hors TVA
Ohne Steuern Taxes excl. Hors taxes
UNITED KINGDOM
1985 Jan 1986 Jan 1987 Jan 1988 Jan 1989 Jan 1990 Jan 1991 Jan Jul 1992 Jan
Jul 1993 Jan
Jul 1994 Jan
Jul 1995 Jan
Jul 1996 Jan
Jul 1997 Jan
Jul 1998 Jan
Jul %o 85-01/98-01 %0 90-01/98-01 % 97-01/98-01
5.70 5.87 5.73 5.42 5.73 5.85 6.44 6.60 6.60 6.43 6.30 6.30 6.30 6.81 6.68 6.68 6.68 6.42 6.42 6.33 6.15 5.38 0.59 0.63
-Α2Λ
GBP
5.70 5.87 5.73 5.42 5.73 5.85 6.44 6.60 6.60 6.43 6.30 6.30 6.30 6.30 6.18 6.18 6.18 5.95 5.95 5.86 5.86 5.12
5.70
5.87
5.73 5.42 5.73
5.85 6.44
6.60 6.60 6.43 6.30 6.30 6.30 6.30
6.18
6.18 6.18
5.95
5.95 5.86 5.86 5.12
9.39 9.67 9.20 8.55 8.87 9.01 9.55 9.78 9.91 9.65 9.16 9.16 9.08
9.81
9.54 9.54 9.57 9.20 9.18 9.06 8.72 7.63
-0.57 -0.41 -5.02
9.39 9.67
9.20
8.55
8.87 9.01
9.55 9.78 9.91 9.65 9.16 9.16 9.08 9.08 8.83
8.83
8.85 8.52 8.51 8.38 8.31 7.26
9.39 9.67 9.20 8.55 8.87 9.01 9.55 9.78 9.91 9.65 9.16 9.16 9.08 9.08 8.83 8.83 8.85 8.52 8.51 8.38 8.31 7.26
9.16 9.38 7.76 7.81 8.94 8.03 9.18 9.47 9.24 9.00 7.97 8.29 8.44 8.61 8.47 7.92 7.91 7.85 8.77 9.58 9.25 8.06 0.07 1.77 5.49
9.16 9.38 7.76 7.81 8.94 8.03 9.18 9.47
9.24
9.00 7.97 8.29 8.44 7.97 7.84 7.33 7.32 7.28
8.12
8.87 8.81 7.67
London 9.16 9.38 7.76
7.81 8.94 8.03 9.18
9.47
9.24 9.00 7.97
8.29
8.44 7.97 7.84 7.33 7.32 7.28 8.12 8.87
8.81
Naturgaspreise
Natural gas prices
Prix du gaz naturel
Hausaltsverbraucher
125,6 GJ/Jahr -Preise pro GJ (HO)
ΈΔ
Household consumer
125,6 GJ/Year-Prices per GJ (GCV) 125,6 GJ/an -Prix par GJ (PCS) Consommateur domestique Nationale Währung
National currency Monnaie nationale Steuern Inbegr. Taxes incl. Taxes comprises Ohne Mehrwert VAT excl. Hors TVA Ohne Steuern Taxes excl. Hors taxes Steuern Inbegr. Taxes incl. Taxes comprises KKS PPS SPA Ohne Mehrwert. VAT excl. Hors TVA Ohne Steuern Taxes excl. Hors taxes Steuern Inbegr. Taxes incl. Taxes comprises ECUS Ohne Mehrwert. VAT excl. Hors TVA Ohne Steuern Taxes excl. Hors taxes BELGIQUE/BELGIE 1985 Jan 1986 Jan 1987 Jan 1988 Jan 1989 Jan 1990 Jan 1991 Jan Jul 1992 Jan Jul 1993 Jan Jul 1994 Jan Jul 1995 Jan Jul 1996 Jan Jul 1997 Jan Jul 1998 Jan Jul %ø 85-01/98-01 %ø 90-01/98-01 % 97-01/98-01 450.70 431.00 298.60 292.50 278.60 309.54 330.20 327.00 318.70 313.60 309.60 308.70 331.10 326.20 326.20 325.50 322.00 324.80 336.50 347.90 346.00 331.50 -2.01 1.40 2.82 BEF 385.30 368.40 255.20 250.00 238.10 264.56 282.20 279.50 272.40 262.40 259.10 258.40 274.80 270.70 270.70 270.20 266.20 268.40 278.10 287.60 286.00 274.00 385.30 368.40 255.20 250.00 238.10 264.56 282.20 279.50 272.40 262.40 259.10 258.40 261.10 257.00 257.10 256.50 252.50 254.80 264.40 273.90 272.30 260.30 10.21 9.71 6.73 6.75 6.46 7.28 7.93 7.86 7.80 7.67 7.69 7.67 8.26 8.14 8.10 8.08 8.07 8.14 8.54 8.83 8.78 8.41 -1.16 2.37 2.78 8.73 8.30 5.75 5.77 5.52 6.22 6.78 6.72 6.67 6.42 6.44 6.42 6.85 6.75 6.72 6.71 6.67 6.72 7.06 7.30 7.26 6.95 8.73 8.30 5.75 5.77 5.52 6.22 6.78 6.72 6.67 6.42 6.44 6.42 6.51 6.41 6.38 6.37 6.33 6.38 6.71 6.95 6.91 6.60 10.12 9.68 6.97 6.77 6.38 7.26 7.82 7.73 7.59 7.45 7.68 7.66 8.20 8.25 8.33 8.48 8.30 8.25 8.37 8.52 8.49 8.15 -1.35 1.97 1.38 Bruxelles 8.65 8.65 8.28 8.28 5.95 5.95 5.79 5.79 5.45 5.45 6.21 6.21 6.69 6.69 6.61 6.61 6.49 6.49 6.24 6.24 6.43 6.43 6.41 6.41 6.81 6.47 6.85 6.50 6.91 6.56 7.04 6.68 6.86 6.51 6.82 6.47 6.92 6.58 7.04 6.71 7.02 6.68 6.73 6.40 DANMARK 1985 Jan 1986 Jan 1987 Jan 1988 Jan 1989 Jan 1990 Jan 1991 Jan Jul 1992 Jan Jul 1993 Jan Jul 1994 Jan Jul 1995 Jan Jul 1996 Jan Jul 1997 Jan Jul 1998 Jan Jul %ø 85-01/98-01 %ø 90-01/98-01 % 97-01/98-01
(1)
118.47 118.93 95.34 106.49 118.00 149.03 238.16 218.13 240.58 237.26 159.20 164.34 147.84 141.46 142.38 138.73 152.34 171.88 171.80 164.68 183.89 190.51 3.44 2.66 7.04 DKK 97.11 97.48 78.15 87.29 96.72 122.16 195.21 178.79 192.46 189.81 127.36 131.47 118.27 113.17 113.90 110.98 121.87 137.50 137.44 131.74 147.11 152.41 97.11 97.48 78.15 87.29 96.72 122.16 195.21 178.79 192.46 189.81 127.36 131.47 118.27 113.17 113.90 110.98 116.11 131.74 131.67 125.97 141.35 140.62 11.65 11.55 9.05 10.19 11.39 14.72 24.43 22.37 24.33 23.99 16.79 17.34 15.79 15.11 15.17 14.78 16.39 18.49 18.57 17.80 19.74 20.46 4.14 3.74 6.33 9.55 9.46 7.42 8.35 9.34 12.07 20.02 18.34 19.46 19.19 13.44 13.87 12.63 12.08 12.13 11.82 13.11 14.80 14.85 14.24 15.80 16.36 9.55 9.46 7.42 8.35 9.34 12.07 20.02 18.34 19.46 19.19 13.44 13.87 12.63 12.08 12.13 11.82 12.49 14.18 14.23 13.61 15.18 15.10 14.90 14.90 12.18 13.43 14.62 18.90 30.19 27.46 30.39 30.18 21.07 21.75 19.60 18.77 19.01 19.07 20.86 23.33 23.11 21.85 24.44 25.34 3.88 3.26 5.76 Kobenhavn 12.22 12.21 9.98 11.01 11.99 15.49 24.75 22.51 24.31 24.14 16.86 17.40 15.68 15.02 15.21 15.25 16.69 18.66 18.48 17.48 19.55 20.27 12.22 12.21 9.98 11.01 11.99 15.49 24.75 22.51 24.31 24.14 16.86 17.40 15.68 15.02 15.21 15.25 15.90 17.88 17.71 16.72 18.78 18.70